 Triplex
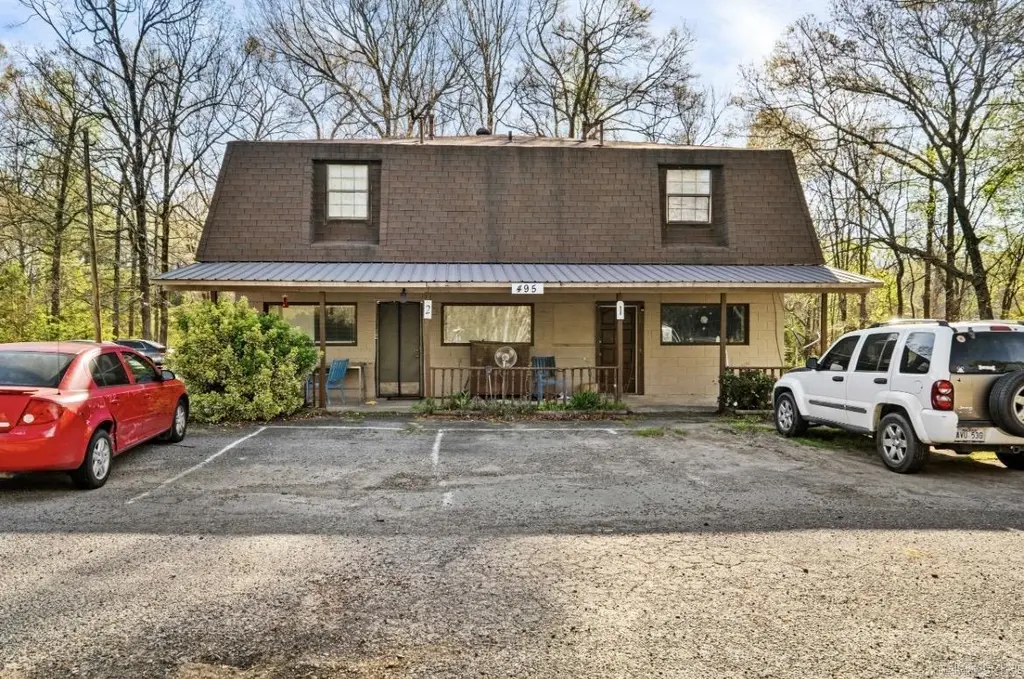
495 Highway 365 · Mayflower, AR
Flood risk No data
- FEMA flood zone
- —
- Chance of flooding over 30 yrs
- —
- Est. flood insurance / yr
- —
Fire risk No data
- Est. fire insurance / yr
- —
Heat risk No data
- Hot days now (above threshold)
- —
- Hot days in 30 yrs
- —
Wind risk No data
- Chance of severe wind over 30 yrs
- —
Air-quality risk No data
- Unhealthy air days now
- —
- Unhealthy air days in 30 yrs
- —
Risk factors via First Street. Map © Google.
Why this score? — see what drove the C grade
The composite is a weighted blend of 9 inputs, each scored 0–100. Each bar is that input's sub-score; the figure is the points it added to the 100-point composite (weight × sub-score).
- Cash flow +19.5/30.0
- Appreciation +9.8/10.0
- ARV discount +7.5/15.0
- DSCR +6.2/10.0
- 1% rule +5.2/10.0
- Schools +2.8/10.0
- Livability +2.8/5.0
- Rent growth +2.5/5.0
- Condition / age +2.5/5.0
$495,000
🖨 Deal sheet 📄 Offer letter ✓ Due diligence
Multi-family units
County records classify this as Multi-Family (5+ Unit). Listing-text estimate: 3 units. estimate disagrees with records
5+ unit building — per-unit beds/baths from public records are typically unavailable; the breakdown below (if shown) is an estimate from the listing text.
Listing remarks MLS
Exceptional Mixed-Use investment opportunity in Mayflower! This well positioned property features 9 units with 5(five) commercial units on the ground level and 4(four) residential units above, offering the perfect blend of steady income streams and long term growth potential. Situated in a growing area with easy access to major road ways. Recent updates to the 5 commercial units include new floors & drywall. Call today arrange a private showing.
Key facts
- New floors
- 4 residential units
- Recent updates
Tags
Neighborhood map
What this means for you Summary
Snapshot
- This is a 3 × 3-bed/?-bath units multifamily listed at $495k.
Deal economics
- At list price, monthly cash flow is $559 ($7k/yr) — positive. Per door: $186/mo.
- The deal already cash-flows at list — no discount required.
- Meets the 1% rule at list price ($5k rent vs $495k).
- Recommended offer: $465k (6.0% below list) — sets the bar for market timing.
- Cap rate 7.6% vs local median 4.8% in Mayflower — top-decile yield for the area; either an underpriced asset or a hidden risk that comps aren't pricing in. Stress-test before assuming the spread holds.
Location & tenants
- Location reads 56/100 on livability (#390 in AR) — a working-class tenant base; expect higher turnover. Strengths: cost of living A+, housing B+; Watch: schools F, crime F, amenities F.
- Mayflower School District (rural): math 32% / reading 34% proficiency, ranked #127 of 238 in AR (top 53%) — families likely to look elsewhere, expect single-tenant / working-renter base with shorter leases.
- Market conditions: 110 active listings in the ZIP; 865 units permitted in Faulkner County in 2024 (451 in 5+ unit buildings).
Forward outlook
- In year one you build about $51k of equity ($3k loan paydown + $48k appreciation (9.6% local appreciation)).
- Faulkner County population projected at +32% by 2050 — long-run rental-demand tailwind backs the buy-and-hold thesis.
- At projected returns (9.6% appreciation + 3.0% rent growth), your $139k cash investment doubles in ~3 years — after that, you're playing with house money.
- By year 2, paydown + projected appreciation supports a ~$82k cash-out refi (75% LTV) — recoverable capital for the next deal without selling this one.
Negotiation context
- It's been on market 86 days — a 6% lower offer ($465k) is reasonable based on typical stale-listing flexibility.
- 2 sale attempts since 13y ago with the ask held roughly flat each time — persistent listings suggest the price (not the market) is what's stuck; bring a comps-based counter.
Questions for the listing agent
- It's been on market 86 days. Have you received any prior offers? Is the seller open to a 6% concession, seller financing, or rate buy-down credit?
- Can we see the unit-by-unit rent roll, current vacancy, and any below-market leases? What's the average tenancy length?
- What capital expenditures (roof, boiler, parking lot, exteriors) have been made in the last 5 years, and what's planned in the next 2?
- Why hasn't it sold? Are there any deal-killer items the seller is aware of (foundation, flood, title, zoning, code violations)?
- Is there a deadline driving the sale (1031 exchange, divorce, estate, relocation)? That informs how much negotiation room exists.
- Schools are F-rated, which usually means shorter tenancies and higher turnover. Who's the typical renter profile here, and what's been the actual vacancy rate?
- Crime grade is F in this area — have there been break-ins, vandalism, or insurance claims at this property in the last 3 years? What carrier currently insures it and at what premium?
- What's the average days-on-market for RENTAL listings here right now (not sales)? A rising rental-DOM trend means longer vacancies and softer asking-rent achievability than the comps imply.
- What's the recent tenant-quality profile in this submarket — average credit score on applications, eviction rate, late-payment / NSF rate, and stable-employment percentage? A property-management company in the area should have these aggregated.
- How much new apartment / multifamily construction is in the pipeline within 1–3 miles? Heavy new supply (>2% of stock underway) typically softens rents 12–24 months out; light construction supports rent growth.
Investment metrics
- 1% rule
- 1.02% ✓
- Cap rate
- 7.65%
- Cash-on-cash
- 4.84%
- DSCR
- 1.22
- GRM
- 8.2
CMA / ARV
No comps found within radius.
Projected returns pro-forma
9.62% appreciation · 3.0% rent growth · sell at horizon
- IRR
- 27.0%
- Equity multiple
- 3.11×
- Total profit
- $292,369
- Equity at exit
- $432,199
- IRR
- 23.7%
- Equity multiple
- 6.99×
- Total profit
- $829,916
- Equity at exit
- $917,814
Cash invested: $138,600 (down + closing). Projections, not guarantees.
Landlord ↔ Tenant lean methodology
- Overall (STATE)
- 92 Strongly Landlord-Friendly
- State Arkansas
- 92 Strongly Landlord-Friendly · R+14
- County
- — inherits STATE
- City
- — inherits STATE
ZIP-level market 72106
- Home prices YoY
- 4.2%
- Active inventory
- 110
- Price-to-rent
- 24.6×
Monthly cashflow live
- Estimated rent
- $5,038 medium interval (Pro) →
- Mortgage (P&I)
- −$2,596
- Tax est. 1.5%
- −$619 /mo · $7,425/yr
- Insurance
- −$206
- HOA
- −$0
- Vacancy / Maint / Mgmt
- −$1,058
- Net cashflow
- $559
Break-even live
3-unit breakdown (identical units grouped — click to expand)
| Units | Beds | Baths | Est. rent |
|---|---|---|---|
| 3× units | 3 | — | $5,037 |
| #1 | 3 | — | $1,679 |
| #2 | 3 | — | $1,679 |
| #3 | 3 | — | $1,679 |
| Total (3 units) | $5,038 | ||
UW: 25.0% down · 7.5% · 30yr · 1.5% tax · 5.0% vac · 8.0% maint · 8.0% mgmt
Financing live
Cash to close
- Down payment
- $123,750
- Closing costs
- $14,850
- Reserves months
- —
- Total cash needed
- —
Loan-product check · same deal, 3 products live
Conventional
25% down · 7.5% · 30yr
- Down + closing
- —
- Monthly P&I
- —
- Monthly cashflow
- —
- DSCR
- —
- Eligible?
- —
Personal DTI + credit; lowest rate.
DSCR
20% down · 8.5% · 30yr
- Down + closing
- —
- Monthly P&I
- —
- Monthly cashflow
- —
- DSCR
- —
- Eligible?
- —
No personal income docs; deal must DSCR.
Hard money
10% down · 12.0% · 12mo
- Down + closing
- —
- Monthly P&I
- —
- Monthly cashflow
- —
- DSCR
- —
- Eligible?
- —
Short-term bridge; refi at stabilization.
Listing history 19 events
-
2026-06-18days on market $495,000 Active 86 DOM
-
2026-06-17days on market $495,000 Active 85 DOM
-
2026-06-16days on market $495,000 Active 84 DOM
-
2026-06-15days on market $495,000 Active 83 DOM
-
2026-06-14days on market $495,000 Active 81 DOM
-
2026-06-10days on market $495,000 Active 78 DOM
-
2026-06-09days on market $495,000 Active 77 DOM
-
2026-06-08days on market $495,000 Active 76 DOM
-
2026-06-07remarks 522-char remark
-
2026-06-07days on market $495,000 Active 75 DOM
-
2026-06-05days on market $495,000 Active 72 DOM
-
2026-06-03days on market $495,000 Active 71 DOM
-
2026-06-02days on market $495,000 Active 70 DOM
-
2026-06-01days on market $495,000 Active 69 DOM
-
2026-05-31days on market $495,000 Active 68 DOM
-
2026-05-31days on market $495,000 Active 67 DOM
-
2026-03-24$495,000 New Listing 455-char remark
Show marketing remark (455 chars)
Exceptional Mixed-Use investment opportunity in Mayflower! This well positioned property features 9 units with 5(five) commercial units on the ground level and 4(four) residential units above, offering the perfect blend of steady income streams and long term growth potential. Situated in a growing area with easy access to major road ways. Recent updates to the 5 commercial units include new floors & drywall. Call today arrange a private showing.
-
2013-09-03historical
-
2013-06-20$229,000
ⓘ Source: listings_history table (triggers on properties + properties_extension) + one-shot
backfill from property_details.listing_events for pre-trigger history.
Nearby sold comps map
Loading sold comps map…
Walkable amenities ~0.75 mi
Loading nearby amenities…
Taxation est. · year 1
- Rental income
- $60,456
- − Mortgage interest
- −$27,728
- − Property taxes
- −$7,425
- − Insurance
- −$2,475
- − Repairs & maintenance
- −$4,836
- − Management
- −$4,836
- − Depreciation
- −$14,400
- Taxable loss
- −$1,245
- Est. tax savings @ 24.0%
- +$299
- After-tax cash flow
- $7,009/yr
For passive investors: Depreciation is non-cash, so a rental often shows a tax loss while cash-flowing — sheltering income. Rental losses are passive: they offset passive income freely, and up to $25,000/yr can offset ordinary (W-2) income if you actively participate and your MAGI is under $100k (phasing out to $0 by $150k); unused losses carry forward. On sale, claimed depreciation is recaptured at up to 25%, and gains may owe capital-gains tax (a 1031 exchange can defer both). Figures are a year-1 estimate at your 24.0% rate — not tax advice; consult a CPA.
Schools (NCES district)
- District
- Mayflower School District
- NCES district ID
- 0509540
- Math proficiency
- 32% ▼ -9.00%
- Reading proficiency
- 34% ▼ -6.00%
- Median HH income
- $47,119
- Composite
- 28.41/100
- National rank
- #6760
- State rank
- #127 of 238 in AR
Livability — Mayflower
- Score
- 56/100
- State rank
- #390
- US rank
- #22893
Category grades
Schools grade is shown separately in the Schools card above.
Census & demographics
- Census place
- Mayflower, AR
- Population (ZIP)
- 5,719
Population outlook (Faulkner County) Hauer SSP2
- Today (2025)
- 138,985 people
- By 2030
- 148,264 · +6.7%
- By 2040
- 166,010 · +19.4%
- By 2050
- 183,362 · +31.9%
- By 2075
- 224,593 · +61.6%
- By 2100
- 250,603 · +80.3%
Race, ethnicity, and origin ACS 2023
- Neighborhood character
- Predominantly White (86%)
- Race & ethnicity
- White 86% Two or more races 7% Black 6% Hispanic / Latino 1%
- Common ancestry
- Slovak 3% Lithuanian 1% Italian 1%
- Foreign-born
- 6% · Canada
Political lean MEDSL · Faulkner
- 2024 margin
- Solid R (+32.3) · D 32.6% · R 64.9% · Other 2.5%
- 2008→2024 swing
- -7.1pp toward R · 2008: -25.3pp · 2024: -32.3pp
- All cycles
- 2024: R+32.3 2020: R+29.5 2016: R+31.6 2012: R+31.7 2008: R+25.3
Not yet ingested
- Civics
- —
Market trends
- HPI YoY
- ▲ 9.62%
- Current HPI
- 236.6197
- Rent YoY
- —
- Metro
- —
- State GDP YoY
- ▲ 3.80%
- F500 in state
- 10
Industry mix (Fortune 500 HQ in AR)
| Industry | F500 HQs | Revenue |
|---|---|---|
| Retail | 1 | $681B |
|
||
| Food / Agriculture | 1 | $53B |
|
||
| Retail / Energy | 1 | $22B |
|
||
| Transportation / Logistics | 1 | $12B |
|
||
| Energy | 1 | $4B |
|
||
Price history
+116.2% since first listed3 events — show timeline
- 2026-03-24 Listed $495,000 CARMLS
- 2013-09-03 Listing Removed — CARMLS
- 2013-06-20 Listed $229,000 CARMLS
Cash-flow waterfall
monthlySold comps — $/sqft
last 12 mo · ≤1 miLoading sold comps…