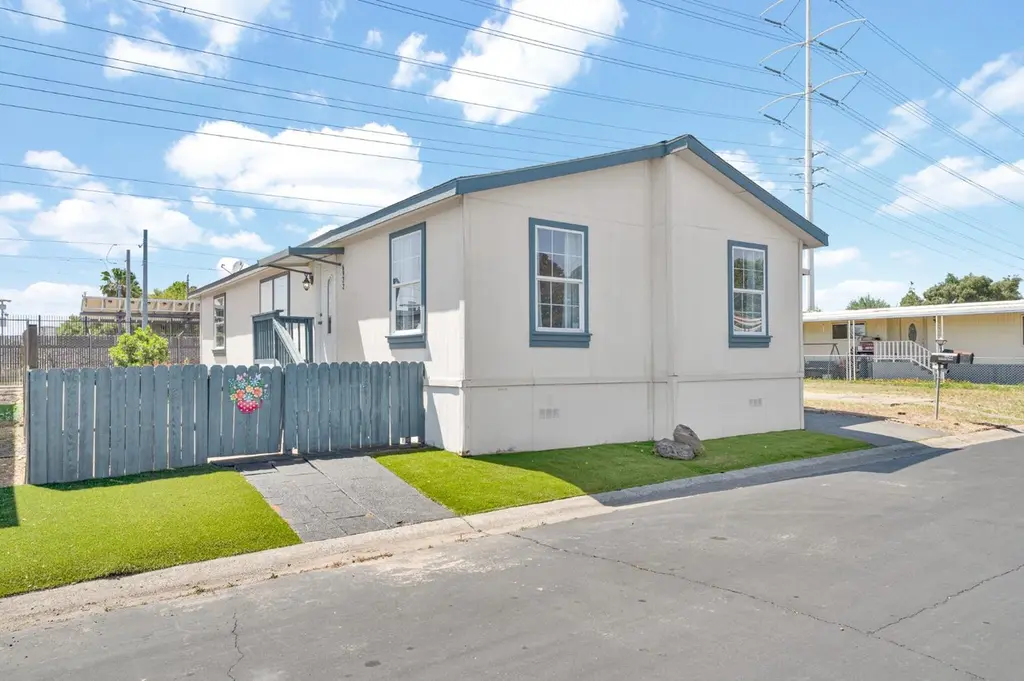
6922 Sundown · Sacramento, CA
Flood risk 1/10 · Minimal
- FEMA flood zone
- X
- Chance of flooding over 30 yrs
- 0.0%
- Est. flood insurance / yr
- $507 – $1,088
Fire risk 1/10 · Minimal
- Est. fire insurance / yr
- $659 – $1,223
Heat risk 7/10 · Major
- Hot days now (above 102°F)
- 6 days/yr
- Hot days in 30 yrs
- 13 days/yr
Wind risk 1/10 · Minimal
- Chance of severe wind over 30 yrs
- —
Air-quality risk 10/10 · Severe
- Unhealthy air days now
- 25 days/yr
- Unhealthy air days in 30 yrs
- 26 days/yr
Risk factors via First Street. Map © Google.
Why this score? — see what drove the B- grade
The composite is a weighted blend of 9 inputs, each scored 0–100. Each bar is that input's sub-score; the figure is the points it added to the 100-point composite (weight × sub-score).
- Cash flow +30.0/30.0
- 1% rule +10.0/10.0
- DSCR +10.0/10.0
- ARV discount +5.2/15.0
- Livability +3.6/5.0
- Schools +3.5/10.0
- Rent growth +2.5/5.0
- Condition / age +2.5/5.0
- Appreciation +0.0/10.0
$145,000
🖨 Deal sheet 📄 Offer letter ✓ Due diligence
Listing remarks
Welcome to 6922 Sundown Dr in Sacramento! Located inside Southgate Mobile Estates, this well-built Fleetwood Homes manufactured home is move-in ready and packed with recent upgrades, including newer central HVAC, a newer water heater, fresh interior paint, and stylish new flooring throughout. The functional layout offers comfortable everyday living with a bright and inviting feel from the moment you walk in. Designed for low-maintenance living, this home is perfect for buyers looking for convenience, affordability, and comfort all in one. Enjoy an affordable Sacramento lifestyle with community amenities and convenient access to shopping, dining, parks, and freeway access nearby!
Key facts
- Stylish new flooring
- Newer central hvac
- Community amenities
Tags
Property features AI
Finance
- Other: Located in Sacramento, CA 95823; Cross street: Florin Rd
- HOA & community: No homeowners association; Not a senior community; Land lease: No (listed land lease amount present)
Exterior
- Parking: Covered parking
- Utilities: Gas plumbed; Public water; Public sewer; 220 volts in laundry
- Home design: Manufactured home in a park; Double-wide; Built in 2003
- Construction: Wood skirting; Fleetwood manufacturer; Waterford Series model
- Exterior features: Backyard; Fenced yard; Regular-shaped lot; Shingle/composition roof
Interior
- Kitchen: Free-standing gas range; Dishwasher; Pantry closet; Laminate countertops
- Bedrooms: 3 bedrooms
- Flooring: Vinyl flooring
- Bathrooms: 2 full bathrooms; Tub with shower over
- Heating & cooling: Central heating; Central cooling
- Interior features: Dual-pane full windows; Porch steps; Pantry closet; Laminate countertops; Dining and family room combined; Living room with flexible/other features
- Laundry & utility: Indoor laundry room; Electric hook-up; Gas hook-up; 220V in laundry
Neighborhood map
What this means for you Summary
Snapshot
- This is a 3-bed/2.0-bath manufactured listed at $145k.
Deal economics
- At list price, monthly cash flow is $853 ($10k/yr) — positive.
- The deal already cash-flows at list — no discount required.
- Meets the 1% rule at list price ($2k rent vs $145k).
- Recommended offer: $143k (1.5% below list) — sets the bar for market timing.
- Cap rate 13.4% vs local median 3.0% in Sacramento — top-decile yield for the area; either an underpriced asset or a hidden risk that comps aren't pricing in. Stress-test before assuming the spread holds.
Location & tenants
- Location reads 71/100 on livability (#218 in CA) — a middle-class / working-renter tenant base. Strengths: amenities A+, commute A+, housing A; Watch: schools D+, crime F, cost of living F.
- Sacramento City Unified (urban): math 32% / reading 43% proficiency, ranked #804 of 1,400 in CA (top 57%) — families likely to look elsewhere, expect single-tenant / working-renter base with shorter leases; 63% free/reduced lunch — lower-income household profile, screen leases tightly.
- Market conditions: Rents flat; 181 active listings in the ZIP; 34 comparable units currently listed for rent nearby; rentals at typical pace (median 24d on market — plan ~3-4 weeks tenant-placement turnaround); 44% of comp listings sitting > 30 days — soft ceiling on asking rent; 6,825 units permitted in Sacramento County in 2024 (1,752 in 5+ unit buildings).
- This rent runs 39% of the median local income ($67k/yr) — at the standard rent-burdened threshold; future hikes will face affordability resistance.
Forward outlook
- Local home prices are declining (-3.0%/yr); year-one equity from $1k of loan paydown is wiped out by about $4k of value loss. Plan a longer hold.
- Sacramento County population projected at +17% by 2050 — long-run rental-demand tailwind backs the buy-and-hold thesis.
- At projected returns (-3.0% appreciation + 0.0% rent growth), your $41k cash investment doubles in ~6 years — after that, you're playing with house money.
Negotiation context
- It's been on market 21 days — a 2% lower offer ($143k) is reasonable based on typical stale-listing flexibility.
Risks & watch-outs
- Climate carrying-cost: extreme-heat days projected 6→13/yr by 2055 (HVAC capex compounding) — expect insurance premiums to compound above CPI over the hold.
Questions for the listing agent
- Is there a deadline driving the sale (1031 exchange, divorce, estate, relocation)? That informs how much negotiation room exists.
- Schools are D-rated, which usually means shorter tenancies and higher turnover. Who's the typical renter profile here, and what's been the actual vacancy rate?
- Crime grade is F in this area — have there been break-ins, vandalism, or insurance claims at this property in the last 3 years? What carrier currently insures it and at what premium?
- What's the average days-on-market for RENTAL listings here right now (not sales)? A rising rental-DOM trend means longer vacancies and softer asking-rent achievability than the comps imply.
- What's the recent tenant-quality profile in this submarket — average credit score on applications, eviction rate, late-payment / NSF rate, and stable-employment percentage? A property-management company in the area should have these aggregated.
- How much new for-sale + rental construction is in the pipeline within 1–3 miles? Heavy new supply typically softens prices + rents 12–24 months out; constrained supply supports both.
Investment metrics
- 1% rule
- 1.51% ✓
- Cap rate
- 13.35%
- Cash-on-cash
- 25.22%
- DSCR
- 2.12
- GRM
- 5.5
CMA / ARV
- ARV (on-the-fly)
- $138,000
- Comps found
- 5
Show comp detail 5 sales within ~0.75 mi
| Address | Dist | Beds/Ba | Sqft | Sold | Price | $/sf | Match |
|---|---|---|---|---|---|---|---|
| 6882 N Tranquility Dr | 0.16mi | 3/2.0 | 1,248 (+4%) | 2mo | $85,000 | $68 | 84 |
| 3317 Turnbridge Dr | 0.19mi | 3/2.0 | 1,152 (-4%) | 5mo | $120,000 | $104 | 80 |
| 6994 Devotion Ln | 0.18mi | 2/2.0 (-1) | 1,155 (-4%) | 15mo | $140,000 | $121 | 68 |
| 154 Cooper Ave | 0.49mi | 2/2.0 (-1) | 1,200 (0%) | 10mo | $139,000 | $116 | 64 |
| 1 Bentley Ave | 0.51mi | 2/2.0 (-1) | 1,258 (+5%) | 7mo | $145,000 | $115 | 57 |
Match score weights: distance 35% · size 25% · config 20% · recency 20%. Top-matched comps best support the ARV.
Projected returns pro-forma
-3.0% appreciation · 0.02% rent growth · sell at horizon
- IRR
- 15.5%
- Equity multiple
- 1.60×
- Total profit
- $24,417
- Equity at exit
- $21,620
- IRR
- 22.0%
- Equity multiple
- 2.63×
- Total profit
- $66,377
- Equity at exit
- $12,537
Cash invested: $40,600 (down + closing). Projections, not guarantees.
Landlord ↔ Tenant lean methodology
- Overall (STATE)
- 18 Strongly Tenant-Friendly
- State California
- 18 Strongly Tenant-Friendly · D+13
- County
- — inherits STATE
- City
- — inherits STATE
ZIP-level market 95823
- Rents YoY
- 0.0%
- Active inventory
- 181
- Price-to-rent
- 5.5×
Monthly cashflow live
- Estimated rent
- $2,193 high interval (Pro) →
- Mortgage (P&I)
- −$760
- Tax from tax record
- −$58 /mo · $700/yr
- Insurance
- −$60
- HOA
- −$0
- Vacancy / Maint / Mgmt
- −$460
- Net cashflow
- $853
Break-even live
UW: 25.0% down · 7.5% · 30yr · 1.5% tax · 5.0% vac · 8.0% maint · 8.0% mgmt
Financing live
Cash to close
- Down payment
- $36,250
- Closing costs
- $4,350
- Reserves months
- —
- Total cash needed
- —
Loan-product check · same deal, 3 products live
Conventional
25% down · 7.5% · 30yr
- Down + closing
- —
- Monthly P&I
- —
- Monthly cashflow
- —
- DSCR
- —
- Eligible?
- —
Personal DTI + credit; lowest rate.
DSCR
20% down · 8.5% · 30yr
- Down + closing
- —
- Monthly P&I
- —
- Monthly cashflow
- —
- DSCR
- —
- Eligible?
- —
No personal income docs; deal must DSCR.
Hard money
10% down · 12.0% · 12mo
- Down + closing
- —
- Monthly P&I
- —
- Monthly cashflow
- —
- DSCR
- —
- Eligible?
- —
Short-term bridge; refi at stabilization.
Rent comps 34 comps
| Address | Beds | Baths | Sqft | Rent | $/sqft | DOM | Units | Dist |
|---|---|---|---|---|---|---|---|---|
| 6855 Carnation Ave Unit 6855 Sacramento, CA | 2.0 | 2.0 | 1100 | $2,025 | $1.84 | 2d | 1 | 0.35mi |
| 7400 Loma Verde Way Unit 1 Sacramento, CA | 2.0 | 1.0 | 860 | $2,100 | $2.44 | 2d | 1 | 0.63mi |
| 3249 Torrance Ave Sacramento, CA | 3.0 | 3.0 | 1258 | $2,599 | $2.07 | 23d | 1 | 0.68mi |
| 3912 49th Ave Apt 10 Sacramento, CA | 2.0 | 1.0 | 811 | $1,895 | $2.34 | 43d | 1 | 0.72mi |
| 3912 49th Ave Unit 9 Sacramento, CA | 2.0 | 1.0 | 811 | $1,795 | $2.21 | 43d | 1 | 0.72mi |
| 2360 53rd Ave Sacramento, CA | 3.0 | 1.5 | 1474 | $2,495 | $1.69 | 43d | 1 | 0.74mi |
| 4197 Cuny Ave Unit 3 Sacramento, CA | 2.0 | 1.0 | 1051 | $2,000 | $1.90 | 17d | 1 | 0.84mi |
| 4417 A Pkwy Sacramento, CA | 3.0 | 2.0 | 1440 | $2,200 | $1.53 | 43d | 1 | 0.92mi |
| 7051 Bowling Dr Sacramento, CA | 1.0–2.0 | 1.0–1.5 | 716 | $1,445 | $2.02 | 2d | 5 | 0.94mi |
| 74 La Fresa Ct #3 Sacramento, CA | 2.0 | 1.0 | 840 | $1,950 | $2.32 | 43d | 1 | 0.98mi |
| 6739 Ferrier Ct Sacramento, CA | 3.0 | 2.0 | 1106 | $2,325 | $2.10 | 23d | 1 | 1.00mi |
| 4407 Bouts Pkwy Sacramento, CA | 3.0 | 1.0 | 1024 | $1,950 | $1.90 | 43d | 1 | 1.01mi |
| 6315 Ventura St Sacramento, CA | 2.0 | 1.0 | 1000 | $2,000 | $2.00 | 43d | 1 | 1.01mi |
| 7408 Franklin Blvd #2 Sacramento, CA | 2.0 | 1.0 | 840 | $1,300 | $1.55 | 21d | 1 | 1.03mi |
| 6310 Ventura St Sacramento, CA | 2.0 | 1.0 | 1000 | $2,000 | $2.00 | 43d | 1 | 1.04mi |
| 4400 Shining Star Dr Sacramento, CA | 1.0–4.0 | 1.0–2.0 | 1225 | $2,768 | $2.26 | 43d | 1 | 1.13mi |
| 7238 East Pkwy Apt B5 Sacramento, CA | 2.0 | 1.5 | 1020 | $1,645 | $1.61 | 7d | 1 | 1.14mi |
| 7236 East Pkwy Sacramento, CA | 2.0 | 1.0–1.5 | 776 | $1,645 | $2.12 | 2d | 1 | 1.15mi |
| 2777 Meadowview Rd Unit 2781 Sacramento, CA | 2.0 | 2.0 | 800 | $1,295 | $1.62 | 21d | 1 | 1.15mi |
| 2081 Wakefield Way Sacramento, CA | 3.0 | 2.0 | 1409 | $2,500 | $1.77 | 19d | 1 | 1.17mi |
| 4066 Weymouth Ln Sacramento, CA | 3.0 | 1.5 | 1323 | $1,900 | $1.44 | 43d | 1 | 1.21mi |
| 4913 Sky Pkwy Sacramento, CA | 3.0 | 2.0 | 1456 | $2,200 | $1.51 | 43d | 1 | 1.21mi |
| 26 Nedra Ct Sacramento, CA | 2.0 | 1.0 | 980 | $1,650 | $1.68 | 43d | 1 | 1.22mi |
| 26 Nedra Ct Unit A1 Sacramento, CA | 2.0 | 1.0 | 980 | $1,650 | $1.68 | 20d | 1 | 1.22mi |
| 4074 Weymouth Ln Sacramento, CA | 2.0 | 2.0 | 1200 | $2,498 | $2.08 | 17d | 1 | 1.22mi |
| 4623 Goya Pkwy Sacramento, CA | 3.0 | 2.0 | 1242 | $2,400 | $1.93 | 43d | 1 | 1.29mi |
| 6500 47th St Sacramento, CA | 1.0–2.0 | 1.0–2.0 | 715 | $1,650 | $2.31 | 43d | 7 | 1.29mi |
| 7638 24th St Sacramento, CA | 2.0 | 1.0 | 976 | $1,900 | $1.95 | 43d | 1 | 1.36mi |
| 6017 40th St Sacramento, CA | 2.0 | 2.0 | 1487 | $1,700 | $1.14 | 7d | 1 | 1.40mi |
| 7462 21st St Sacramento, CA | 2.0 | 1.0 | 900 | $1,775 | $1.97 | 1d | 1 | 1.43mi |
| 7726 Laurie Way Sacramento, CA | 3.0 | 1.0 | 1069 | $2,075 | $1.94 | 7d | 1 | 1.48mi |
| 4911 50th Ave Unit 11 Sacramento, CA | 2.0 | 2.0 | 875 | $1,660 | $1.90 | 23d | 1 | 1.48mi |
| 6611 50th St Sacramento, CA | 2.0 | 1.0 | 873 | $1,950 | $2.23 | 7d | 1 | 1.49mi |
| 2620 Fernandez Dr Sacramento, CA | 3.0 | 2.0 | 1405 | $2,495 | $1.78 | 23d | 1 | 1.50mi |
Listing history 9 events
-
2026-06-10status $145,000 Pending 21 DOM
-
2026-06-09days on market $145,000 Active 21 DOM
-
2026-06-08days on market $145,000 Active 20 DOM
-
2026-06-07days on market $145,000 Active 19 DOM
-
2026-06-05days on market $145,000 Active 16 DOM
-
2026-06-03days on market $145,000 Active 15 DOM
-
2026-06-02days on market $145,000 Active 14 DOM
-
2026-06-01days on market $145,000 Active 13 DOM
-
2026-05-31days on market $145,000 Active 12 DOM
ⓘ Source: listings_history table (triggers on properties + properties_extension) + one-shot
backfill from property_details.listing_events for pre-trigger history.
Tax reassessment forecast CA · Resets to sale price
- Current annual tax
- $700 · $58/mo
- Projected year-2 tax
- $1,102 · $92/mo
- Expected delta
- +$402/yr (+$34/mo · 57.4%)
ⓘ Screening estimate from a state-policy table — verify with the county assessor before closing.
Climate risk First Street
- Flood 1/10 Low FEMA zone X · 0% chance over 30 yrs
- Wildfire 1/10 Low
- Heat 7/10 Severe 6 d/yr ≥102°F today · 13 d/yr by 30 yrs out
- Wind 1/10 Low
- Air quality 10/10 Extreme 25 unhealthy d/yr today · 26 by 30 yrs out
Nearby sold comps map
Loading sold comps map…
Walkable amenities ~0.75 mi
Loading nearby amenities…
Taxation est. · year 1
- Rental income
- $26,314
- − Mortgage interest
- −$8,122
- − Property taxes
- −$700
- − Insurance
- −$725
- − Repairs & maintenance
- −$2,105
- − Management
- −$2,105
- − Depreciation
- −$4,218
- Taxable income
- $8,338
- Est. tax owed @ 24.0%
- −$2,001
- After-tax cash flow
- $8,237/yr
For passive investors: Depreciation is non-cash, so a rental often shows a tax loss while cash-flowing — sheltering income. Rental losses are passive: they offset passive income freely, and up to $25,000/yr can offset ordinary (W-2) income if you actively participate and your MAGI is under $100k (phasing out to $0 by $150k); unused losses carry forward. On sale, claimed depreciation is recaptured at up to 25%, and gains may owe capital-gains tax (a 1031 exchange can defer both). Figures are a year-1 estimate at your 24.0% rate — not tax advice; consult a CPA.
Schools (NCES district)
- District
- Sacramento City Unified
- NCES district ID
- 0633840
- Math proficiency
- 32% ▬ 0.00%
- Reading proficiency
- 43% ▲ 3.00%
- Median HH income
- $49,280
- Composite
- 34.86/100
- National rank
- #10000
- State rank
- #804 of 1400 in CA
Livability — Sacramento
- Score
- 71/100
- State rank
- #218
- US rank
- #6957
Category grades
Schools grade is shown separately in the Schools card above.
Census & demographics
- Census place
- Sacramento, CA
- County
- Sacramento County · 1,539,646 people
- City population
- 761,410
- Metro
- Sacramento-Roseville-Folsom, CA
- Population (ZIP)
- 83,607
- Household income
- $66,895
- Rent vs Own
- Severe rent burden
- 4034.0
Population outlook (Sacramento County) Hauer SSP2
- Today (2025)
- 1,660,763 people
- By 2030
- 1,732,990 · +4.3%
- By 2040
- 1,855,755 · +11.7%
- By 2050
- 1,941,335 · +16.9%
- By 2075
- 2,046,162 · +23.2%
- By 2100
- 1,961,444 · +18.1%
Race, ethnicity, and origin ACS 2023
- Neighborhood character
- Highly diverse neighborhood (Simpson 0.77)
- Race & ethnicity
- Hispanic / Latino 35% Asian 25% Black 17% Two or more races 16% White 11% Pacific Islander 4% Native American 1%
- Hispanic origin (detail)
- Mexican 29% Puerto Rican 1%
- Common ancestry
- Lithuanian 1% Italian 1% Scotch-Irish 1%
- Foreign-born
- 30% · Canada, Vietnam, China
- Languages at home
- 47% English-only · Spanish 25% Other Asian/Pacific 9% Other Indo-European 8%
Political lean MEDSL · Sacramento
- 2024 margin
- D (+19.7) · D 58.1% · R 38.4% · Other 3.5%
- 2008→2024 swing
- +0.7pp no change · 2008: 19.0pp · 2024: 19.7pp
- All cycles
- 2024: D+19.7 2020: D+25.3 2016: D+23.7 2012: D+16.3 2008: D+19.0
Not yet ingested
- Civics
- —
Market trends
- HPI YoY
- ▼ -331.02%
- Current HPI
- 377.4278
- Rent YoY
- ▬ 0.02%
- Metro
- Sacramento-Roseville-Folsom, CA
- State GDP YoY
- ▲ 3.21%
- F500 in state
- 116
Industry mix (Fortune 500 HQ in CA)
| Industry | F500 HQs | Revenue |
|---|---|---|
| Technology | 27 | $1,492B |
|
||
| Financial Services | 3 | $174B |
|
||
| Retail | 3 | $44B |
|
||
| Insurance | 3 | $26B |
|
||
| Media / Entertainment | 2 | $115B |
|
||
| Pharmaceuticals / Biotech | 2 | $62B |
|
||
Property tax history
+0.4%/yrLatest (2025): $700 · -5.3% YoY. Source: county tax records.
Cash-flow waterfall
monthlySold comps — $/sqft
last 12 mo · ≤1 miLoading sold comps…