 🏗️ New Construction
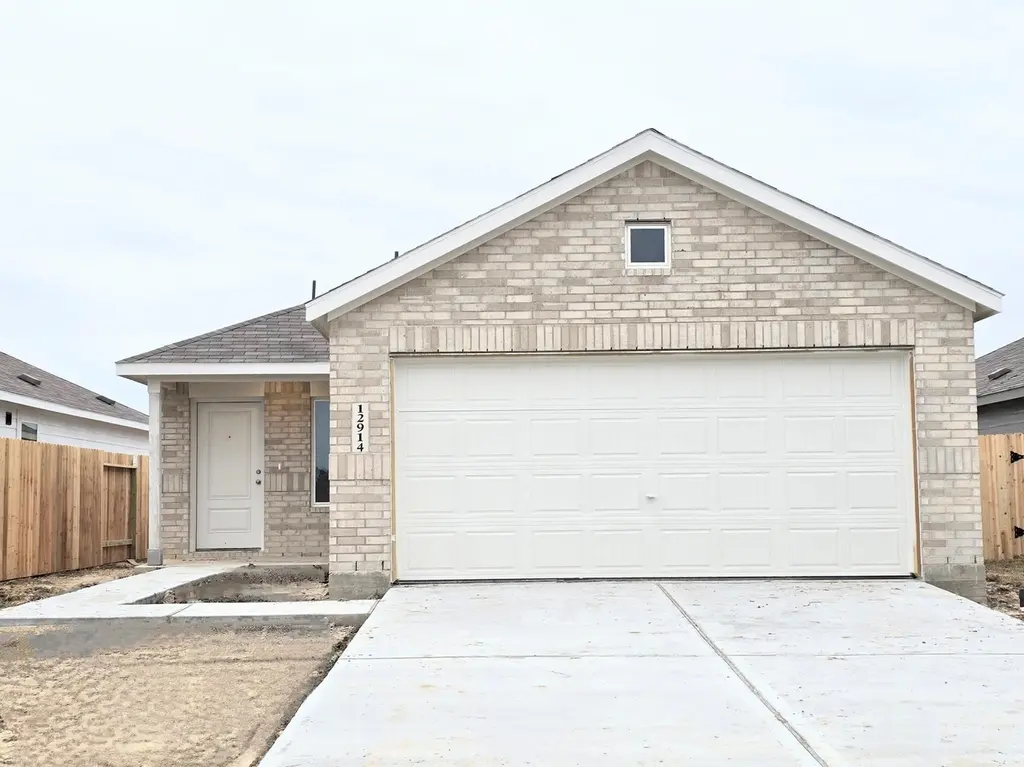
9211 Burch Eagle Ct · Baytown, TX
Flood risk 1/10 · Minimal
- FEMA flood zone
- X (unshaded)
- Chance of flooding over 30 yrs
- 0.0%
- Est. flood insurance / yr
- $507 – $1,088
Fire risk 3/10 · Minor
- Est. fire insurance / yr
- $1,222 – $2,270
Heat risk 9/10 · Severe
- Hot days now (above 110°F)
- 7 days/yr
- Hot days in 30 yrs
- 26 days/yr
Wind risk 9/10 · Severe
- Chance of severe wind over 30 yrs
- 99.0%
Air-quality risk 2/10 · Minimal
- Unhealthy air days now
- 1 days/yr
- Unhealthy air days in 30 yrs
- 2 days/yr
Risk factors via First Street. Map © Google.
Why this score? — see what drove the F grade
The composite is a weighted blend of 9 inputs, each scored 0–100. Each bar is that input's sub-score; the figure is the points it added to the 100-point composite (weight × sub-score).
- ARV discount +7.5/15.0
- Cash flow +6.2/30.0
- Condition / age +4.8/5.0
- Livability +3.5/5.0
- Schools +3.2/10.0
- Rent growth +2.9/5.0
- 1% rule +2.2/10.0
- DSCR +0.5/10.0
- Appreciation +0.0/10.0
$205,990
🖨 Deal sheet 📄 Offer letter ✓ Due diligence
Listing remarks
New Construction Lennar Houston Home - The Idlewood Floor Plan - This single-level home showcases a spacious open floorplan shared between the kitchen, dining area and family room for easy entertaining, along with access to an outdoor space. An owner’s suite enjoys a private location in a rear corner of the home, complemented by an en-suite bathroom and walk-in closet. There are two secondary bedrooms at the front of the home, ideal for household members and overnight guests. The completion date, prices and features may vary and are subject to change. Please verify with Lennar directly. Photos are for illustrative purposes only.
Key facts
- Walk-in closet
- Open floorplan
- Outdoor space
Tags
Property features AI
Finance
- HOA & community: Association: ACMI; Annual association fee of $2,000
Exterior
- Parking: Attached garage with 2 spaces
- Utilities: Public water; Public sewer
- Home design: Residential property; Under construction (new construction); Single-story (entry level: first floor); Faces unspecified direction
- Construction: Built in 2026; Brick construction; Composition roof; Slab foundation
- Exterior features: Fence with backyard fencing; Located in a subdivision
Interior
- Kitchen: Dishwasher; Electric oven; Electric range; Gas oven; Gas range
- Bedrooms: Primary bedroom on the first floor (approx. 14 x 14); Bedroom on the first floor (approx. 10 x 12); Bedroom on the first floor (approx. 10 x 12)
- Flooring: Carpet
- Bathrooms: 2 full bathrooms
- Heating & cooling: Central heating (electric and gas); Central air conditioning (electric and gas)
- Interior features: Breakfast bar; Kitchen and family room combo; Kitchen and dining combo; Separate shower; Tub with shower
- Laundry & utility: Washer hookup; Electric dryer hookup; Gas dryer hookup
Neighborhood map
What this means for you Summary
Snapshot
- This is a 3-bed/2.0-bath single-family listed at $206k. Condition is rated excellent.
Deal economics
- At list price, monthly cash flow is $-510 ($-6k/yr) — negative.
- To cash-flow at today's rent, offer at most $204k (1.0% below list).
- To meet the 1% rule (rent ≥ 1% of price), the offer needs to be $199k (3.2% below list).
- Recommended offer: $199k (3.2% below list) — sets the bar for 1% rule.
Location & tenants
- Location reads 69/100 on livability (#412 in TX) — a middle-class / working-renter tenant base. Strengths: cost of living A+, housing A+; Watch: employment D+, crime F, amenities F.
- Goose Creek CISD (urban): math 37% / reading 36% proficiency, ranked #473 of 826 in TX (top 57%) — families likely to look elsewhere, expect single-tenant / working-renter base with shorter leases; 61% free/reduced lunch — lower-income household profile, screen leases tightly.
- Zoned schools: Victoria Walker El (math 40% / reading 42%, grade F, #1,462 of 4,322 statewide, top 34%, 829 students, 66% FRL); E F Green Junior School (1,020 students, 67% FRL); Goose Creek Memorial (math 28% / reading 45%, grade F, #924 of 1,632 statewide, top 57%, 2,223 students, 70% FRL).
- Market conditions: Rents rising (+1.5%/yr); 612 active listings in the ZIP; 6 comparable units currently listed for rent nearby; rentals at typical pace (median 18d on market — plan ~3-4 weeks tenant-placement turnaround); 29,883 units permitted in Harris County in 2024 (8,621 in 5+ unit buildings).
- This rent runs 33% of the median local income ($74k/yr) — at the standard rent-burdened threshold; future hikes will face affordability resistance.
Forward outlook
- Local home prices are declining (-3.0%/yr); year-one equity from $2k of loan paydown is wiped out by about $8k of value loss. Plan a longer hold.
- Harris County population projected at +47% by 2050 — long-run rental-demand tailwind backs the buy-and-hold thesis.
Negotiation context
- It's been on market 20 days — a 2% lower offer ($203k) is reasonable based on typical stale-listing flexibility.
- 2 sale attempts; this cycle's ask has dropped $30k (13%) from the opening price — seller is motivated, your offer sets the floor, not the list.
Risks & watch-outs
- Climate carrying-cost: severe wind risk, 99% chance of damaging wind over 30y; extreme-heat days projected 7→26/yr by 2055 (HVAC capex compounding) — expect insurance premiums to compound above CPI over the hold.
Questions for the listing agent
- What do current leases actually rent for vs. the listed asking? Can we see a recent rent roll and the last 12 months of T-12 income?
- What does the HOA fee cover, when was the last increase, and are there any pending special assessments or reserve-fund shortfalls?
- Is there a deadline driving the sale (1031 exchange, divorce, estate, relocation)? That informs how much negotiation room exists.
- Schools are D-rated, which usually means shorter tenancies and higher turnover. Who's the typical renter profile here, and what's been the actual vacancy rate?
- Crime grade is F in this area — have there been break-ins, vandalism, or insurance claims at this property in the last 3 years? What carrier currently insures it and at what premium?
- The area grade is low — what's the realistic commute time and amenity access for the typical tenant pool here? Any planned neighborhood developments (good or bad) we should know about?
- What's the average days-on-market for RENTAL listings here right now (not sales)? A rising rental-DOM trend means longer vacancies and softer asking-rent achievability than the comps imply.
- What's the recent tenant-quality profile in this submarket — average credit score on applications, eviction rate, late-payment / NSF rate, and stable-employment percentage? A property-management company in the area should have these aggregated.
- How much new for-sale + rental construction is in the pipeline within 1–3 miles? Heavy new supply typically softens prices + rents 12–24 months out; constrained supply supports both.
Investment metrics
- 1% rule
- 0.72% ✗
- Cap rate
- 4.09%
- Cash-on-cash
- -7.88%
- DSCR
- 0.65
- GRM
- 11.6
CMA / ARV
- ARV (median comp)
- $277,730
- List price
- $205,990
- Delta
- -13.59%
- Verdict
- UNDERPRICED
- Comps
- 2 within 2.0 mi
Show comp detail 12 sales within ~0.75 mi
| Address | Dist | Beds/Ba | Sqft | Sold | Price | $/sf | Match |
|---|---|---|---|---|---|---|---|
| 9227 Lowan Terrace Dr | 0.02mi | 3/2.0 | 1,311 (-10%) | 1mo | $244,990 | $187 | 81 |
| 9239 Lowan Terrace Dr | 0.47mi | 3/2.0 | 1,461 (0%) | 0mo | $259,990 | $178 | 78 |
| 9223 Lowan Terrace Dr | 0.47mi | 3/2.0 | 1,461 (0%) | 1mo | $259,990 | $178 | 77 |
| 9235 Lowan Terrace Dr | 0.47mi | 3/2.0 | 1,451 (-1%) | 1mo | $255,990 | $176 | 76 |
| 9307 Golden Dorado Dr | 0.15mi | 3/2.0 | 1,602 (+10%) | 3mo | $278,990 | $174 | 75 |
| 9214 Speckled Trout Dr | 0.16mi | 3/2.0 | 1,302 (-11%) | 1mo | $271,990 | $209 | 73 |
| 9203 Speckled Trout Dr | 0.18mi | 3/2.0 | 1,302 (-11%) | 3mo | $273,990 | $210 | 71 |
| 9311 Long Fin Dr | 0.26mi | 3/2.0 | 1,602 (+10%) | 2mo | $280,990 | $175 | 70 |
| 5402 Peacock Bass Dr | 0.25mi | 3/2.0 | 1,602 (+10%) | 3mo | $284,990 | $178 | 70 |
| 5702 Goosander Land Dr | 0.43mi | 3/2.5 | 1,635 (+12%) | 2mo | $303,990 | $186 | 57 |
| 9218 Burch Eagle Ct | 0.42mi | 4/2.0 (+1) | 1,656 (+13%) | 0mo | $268,990 | $162 | 53 |
| 9219 Lowan Terrace Dr | 0.42mi | 4/2.0 (+1) | 1,656 (+13%) | 1mo | $268,990 | $162 | 52 |
Match score weights: distance 35% · size 25% · config 20% · recency 20%. Top-matched comps best support the ARV.
Projected returns pro-forma
-3.0% appreciation · 1.48% rent growth · sell at horizon
- IRR
- -31.9%
- Equity multiple
- -0.03×
- Total profit
- $-80,388
- Equity at exit
- $41,410
- IRR
- -46.8%
- Equity multiple
- -0.59×
- Total profit
- $-123,286
- Equity at exit
- $24,013
Cash invested: $77,764 (down + closing). Projections, not guarantees.
Landlord ↔ Tenant lean methodology
- Overall (STATE)
- 87 Strongly Landlord-Friendly
- State Texas
- 87 Strongly Landlord-Friendly · R+5
- County
- — inherits STATE
- City
- — inherits STATE
ZIP-level market 77521
- Rents YoY
- 1.5%
- Active inventory
- 612
- Price-to-rent
- 8.6×
Monthly cashflow live
- Estimated rent
- $1,995 high interval (Pro) →
- Mortgage (P&I)
- −$1,456
- Tax est. 1.5%
- −$347 /mo · $4,166/yr
- Insurance
- −$116
- HOA
- −$167
- Vacancy / Maint / Mgmt
- −$419
- Net cashflow
- $-510
Break-even live
UW: 25.0% down · 7.5% · 30yr · 1.5% tax · 5.0% vac · 8.0% maint · 8.0% mgmt
Financing live
Cash to close
- Down payment
- $69,433
- Closing costs
- $8,332
- Reserves months
- —
- Total cash needed
- —
Loan-product check · same deal, 3 products live
Conventional
25% down · 7.5% · 30yr
- Down + closing
- —
- Monthly P&I
- —
- Monthly cashflow
- —
- DSCR
- —
- Eligible?
- —
Personal DTI + credit; lowest rate.
DSCR
20% down · 8.5% · 30yr
- Down + closing
- —
- Monthly P&I
- —
- Monthly cashflow
- —
- DSCR
- —
- Eligible?
- —
No personal income docs; deal must DSCR.
Hard money
10% down · 12.0% · 12mo
- Down + closing
- —
- Monthly P&I
- —
- Monthly cashflow
- —
- DSCR
- —
- Eligible?
- —
Short-term bridge; refi at stabilization.
Rent comps 6 comps
| Address | Beds | Baths | Sqft | Rent | $/sqft | DOM | Units | Dist |
|---|---|---|---|---|---|---|---|---|
| 6019 Standpiper Loop Baytown, TX | 4.0 | 2.0 | 1656 | $2,265 | $1.37 | 2d | 1 | 0.70mi |
| 8814 Bar Harbor Dr Baytown, TX | 4.0 | 2.0 | 1683 | $1,896 | $1.13 | 24d | 1 | 0.86mi |
| 4730 Black Rock St Baytown, TX | 3.0 | 2.0 | 1540 | $2,073 | $1.35 | 16d | 1 | 0.86mi |
| 9214 Burnet Fields Dr Baytown, TX | 3.0 | 2.0 | 1461 | $1,801 | $1.23 | 43d | 1 | 0.87mi |
| 8110 Berkely Ct Baytown, TX | 4.0 | 2.0 | 1828 | $1,946 | $1.06 | 5d | 1 | 0.90mi |
| 8002 Sesame St Baytown, TX | 3.0 | 2.0 | 1819 | $2,100 | $1.15 | 17d | 1 | 1.08mi |
HOA detail
- Monthly dues
- $167 · $2,004/yr
Listing history 23 events
-
2026-06-18status $205,990 Pending 20 DOM
-
2026-06-18remarks 636-char remark
-
2026-06-18days on market $205,990 Active 20 DOM
-
2026-06-17days on market $205,990 Active 19 DOM
-
2026-06-16days on market $205,990 Active 18 DOM
-
2026-06-15price $205,990 Active 17 DOM
-
2026-06-15days on market $218,390 Active 17 DOM
-
2026-06-13pricedays on market $218,390 Active 15 DOM
-
2026-06-09pricedays on market $229,990 Active 11 DOM
-
2026-06-07days on market $236,190 Active 9 DOM
-
2026-06-04days on market $236,190 Active 6 DOM
-
2026-06-03days on market $236,190 Active 5 DOM
-
2026-06-02days on market $236,190 Active 4 DOM
-
2026-06-01days on market $236,190 Active 3 DOM
-
2026-05-31days on market $236,190 Active 2 DOM
-
2026-04-24price $239,990 415-char remark
-
2026-04-23price $239,990 521-char remark
-
2026-04-22price $250,840 415-char remark
-
2026-04-20price $250,840 521-char remark
-
2026-04-14price $243,690 415-char remark
-
2026-04-14price $243,690 521-char remark
-
2026-04-09$259,990 Active 521-char remark
-
2026-04-08$259,990 Active 415-char remark
ⓘ Source: listings_history table (triggers on properties + properties_extension) + one-shot
backfill from property_details.listing_events for pre-trigger history.
Climate risk First Street
- Flood 1/10 Low FEMA zone X (unshaded) · 0% chance over 30 yrs
- Wildfire 3/10 Moderate
- Heat 9/10 Extreme 7 d/yr ≥110°F today · 26 d/yr by 30 yrs out
- Wind 9/10 Extreme 99% chance of damaging wind over 30 yrs
- Air quality 2/10 Low 1 unhealthy d/yr today · 2 by 30 yrs out
Nearby sold comps map
Loading sold comps map…
Walkable amenities ~0.75 mi
Loading nearby amenities…
Taxation est. · year 1
- Rental income
- $23,937
- − Mortgage interest
- −$15,557
- − Property taxes
- −$4,166
- − Insurance
- −$1,389
- − Repairs & maintenance
- −$1,915
- − Management
- −$1,915
- − HOA
- −$2,004
- − Depreciation
- −$8,079
- Taxable loss
- −$11,088
- Est. tax savings @ 24.0%
- +$2,661
- After-tax cash flow
- $-3,464/yr
For passive investors: Depreciation is non-cash, so a rental often shows a tax loss while cash-flowing — sheltering income. Rental losses are passive: they offset passive income freely, and up to $25,000/yr can offset ordinary (W-2) income if you actively participate and your MAGI is under $100k (phasing out to $0 by $150k); unused losses carry forward. On sale, claimed depreciation is recaptured at up to 25%, and gains may owe capital-gains tax (a 1031 exchange can defer both). Figures are a year-1 estimate at your 24.0% rate — not tax advice; consult a CPA.
Condition & rehab AI · 12 photos
This single-level home is in excellent condition with a spacious open floorplan and modern amenities. It is move-in ready and would benefit from some exterior painting and landscaping to further enhance its curb appeal.
Value-add opportunities
- Resale Painting exterior — Enhances curb appeal
- Both Landscaping — Improves curb appeal and enhances property value
- Both Add smart home features — Enhances convenience and marketability
Renovation cost estimate screening
Value-add ROI direction
- Resale Painting exterior — Enhances curb appeal ↑
- Both Landscaping — Improves curb appeal and enhances property value ↑
- Both Add smart home features — Enhances convenience and marketability ↑
ⓘ Cost ranges are severity-bucket heuristics (US national rule-of-thumb). Get contractor quotes + a written scope before underwriting a rehab budget.
Schools (NCES district)
- District
- Goose Creek CISD
- NCES district ID
- 4821150
- Math proficiency
- 37% ▼ -11.00%
- Reading proficiency
- 36% ▼ -4.00%
- Median HH income
- $52,468
- Composite
- 31.84/100
- National rank
- #5877
- State rank
- #473 of 826 in TX
Livability — Baytown
- Score
- 69/100
- State rank
- #412
- US rank
- #8494
Category grades
Schools grade is shown separately in the Schools card above.
Census & demographics
- County
- Harris County · 4,702,590 people
- City population
- 135,579
- Metro
- Houston-The Woodlands-Sugar Land, TX
- Population (ZIP)
- 69,038
- Household income
- $73,629
- Rent vs Own
- Severe rent burden
- 2121.0
Population outlook (Harris County) Hauer SSP2
- Today (2025)
- 5,571,493 people
- By 2030
- 6,089,821 · +9.3%
- By 2040
- 7,142,806 · +28.2%
- By 2050
- 8,185,864 · +46.9%
- By 2075
- 10,574,329 · +89.8%
- By 2100
- 12,109,958 · +117.4%
Race, ethnicity, and origin ACS 2023
- Neighborhood character
- Diverse neighborhood (Simpson 0.64)
- Race & ethnicity
- Hispanic / Latino 50% White 28% Two or more races 18% Black 17% Asian 3%
- Hispanic origin (detail)
- Mexican 42% Puerto Rican 2%
- Common ancestry
- Lithuanian 2% Slovak 1%
- Foreign-born
- 20% · Canada, Vietnam
- Languages at home
- 59% English-only · Spanish 36% French/Haitian/Cajun 1% Other Asian/Pacific 1%
Political lean MEDSL · Harris
- 2024 margin
- Lean D (+5.5) · D 52.0% · R 46.4% · Other 1.6%
- 2008→2024 swing
- +3.9pp toward D · 2008: 1.6pp · 2024: 5.5pp
- All cycles
- 2024: D+5.5 2020: D+13.3 2016: D+12.4 2012: D+0.1 2008: D+1.6
Not yet ingested
- Civics
- —
Market trends
- HPI YoY
- ▼ -154.80%
- Current HPI
- 246.1892
- Rent YoY
- ▲ 1.48%
- Metro
- Houston-The Woodlands-Sugar Land, TX
- State GDP YoY
- ▲ 3.95%
- F500 in state
- 110
Industry mix (Fortune 500 HQ in TX)
| Industry | F500 HQs | Revenue |
|---|---|---|
| Energy | 16 | $1,198B |
|
||
| Technology | 5 | $198B |
|
||
| Engineering / Construction | 4 | $72B |
|
||
| Energy Services | 3 | $60B |
|
||
| Utilities | 3 | $41B |
|
||
| Healthcare | 2 | $330B |
|
||
Price history
-20.8% since first listed10 events — show timeline
- 2026-06-18 Pending — HARMLS
- 2026-06-15 Price Changed $205,990 HARMLS
- 2026-06-12 Price Changed $218,390 HARMLS
- 2026-06-08 Price Changed $229,990 HARMLS
- 2026-05-29 Listed $236,190 HARMLS
- 2026-05-21 Listing Removed — HARMLS
- 2026-04-23 Price Changed $239,990 HARMLS
- 2026-04-20 Price Changed $250,840 HARMLS
- 2026-04-14 Price Changed $243,690 HARMLS
- 2026-04-09 Listed $259,990 HARMLS
Cash-flow waterfall
monthlySold comps — $/sqft
last 12 mo · ≤1 miLoading sold comps…