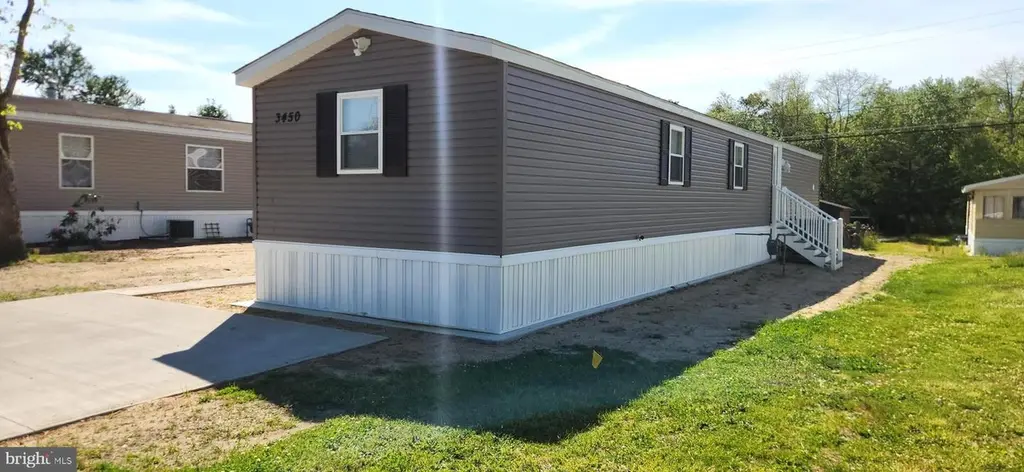
3450 New Moon St · Pemberton, NJ
Flood risk No data
- FEMA flood zone
- —
- Chance of flooding over 30 yrs
- —
- Est. flood insurance / yr
- —
Fire risk No data
- Est. fire insurance / yr
- —
Heat risk No data
- Hot days now (above threshold)
- —
- Hot days in 30 yrs
- —
Wind risk No data
- Chance of severe wind over 30 yrs
- —
Air-quality risk No data
- Unhealthy air days now
- —
- Unhealthy air days in 30 yrs
- —
Risk factors via First Street. Map © Google.
Why this score? — see what drove the C+ grade
The composite is a weighted blend of 9 inputs, each scored 0–100. Each bar is that input's sub-score; the figure is the points it added to the 100-point composite (weight × sub-score).
- Cash flow +20.9/30.0
- ARV discount +15.0/15.0
- 1% rule +10.0/10.0
- DSCR +6.6/10.0
- Condition / age +4.0/5.0
- Livability +3.6/5.0
- Rent growth +2.5/5.0
- Schools +2.3/10.0
- Appreciation +0.0/10.0
$139,900
🖨 Deal sheet (PDF) 📄 Offer letter ✓ Due diligence
Listing remarks
Tastefully Remodeled! Beautiful 3 Bedroom 2 Bath Mobile Home Has Been Completely Renovated Throughout!! You Won't Believe Your Eyes When You Step Inside This One Because The Contractor Cut Absolutely No Corners! He Even Kicked It Up A Notch With High End Items Like A Tankless Water Heater, All New Stainless Appliances & Quartz Countertops! Take A Walk Through This GemTo Really Appreciate What It Has To Offer. Schedule Your Appointment Now Before It's Gone. Minutes From McGuire, Ft Dix & Lakehurst.
Key facts
- 2 parking spots
- Built 1993
- Listed 16 days
Property features AI
Finance
- Other: Income/expense list includes annual ground rent
- Financial info: HOA/association fee $735 monthly; Lease not considered
- HOA & community: Land lease with monthly fee; Land lease payment $735 per month; Ground rent payment listed annually; Land lease years remaining: 100
Exterior
- Parking: Driveway parking (2 spaces); Total of 2 garage and parking spaces
- Utilities: Public water; Public sewer; Electric available; Natural gas available; Cable TV available; Tankless hot water
- Home design: Manufactured single-wide home; Excellent condition; Estimated year built
- Construction: Vinyl siding; Shingle roof; Building not winterized
- Exterior features: Not in a federal flood zone; Ground rent exists (annual payment); Above-grade other structures
Interior
- Kitchen: Built-in microwave; Dishwasher; Self-cleaning oven; Gas range; Refrigerator; Stainless steel appliances; Energy-efficient appliances
- Bedrooms: 3 bedrooms on the main level
- Flooring: Laminate plank
- Bathrooms: 2 full bathrooms on the main level
- Heating & cooling: Forced air heating (natural gas); Central air conditioning (natural gas)
- Interior features: Tub and stall showers; Electric fireplace (1)
- Laundry & utility: Washer; Dryer; Tankless water heater
Neighborhood map
What this means for you Summary
Snapshot
- This is a 3-bed/2.0-bath single-family listed at $140k. Condition is rated good.
Deal economics
- At list price, monthly cash flow is $194 ($2k/yr) — positive.
- The deal already cash-flows at list — no discount required.
- Meets the 1% rule at list price ($2k rent vs $140k).
- Recommended offer: $138k (1.5% below list) — sets the bar for market timing.
- Cap rate 8.0% vs local median 4.8% in Pemberton — top-decile yield for the area; either an underpriced asset or a hidden risk that comps aren't pricing in. Stress-test before assuming the spread holds.
Location & tenants
- Location reads 72/100 on livability (#217 in NJ) — a middle-class / working-renter tenant base. Strengths: crime A+, housing A+, health & safety A+; Watch: cost of living C-, amenities F, commute F.
- Pemberton Township School District (rural): math 12% / reading 38% proficiency, ranked #382 of 472 in NJ (top 81%) — low school quality limits family demand, transient renter base, plan for 1-2y turnover.
- Zoned schools: Pemberton Township High School (math 13% / reading 45%, grade F, #298 of 399 statewide, top 75%, 1,057 students, 56% FRL) — zoned schools average 56% FRL vs 37% district-wide (19 pts higher); higher-poverty schools than district average — tighter screening recommended.
- Market conditions: 117 active listings in the ZIP; 1 comparable units currently listed for rent nearby; 2,161 units permitted in Burlington County in 2024 (988 in 5+ unit buildings).
Forward outlook
- Local home prices are declining (-3.0%/yr); year-one equity from $967 of loan paydown is wiped out by about $4k of value loss. Plan a longer hold.
- Burlington County population projected to shrink 5% by 2050 — rents likely to lag national; underwrite the cash flow, not the appreciation.
Negotiation context
- It's been on market 17 days — a 2% lower offer ($138k) is reasonable based on typical stale-listing flexibility.
- 3 sale attempts with the ask held roughly flat each time — persistent listings suggest the price (not the market) is what's stuck; bring a comps-based counter.
Risks & watch-outs
- Watch-outs: HOA is 31% of rent.
Questions for the listing agent
- What does the HOA fee cover, when was the last increase, and are there any pending special assessments or reserve-fund shortfalls?
- Is there a deadline driving the sale (1031 exchange, divorce, estate, relocation)? That informs how much negotiation room exists.
- Schools are D-rated, which usually means shorter tenancies and higher turnover. Who's the typical renter profile here, and what's been the actual vacancy rate?
- What's the average days-on-market for RENTAL listings here right now (not sales)? A rising rental-DOM trend means longer vacancies and softer asking-rent achievability than the comps imply.
- What's the recent tenant-quality profile in this submarket — average credit score on applications, eviction rate, late-payment / NSF rate, and stable-employment percentage? A property-management company in the area should have these aggregated.
- How much new for-sale + rental construction is in the pipeline within 1–3 miles? Heavy new supply typically softens prices + rents 12–24 months out; constrained supply supports both.
Investment metrics
- 1% rule
- 1.72% ✓
- Cap rate
- 7.96%
- Cash-on-cash
- 5.95%
- DSCR
- 1.26
- GRM
- 4.9
CMA / ARV
- ARV (median comp)
- $171,514
- List price
- $139,900
- Delta
- -18.43%
- Verdict
- UNDERPRICED
- Comps
- 20 within 1.0 mi
Show comp detail 12 sales within ~0.75 mi
| Address | Dist | Beds/Ba | Sqft | Sold | Price | $/sf | Match |
|---|---|---|---|---|---|---|---|
| 3594 Nashua St | 0.43mi | 3/2.0 | 1,000 (0%) | 2mo | $70,000 | $70 | 78 |
| 3394 Liberty St | 0.07mi | 3/2.0 | 900 (-10%) | 5mo | $111,500 | $124 | 76 |
| 610 Berkeley Dr | 0.26mi | 3/1.0 | 972 (-3%) | 11mo | $313,000 | $322 | 70 |
| 3361 Liberty St | 0.12mi | 3/2.0 | 924 (-8%) | 15mo | $124,000 | $134 | 69 |
| 3569 Schultz St | 0.53mi | 3/2.0 | 999 (-0%) | 8mo | $60,000 | $60 | 68 |
| 3561 Weymouth Rd | 0.52mi | 2/1.5 (-1) | 1,000 (0%) | 7mo | $94,000 | $94 | 63 |
| 214 Scammell Dr | 0.26mi | 3/1.0 | 883 (-12%) | 4mo | $290,000 | $328 | 61 |
| 15 Coville Dr | 0.12mi | 3/1.0 | 863 (-14%) | 10mo | $275,000 | $319 | 59 |
| 612 Weymouth Rd | 0.17mi | 3/1.0 | 863 (-14%) | 10mo | $275,000 | $319 | 57 |
| 511 Laurel Blvd | 0.51mi | 3/1.5 | 921 (-8%) | 6mo | $275,000 | $299 | 56 |
| 204 Scammell Dr | 0.28mi | 2/1.0 (-1) | 863 (-14%) | 5mo | $255,000 | $295 | 51 |
| 26 Railroad St | 0.61mi | 3/1.0 | 1,080 (+8%) | 8mo | $363,000 | $336 | 47 |
Match score weights: distance 35% · size 25% · config 20% · recency 20%. Top-matched comps best support the ARV.
Projected returns pro-forma
-3.0% appreciation · 3.0% rent growth · sell at horizon
- IRR
- -6.7%
- Equity multiple
- 0.75×
- Total profit
- $-9,814
- Equity at exit
- $20,860
- IRR
- 3.3%
- Equity multiple
- 1.24×
- Total profit
- $9,361
- Equity at exit
- $12,096
Cash invested: $39,172 (down + closing). Projections, not guarantees.
Landlord ↔ Tenant lean methodology
- Overall (STATE)
- 21 Tenant-Leaning
- State New Jersey
- 21 Tenant-Leaning · D+6
- County
- — inherits STATE
- City
- — inherits STATE
ZIP-level market 08015
- Home prices YoY
- -23.1%
- Active inventory
- 117
- Price-to-rent
- 4.9×
Monthly cashflow live
- Estimated rent
- $2,400 medium interval (Pro) →
- Mortgage (P&I)
- −$734
- Tax est. 1.5%
- −$175 /mo · $2,098/yr
- Insurance
- −$58
- HOA
- −$735
- Vacancy / Maint / Mgmt
- −$504
- Net cashflow
- $194
Break-even live
Sensitivity live
| Price | -10% $291 | -5% $243 | +0% $194 | +5% $146 | +10% $98 |
|---|---|---|---|---|---|
| Rent | -10% $5 | -5% $99 | +0% $194 | +5% $289 | +10% $384 |
| Rate | -1.0pp $265 | -0.5pp $230 | base $194 | +0.5pp $158 | +1.0pp $121 |
UW: 25.0% down · 7.5% · 30yr · 1.5% tax · 5.0% vac · 8.0% maint · 8.0% mgmt
Financing live
Cash to close
- Down payment
- $34,975
- Closing costs
- $4,197
- Reserves months
- —
- Total cash needed
- —
Loan-product check · same deal, 3 products live
Conventional
25% down · 7.5% · 30yr
- Down + closing
- —
- Monthly P&I
- —
- Monthly cashflow
- —
- DSCR
- —
- Eligible?
- —
Personal DTI + credit; lowest rate.
DSCR
20% down · 8.5% · 30yr
- Down + closing
- —
- Monthly P&I
- —
- Monthly cashflow
- —
- DSCR
- —
- Eligible?
- —
No personal income docs; deal must DSCR.
Hard money
10% down · 12.0% · 12mo
- Down + closing
- —
- Monthly P&I
- —
- Monthly cashflow
- —
- DSCR
- —
- Eligible?
- —
Short-term bridge; refi at stabilization.
Rent comps 1 comps
| Address | Beds | Baths | Sqft | Rent | $/sqft | DOM | Units | Dist |
|---|---|---|---|---|---|---|---|---|
| 4 Coville Dr Browns Mills, NJ | 4.0 | 1.0 | 863 | $2,400 | $2.78 | 16d | 1 | 0.18mi |
HOA detail
- Monthly dues
- $735 · $8,820/yr
- Likely covers
- water
Listing history 14 events
-
2026-06-17days on market $139,900 Active 17 DOM
-
2026-06-16days on market $139,900 Active 16 DOM
-
2026-06-15days on market $139,900 Active 15 DOM
-
2026-06-13days on market $139,900 Active 13 DOM
-
2026-06-13days on market $139,900 Active 12 DOM
-
2026-06-09days on market $139,900 Active 9 DOM
-
2026-06-08days on market $139,900 Active 8 DOM
-
2026-06-07days on market $139,900 Active 7 DOM
-
2026-06-04days on market $139,900 Active 4 DOM
-
2026-06-03days on market $139,900 Active 3 DOM
-
2026-06-02days on market $139,900 Active 2 DOM
-
2026-05-31days on market $139,900 Active 1 DOM
-
2026-04-19$139,900 Active 514-char remark
-
2026-04-19historical 514-char remark
ⓘ Source: listings_history table (triggers on properties + properties_extension) + one-shot
backfill from property_details.listing_events for pre-trigger history.
Nearby sold comps map
Loading sold comps map…
Walkable amenities ~0.75 mi
Loading nearby amenities…
Taxation est. · year 1
- Rental income
- $28,800
- − Mortgage interest
- −$7,837
- − Property taxes
- −$2,098
- − Insurance
- −$700
- − Repairs & maintenance
- −$2,304
- − Management
- −$2,304
- − HOA
- −$8,820
- − Depreciation
- −$4,070
- Taxable income
- $668
- Est. tax owed @ 24.0%
- −$160
- After-tax cash flow
- $2,170/yr
For passive investors: Depreciation is non-cash, so a rental often shows a tax loss while cash-flowing — sheltering income. Rental losses are passive: they offset passive income freely, and up to $25,000/yr can offset ordinary (W-2) income if you actively participate and your MAGI is under $100k (phasing out to $0 by $150k); unused losses carry forward. On sale, claimed depreciation is recaptured at up to 25%, and gains may owe capital-gains tax (a 1031 exchange can defer both). Figures are a year-1 estimate at your 24.0% rate — not tax advice; consult a CPA.
Condition & rehab AI · 12 photos
This beautifully remodeled mobile home is move-in ready with new kitchen, bathrooms, exterior, flooring, and paint. It's located in a desirable location with easy access to McGuire, Ft Dix, and Lakehurst.
Value-add opportunities
- Both Landscaping and curb appeal improvements — Enhances curb appeal and can attract more buyers
- Both Add a small garden or flower bed near the front door — Improves curb appeal and can attract more buyers
- Both Install a security camera system — Enhances safety and can attract more buyers
Renovation cost estimate screening
Value-add ROI direction
- Both Landscaping and curb appeal improvements — Enhances curb appeal and can attract more buyers ↑
- Both Add a small garden or flower bed near the front door — Improves curb appeal and can attract more buyers ↑
- Both Install a security camera system — Enhances safety and can attract more buyers ↑
ⓘ Cost ranges are severity-bucket heuristics (US national rule-of-thumb). Get contractor quotes + a written scope before underwriting a rehab budget.
Schools (NCES district)
- District
- Pemberton Township School District
- NCES district ID
- 3412810
- Math proficiency
- 12% ▼ -14.00%
- Reading proficiency
- 38% ▼ -5.00%
- Median HH income
- $60,951
- Composite
- 23.0/100
- National rank
- #7979
- State rank
- #382 of 472 in NJ
Livability — Pemberton
- Score
- 72/100
- State rank
- #217
- US rank
- #6053
Category grades
Schools grade is shown separately in the Schools card above.
Census & demographics
- Population (ZIP)
- 19,143
Population outlook (Burlington County) Hauer SSP2
- Today (2025)
- 453,425 people
- By 2030
- 452,359 · -0.2%
- By 2040
- 445,033 · -1.9%
- By 2050
- 431,760 · -4.8%
- By 2075
- 406,277 · -10.4%
- By 2100
- 364,732 · -19.6%
Race, ethnicity, and origin ACS 2023
- Neighborhood character
- Diverse neighborhood (Simpson 0.56)
- Race & ethnicity
- White 63% Hispanic / Latino 14% Black 13% Two or more races 10% Asian 3%
- Hispanic origin (detail)
- Mexican 2% Puerto Rican 10%
- Common ancestry
- Romanian 3% Slovak 2% Serbian 2%
- Foreign-born
- 6% · Canada, Jamaica, South Korea
- Languages at home
- 87% English-only · Spanish 7% French/Haitian/Cajun 3% Tagalog/Filipino 1%
Political lean MEDSL · Burlington
- 2024 margin
- D (+16.6) · D 57.6% · R 41.0% · Other 1.3%
- 2008→2024 swing
- -2.0pp toward R · 2008: 18.6pp · 2024: 16.6pp
- All cycles
- 2024: D+16.6 2020: D+19.5 2016: D+14.8 2012: D+18.7 2008: D+18.6
Not yet ingested
- Civics
- —
Market trends
- HPI YoY
- ▼ -98.84%
- Current HPI
- 329.1731
- Rent YoY
- —
- Metro
- —
- State GDP YoY
- ▲ 2.05%
- F500 in state
- 34
Industry mix (Fortune 500 HQ in NJ)
| Industry | F500 HQs | Revenue |
|---|---|---|
| Consumer Goods | 3 | $31B |
|
||
| Pharmaceuticals | 2 | $153B |
|
||
| Technology | 2 | $21B |
|
||
| Insurance | 2 | $20B |
|
||
| Healthcare | 2 | $19B |
|
||
| Financial Services | 1 | $70B |
|
||
Price history
+0.0% since first listed6 events — show timeline
- 2026-06-17 Listing Removed — BRIGHT MLS
- 2026-05-31 Listed $139,900 BRIGHT MLS
- 2026-05-30 Listed $139,900 MOMLS
- 2026-05-28 Listing Removed — BRIGHT MLS
- 2026-04-19 Listing Removed — BRIGHT MLS
- 2026-04-19 Listed $139,900 BRIGHT MLS
Cash-flow waterfall
monthlySold comps — $/sqft
last 12 mo · ≤1 miLoading sold comps…