 Multi-family
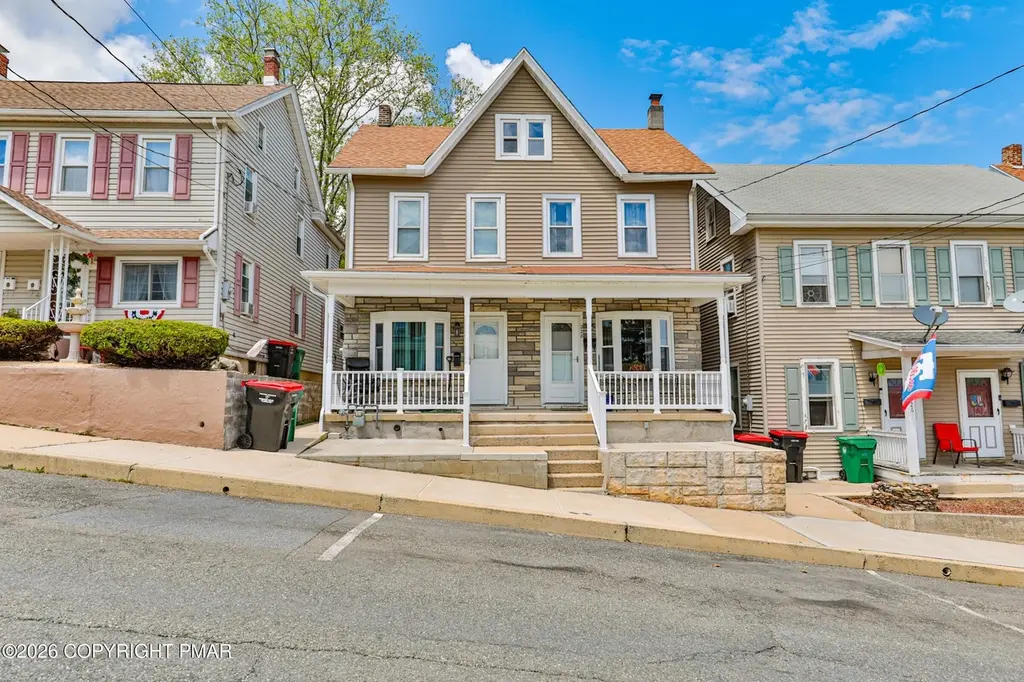
230 Carbon St · Lehighton, PA
Flood risk 1/10 · Minimal
- FEMA flood zone
- X (unshaded)
- Chance of flooding over 30 yrs
- 0.0%
- Est. flood insurance / yr
- $507 – $1,088
Fire risk 1/10 · Minimal
- Est. fire insurance / yr
- $511 – $949
Heat risk 4/10 · Minor
- Hot days now (above 98°F)
- 7 days/yr
- Hot days in 30 yrs
- 16 days/yr
Wind risk 4/10 · Minor
- Chance of severe wind over 30 yrs
- 10.0%
Air-quality risk 2/10 · Minimal
- Unhealthy air days now
- 1 days/yr
- Unhealthy air days in 30 yrs
- 2 days/yr
Risk factors via First Street. Map © Google.
Why this score? — see what drove the B- grade
The composite is a weighted blend of 9 inputs, each scored 0–100. Each bar is that input's sub-score; the figure is the points it added to the 100-point composite (weight × sub-score).
- Cash flow +30.0/30.0
- DSCR +10.0/10.0
- 1% rule +8.8/10.0
- ARV discount +7.5/15.0
- Livability +3.9/5.0
- Schools +3.5/10.0
- Rent growth +2.5/5.0
- Condition / age +2.5/5.0
- Appreciation +0.0/10.0
$259,400
🖨 Deal sheet 📄 Offer letter ✓ Due diligence
Multi-family units
County records classify this as Multi-Family (2-4 Unit). Listing-text estimate: 1 unit. estimate disagrees with records
Listing remarks MLS
Welcome home to this spacious 4-bedroom, 2 full bath twin, offering move-in ready convenience and plenty of updates. Featuring economical gas heat, a finished attic for additional living space, and a spacious eat-in kitchen, this home is designed for comfort and practicality. Both bathrooms have been nicely updated, adding a modern touch. One of the best features is the covered rear patio complete with a hot tub—perfect for relaxing after a long day or entertaining guests. Outside, you'll also find a nice-sized shed and a paved driveway at the rear of the home, providing ample storage and parking. Additional highlights include vinyl replacement windows throughout and an updated roof and vinyl siding, ensuring peace of mind for years to come. All of this is located just a short distance from Historic Jim Thorpe, the D & L Trails, and Mauch Chunk Lake, offering endless opportunities for outdoor adventure, shopping, and dining. Don't miss your chance to own this charming, well-maintained twin in a prime location!
Key facts
- Finished attic
- Updated vinyl siding
- Newer roof
Tags
Property features AI
Finance
- Other: Zoned residential
Exterior
- Parking: Open parking with 3 spaces
- Utilities: Public water; Public sewer; 200+ amp electric service; Natural gas available
- Home design: Residential single-family residence; House / Duplex; Facing direction: not specified
- Construction: Vinyl siding; Shingle roof; Built year: not specified
- Exterior features: Patio; Covered porch; Shed(s); Paved, public maintained city street
Interior
- Kitchen: Electric oven; Refrigerator
- Bedrooms: Total rooms: 9
- Flooring: Carpet; Laminate; Vinyl
- Bathrooms: 2 full bathrooms
- Heating & cooling: Baseboard heating; Hot water heating; Electric heating; Natural gas available; Ceiling fan(s); Window unit(s)
- Interior features: Unfurnished; Patio and covered porch
- Laundry & utility: Washer and dryer; Laundry on the main level
Neighborhood map
What this means for you Summary
Snapshot
- This is a 3-bed/1.0-bath multifamily listed at $259k.
Deal economics
- At list price, monthly cash flow is $1k ($14k/yr) — positive.
- The deal already cash-flows at list — no discount required.
- Meets the 1% rule at list price ($4k rent vs $259k).
- Recommended offer: $256k (1.5% below list) — sets the bar for market timing.
- Cap rate 11.7% vs local median 4.7% in Lehighton — top-decile yield for the area; either an underpriced asset or a hidden risk that comps aren't pricing in. Stress-test before assuming the spread holds.
Location & tenants
- Location reads 77/100 on livability (#321 in PA, #2,848 nationally) — a middle-class / working-renter tenant base. Strengths: cost of living A+, health & safety A+, crime A-; Watch: employment D, commute F.
- Lehighton Area SD (suburban): math 32% / reading 50% proficiency, ranked #336 of 539 in PA (top 62%) — families likely to look elsewhere, expect single-tenant / working-renter base with shorter leases.
- Market conditions: 139 active listings in the ZIP; 6 comparable units currently listed for rent nearby; rentals leasing fast (median 3d on market — plan ~1-2 weeks tenant-placement turnaround); 180 units permitted in Carbon County in 2024 (10 in 5+ unit buildings).
Forward outlook
- Local home prices are declining (-3.0%/yr); year-one equity from $2k of loan paydown is wiped out by about $8k of value loss. Plan a longer hold.
- Carbon County population projected at -18% by 2050 — secular population decline; favor cash flow + early exit over multi-decade hold.
- At projected returns (-3.0% appreciation + 3.0% rent growth), your $73k cash investment doubles in ~7 years — after that, you're playing with house money.
Negotiation context
- It's been on market 17 days — a 2% lower offer ($256k) is reasonable based on typical stale-listing flexibility.
- 6 sale attempts since 23y ago with the ask held roughly flat each time — persistent listings suggest the price (not the market) is what's stuck; bring a comps-based counter.
- Current owner paid $225k; 15% above their basis — modest negotiation headroom, anchor on the comps not their cost.
Risks & watch-outs
- Watch-outs: built in 1886 — expect roof / HVAC / electrical / plumbing capex.
Questions for the listing agent
- Built in 1886 — when were the roof, HVAC, electrical panel, plumbing, and water heater last replaced?
- Is there a deadline driving the sale (1031 exchange, divorce, estate, relocation)? That informs how much negotiation room exists.
- What's the average days-on-market for RENTAL listings here right now (not sales)? A rising rental-DOM trend means longer vacancies and softer asking-rent achievability than the comps imply.
- What's the recent tenant-quality profile in this submarket — average credit score on applications, eviction rate, late-payment / NSF rate, and stable-employment percentage? A property-management company in the area should have these aggregated.
- How much new apartment / multifamily construction is in the pipeline within 1–3 miles? Heavy new supply (>2% of stock underway) typically softens rents 12–24 months out; light construction supports rent growth.
Investment metrics
- 1% rule
- 1.38% ✓
- Cap rate
- 11.71%
- Cash-on-cash
- 19.36%
- DSCR
- 1.86
- GRM
- 6.0
CMA / ARV
No comps found within radius.
Projected returns pro-forma
-3.0% appreciation · 3.0% rent growth · sell at horizon
- IRR
- 11.3%
- Equity multiple
- 1.45×
- Total profit
- $32,576
- Equity at exit
- $38,677
- IRR
- 20.3%
- Equity multiple
- 2.71×
- Total profit
- $124,370
- Equity at exit
- $22,428
Cash invested: $72,632 (down + closing). Projections, not guarantees.
Landlord ↔ Tenant lean methodology
- Overall (STATE)
- 62 Landlord-Friendly
- State Pennsylvania
- 62 Landlord-Friendly · EVEN
- County
- — inherits STATE
- City
- — inherits STATE
ZIP-level market 18235
- Home prices YoY
- -27.1%
- Active inventory
- 139
- Price-to-rent
- 18.1×
Monthly cashflow live
- Estimated rent
- $3,590 medium interval (Pro) →
- Mortgage (P&I)
- −$1,360
- Tax from tax record
- −$196 /mo · $2,350/yr
- Insurance
- −$108
- HOA
- −$0
- Vacancy / Maint / Mgmt
- −$754
- Net cashflow
- $1,172
Break-even live
3-unit breakdown (identical units grouped — click to expand)
| Units | Beds | Baths | Est. rent |
|---|---|---|---|
| 3× units | 2 | 1 | $3,591 |
| #1 | 2 | 1 | $1,197 |
| #2 | 2 | 1 | $1,197 |
| #3 | 2 | 1 | $1,197 |
| Total (3 units) | $3,590 | ||
UW: 25.0% down · 7.5% · 30yr · 1.5% tax · 5.0% vac · 8.0% maint · 8.0% mgmt
Financing live
Cash to close
- Down payment
- $64,850
- Closing costs
- $7,782
- Reserves months
- —
- Total cash needed
- —
Loan-product check · same deal, 3 products live
Conventional
25% down · 7.5% · 30yr
- Down + closing
- —
- Monthly P&I
- —
- Monthly cashflow
- —
- DSCR
- —
- Eligible?
- —
Personal DTI + credit; lowest rate.
DSCR
20% down · 8.5% · 30yr
- Down + closing
- —
- Monthly P&I
- —
- Monthly cashflow
- —
- DSCR
- —
- Eligible?
- —
No personal income docs; deal must DSCR.
Hard money
10% down · 12.0% · 12mo
- Down + closing
- —
- Monthly P&I
- —
- Monthly cashflow
- —
- DSCR
- —
- Eligible?
- —
Short-term bridge; refi at stabilization.
Rent comps 6 comps
| Address | Beds | Baths | Sqft | Rent | $/sqft | DOM | Units | Dist |
|---|---|---|---|---|---|---|---|---|
| 123 Jamestown St Lehighton, PA | 2.0 | 1.0 | 780 | $1,395 | $1.79 | 2d | 1 | 0.05mi |
| 339 N 2nd St Lehighton, PA | 3.0 | 1.0 | 1073 | $1,700 | $1.58 | 2d | 1 | 0.22mi |
| 204 N 2nd St Lehighton, PA | 3.0 | 1.0 | 1000 | $1,600 | $1.60 | 2d | 1 | 0.39mi |
| 206 N 2nd St Lehighton, PA | 3.0 | 1.0 | 1000 | $1,450 | $1.45 | 2d | 1 | 0.39mi |
| 404 Mahoning St Apt 2 Lehighton, PA | 3.0 | 1.0 | 800 | $1,500 | $1.88 | 2d | 1 | 0.49mi |
| 318 Bridge St Unit A Weissport, PA | 2.0 | 1.0 | 900 | $975 | $1.08 | 2d | 1 | 0.90mi |
Listing history 13 events
-
2026-06-18days on market $259,400 Active 17 DOM
-
2026-06-17days on market $259,400 Active 16 DOM
-
2026-06-16days on market $259,400 Active 15 DOM
-
2026-06-15days on market $259,400 Active 14 DOM
-
2026-06-14days on market $259,400 Active 12 DOM
-
2026-06-10days on market $259,400 Active 9 DOM
-
2026-06-09days on market $259,400 Active 8 DOM
-
2026-06-08days on market $259,400 Active 7 DOM
-
2026-06-07days on market $259,400 Active 6 DOM
-
2026-06-03days on market $259,400 Active 2 DOM
-
2026-06-02$259,400 Active 1 DOM
-
2026-06-01remarks 699-char remark
-
2026-06-01$259,400 Active 1 DOM
ⓘ Source: listings_history table (triggers on properties + properties_extension) + one-shot
backfill from property_details.listing_events for pre-trigger history.
Tax reassessment forecast PA · Partial reset (capped growth)
- Current annual tax
- $2,350 · $196/mo
- Projected year-2 tax
- $3,224 · $269/mo
- Expected delta
- +$874/yr (+$73/mo · 37.2%)
ⓘ Screening estimate from a state-policy table — verify with the county assessor before closing.
Climate risk First Street
- Flood 1/10 Low FEMA zone X (unshaded) · 0% chance over 30 yrs
- Wildfire 1/10 Low
- Heat 4/10 Moderate 7 d/yr ≥98°F today · 16 d/yr by 30 yrs out
- Wind 4/10 Moderate 10% chance of damaging wind over 30 yrs
- Air quality 2/10 Low 1 unhealthy d/yr today · 2 by 30 yrs out
Nearby sold comps map
Loading sold comps map…
Walkable amenities ~0.75 mi
Loading nearby amenities…
Taxation est. · year 1
- Rental income
- $43,080
- − Mortgage interest
- −$14,530
- − Property taxes
- −$2,350
- − Insurance
- −$1,297
- − Repairs & maintenance
- −$3,446
- − Management
- −$3,446
- − Depreciation
- −$7,546
- Taxable income
- $10,463
- Est. tax owed @ 24.0%
- −$2,511
- After-tax cash flow
- $11,551/yr
For passive investors: Depreciation is non-cash, so a rental often shows a tax loss while cash-flowing — sheltering income. Rental losses are passive: they offset passive income freely, and up to $25,000/yr can offset ordinary (W-2) income if you actively participate and your MAGI is under $100k (phasing out to $0 by $150k); unused losses carry forward. On sale, claimed depreciation is recaptured at up to 25%, and gains may owe capital-gains tax (a 1031 exchange can defer both). Figures are a year-1 estimate at your 24.0% rate — not tax advice; consult a CPA.
Schools (NCES district)
- District
- Lehighton Area SD
- NCES district ID
- 4213500
- Math proficiency
- 32% ▼ -7.00%
- Reading proficiency
- 50% ▼ -11.00%
- Median HH income
- $51,115
- Composite
- 35.36/100
- National rank
- #4958
- State rank
- #336 of 539 in PA
Livability — Lehighton
- Score
- 77/100
- State rank
- #321
- US rank
- #2848
Category grades
Schools grade is shown separately in the Schools card above.
Census & demographics
- Census place
- Lehighton, PA
- Population (ZIP)
- 19,121
Population outlook (Carbon County) Hauer SSP2
- Today (2025)
- 61,643 people
- By 2030
- 59,840 · -2.9%
- By 2040
- 55,413 · -10.1%
- By 2050
- 50,843 · -17.5%
- By 2075
- 43,326 · -29.7%
- By 2100
- 37,126 · -39.8%
Race, ethnicity, and origin ACS 2023
- Neighborhood character
- Predominantly White (94%)
- Race & ethnicity
- White 94% Two or more races 4% Hispanic / Latino 3%
- Common ancestry
- Romanian 6% Polish 5% Iranian 3%
- Foreign-born
- 2% · Canada, China
- Languages at home
- 96% English-only · Spanish 2% Russian/Polish/Slavic 1%
Political lean MEDSL · Carbon
- 2024 margin
- Solid R (+34.8) · D 32.2% · R 67.0%
- 2008→2024 swing
- -36.7pp toward R · 2008: 1.9pp · 2024: -34.8pp
- All cycles
- 2024: R+34.8 2020: R+32.0 2016: R+34.1 2012: R+6.9 2008: D+1.9
Not yet ingested
- Civics
- —
Market trends
- HPI YoY
- ▼ -69.77%
- Current HPI
- 187.4645
- Rent YoY
- —
- Metro
- —
- State GDP YoY
- ▲ 1.68%
- F500 in state
- 34
Industry mix (Fortune 500 HQ in PA)
| Industry | F500 HQs | Revenue |
|---|---|---|
| Healthcare | 2 | $309B |
|
||
| Insurance | 2 | $27B |
|
||
| Telecommunications / Media | 1 | $124B |
|
||
| Industrial Distribution | 1 | $22B |
|
||
| Financial Services | 1 | $20B |
|
||
| Chemicals / Materials | 1 | $18B |
|
||
Price history
+136.0% since first listed16 events — show timeline
- 2026-05-31 Listed $259,400 PMAR
- 2026-01-16 Sold (Public Records) $225,000 Public Records
- 2026-01-16 Sold (MLS) $225,000 BRIGHT MLS
- 2026-01-16 Sold (MLS) $225,000 GLVRMLS
- 2026-01-16 Sold (MLS) $225,000 PMAR
- 2025-11-28 Pending — BRIGHT MLS
- 2025-11-28 Pending — PMAR
- 2025-11-28 Pending — GLVRMLS
- 2025-10-11 Listed $234,000 BRIGHT MLS
- 2025-10-02 Listed $234,000 GLVRMLS
- 2025-10-02 Listed $234,000 PMAR
- 2008-10-02 Sold (Public Records) $85,000 Public Records
- 2003-08-04 Sold (MLS) $97,500 GLVRMLS
- 2003-08-04 Sold (MLS) $97,500 GLVRMLS
- 2003-06-25 Listed $109,900 GLVRMLS
- 2003-06-25 Listed $109,900 GLVRMLS
Property tax history
+2.0%/yrLatest (2026): $2,350 · +2.3% YoY. Source: county tax records.
Cash-flow waterfall
monthlySold comps — $/sqft
last 12 mo · ≤1 miLoading sold comps…