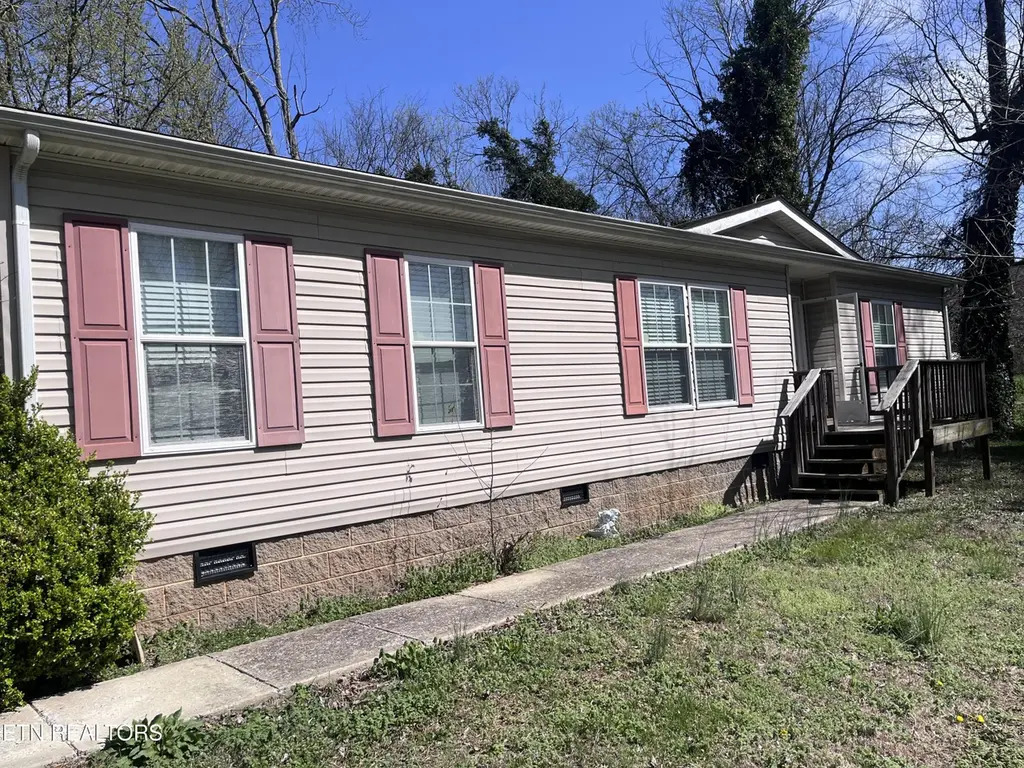
414 Palmer St · Kingston, TN
Flood risk 10/10 · Severe
- FEMA flood zone
- X (unshaded)
- Chance of flooding over 30 yrs
- 1.0%
- Est. flood insurance / yr
- $507 – $1,088
Fire risk 2/10 · Minimal
- Est. fire insurance / yr
- $949 – $1,763
Heat risk 6/10 · Moderate
- Hot days now (above 104°F)
- 7 days/yr
- Hot days in 30 yrs
- 22 days/yr
Wind risk 2/10 · Minimal
- Chance of severe wind over 30 yrs
- 2.0%
Air-quality risk 3/10 · Minor
- Unhealthy air days now
- 2 days/yr
- Unhealthy air days in 30 yrs
- 2 days/yr
Risk factors via First Street. Map © Google.
Why this score? — see what drove the B- grade
The composite is a weighted blend of 9 inputs, each scored 0–100. Each bar is that input's sub-score; the figure is the points it added to the 100-point composite (weight × sub-score).
- Cash flow +30.0/30.0
- 1% rule +10.0/10.0
- DSCR +10.0/10.0
- ARV discount +7.5/15.0
- Livability +3.2/5.0
- Rent growth +2.5/5.0
- Schools +2.5/10.0
- Condition / age +2.5/5.0
- Appreciation +0.0/10.0
$144,000
🖨 Deal sheet (PDF) 📄 Offer letter ✓ Due diligence
Listing remarks MLS
Neat, clean, spotless! Convenient to everything including interstate & hospital, ready to move into.
Key facts
- Near schools
- Near shopping
- Heart of kingston
Tags
Property features AI
Exterior
- Parking: Carport
- Utilities: Public sewer
- Home design: Detached property
- Construction: Vinyl siding; Other construction materials; Crawl space foundation; Built area approximately 1,728 (source: tax records)
- Exterior features: Level lot; Other view
Interior
- Kitchen: Refrigerator
- Flooring: Carpet; Vinyl
- Bathrooms: 2 full bathrooms
- Heating & cooling: Central heating (electric); Central cooling
- Interior features: Walk-in closets; Pantry; Eat-in kitchen; 9 total rooms
- Laundry & utility: Washer; Dryer
Neighborhood map
What this means for you Summary
Snapshot
- This is a 3-bed/2.0-bath manufactured listed at $144k.
Deal economics
- At list price, monthly cash flow is $906 ($11k/yr) — positive.
- The deal already cash-flows at list — no discount required.
- Meets the 1% rule at list price ($2k rent vs $144k).
- Recommended offer: $131k (9.0% below list) — sets the bar for market timing.
- Cap rate 14.4% vs local median 2.8% in Kingston — top-decile yield for the area; either an underpriced asset or a hidden risk that comps aren't pricing in. Stress-test before assuming the spread holds.
Location & tenants
- Location reads 63/100 on livability (#205 in TN) — a middle-class / working-renter tenant base. Strengths: crime A+, cost of living A+, housing A+; Watch: schools D, amenities F, commute F.
- Roane County (town): math 30% / reading 29% proficiency, ranked #64 of 139 in TN (top 46%) — low school quality limits family demand, transient renter base, plan for 1-2y turnover.
- Market conditions: 151 active listings in the ZIP; 3 comparable units currently listed for rent nearby; rentals at typical pace (median 24d on market — plan ~3-4 weeks tenant-placement turnaround); 229 units permitted in Roane County in 2024 (0 in 5+ unit buildings).
Forward outlook
- Local home prices are declining (-3.0%/yr); year-one equity from $996 of loan paydown is wiped out by about $4k of value loss. Plan a longer hold.
- Roane County population projected at -21% by 2050 — secular population decline; favor cash flow + early exit over multi-decade hold.
- At projected returns (-3.0% appreciation + 3.0% rent growth), your $40k cash investment doubles in ~5 years — after that, you're playing with house money.
Negotiation context
- It's been on market 93 days — a 9% lower offer ($131k) is reasonable based on typical stale-listing flexibility.
- 3 sale attempts since 19y ago; this cycle's ask has dropped $46k (24%) from the opening price — seller is motivated, your offer sets the floor, not the list.
- Current owner paid $68k; list at $144k implies a 112% gain — meaningful room to come down on a strong offer.
Risks & watch-outs
- Watch-outs: flood insurance adds $66/mo.
- Climate carrying-cost: severe flood risk; extreme-heat days projected 7→22/yr by 2055 (HVAC capex compounding) — expect insurance premiums to compound above CPI over the hold.
Questions for the listing agent
- It's been on market 93 days. Have you received any prior offers? Is the seller open to a 9% concession, seller financing, or rate buy-down credit?
- What's the actual annual flood-insurance premium (NFIP or private), and is the property in a SFHA with mandatory coverage?
- Why hasn't it sold? Are there any deal-killer items the seller is aware of (foundation, flood, title, zoning, code violations)?
- Is there a deadline driving the sale (1031 exchange, divorce, estate, relocation)? That informs how much negotiation room exists.
- Schools are D-rated, which usually means shorter tenancies and higher turnover. Who's the typical renter profile here, and what's been the actual vacancy rate?
- What's the average days-on-market for RENTAL listings here right now (not sales)? A rising rental-DOM trend means longer vacancies and softer asking-rent achievability than the comps imply.
- What's the recent tenant-quality profile in this submarket — average credit score on applications, eviction rate, late-payment / NSF rate, and stable-employment percentage? A property-management company in the area should have these aggregated.
- How much new for-sale + rental construction is in the pipeline within 1–3 miles? Heavy new supply typically softens prices + rents 12–24 months out; constrained supply supports both.
Investment metrics
- 1% rule
- 1.61% ✓
- Cap rate
- 14.40%
- Cash-on-cash
- 28.95%
- DSCR
- 2.29
- GRM
- 5.2
CMA / ARV
- ARV (on-the-fly)
- $314,496
- Comps found
- 2
Show comp detail 2 sales within ~0.75 mi
| Address | Dist | Beds/Ba | Sqft | Sold | Price | $/sf | Match |
|---|---|---|---|---|---|---|---|
| 506 Patton Ferry Rd | 0.24mi | 3/2.0 | 1,568 (-9%) | 6mo | $285,000 | $182 | 68 |
| 531 Greenwood St | 0.21mi | 4/2.0 (+1) | 1,493 (-14%) | 1mo | $236,000 | $158 | 61 |
Match score weights: distance 35% · size 25% · config 20% · recency 20%. Top-matched comps best support the ARV.
Projected returns pro-forma
-3.0% appreciation · 3.0% rent growth · sell at horizon
- IRR
- 20.9%
- Equity multiple
- 1.85×
- Total profit
- $34,368
- Equity at exit
- $21,471
- IRR
- 29.0%
- Equity multiple
- 3.58×
- Total profit
- $104,206
- Equity at exit
- $12,450
Cash invested: $40,320 (down + closing). Projections, not guarantees.
Landlord ↔ Tenant lean methodology
- Overall (STATE)
- 87 Strongly Landlord-Friendly
- State Tennessee
- 87 Strongly Landlord-Friendly · R+13
- County
- — inherits STATE
- City
- — inherits STATE
ZIP-level market 37763
- Home prices YoY
- -30.8%
- Active inventory
- 151
- Price-to-rent
- 5.2×
Monthly cashflow live
- Estimated rent
- $2,318 medium interval (Pro) →
- Mortgage (P&I)
- −$755
- Tax from tax record
- −$44 /mo · $523/yr
- Insurance
- −$60
- Flood insurance flood zone
- −$66 /mo · $798/yr
- HOA
- −$0
- Vacancy / Maint / Mgmt
- −$487
- Net cashflow
- $906
Break-even live
Sensitivity live
| Price | -10% $988 | -5% $947 | +0% $906 | +5% $865 | +10% $825 |
|---|---|---|---|---|---|
| Rent | -10% $723 | -5% $815 | +0% $906 | +5% $998 | +10% $1,089 |
| Rate | -1.0pp $979 | -0.5pp $943 | base $906 | +0.5pp $869 | +1.0pp $831 |
UW: 25.0% down · 7.5% · 30yr · 1.5% tax · 5.0% vac · 8.0% maint · 8.0% mgmt
Financing live
Cash to close
- Down payment
- $36,000
- Closing costs
- $4,320
- Reserves months
- —
- Total cash needed
- —
Loan-product check · same deal, 3 products live
Conventional
25% down · 7.5% · 30yr
- Down + closing
- —
- Monthly P&I
- —
- Monthly cashflow
- —
- DSCR
- —
- Eligible?
- —
Personal DTI + credit; lowest rate.
DSCR
20% down · 8.5% · 30yr
- Down + closing
- —
- Monthly P&I
- —
- Monthly cashflow
- —
- DSCR
- —
- Eligible?
- —
No personal income docs; deal must DSCR.
Hard money
10% down · 12.0% · 12mo
- Down + closing
- —
- Monthly P&I
- —
- Monthly cashflow
- —
- DSCR
- —
- Eligible?
- —
Short-term bridge; refi at stabilization.
Rent comps 3 comps
| Address | Beds | Baths | Sqft | Rent | $/sqft | DOM | Units | Dist |
|---|---|---|---|---|---|---|---|---|
| 203 W Cumberland St Kingston, TN | 2.0 | 1.0 | 1094 | $2,400 | $2.19 | 44d | 1 | 0.23mi |
| 203 W Cumberland St Kingston, TN | 2.0 | 1.0 | 1094 | $2,400 | $2.19 | 21d | 1 | 0.23mi |
| 212 Meadowview Dr Kingston, TN | 3.0 | 1.0 | 1525 | $1,720 | $1.13 | 24d | 1 | 1.16mi |
Listing history 23 events
-
2026-06-18days on market $144,000 Active 93 DOM
-
2026-06-17days on market $144,000 Active 92 DOM
-
2026-06-16days on market $144,000 Active 91 DOM
-
2026-06-15days on market $144,000 Active 90 DOM
-
2026-06-14days on market $144,000 Active 88 DOM
-
2026-06-13pricedays on market $144,000 Active 87 DOM
-
2026-06-10days on market $149,000 Active 85 DOM
-
2026-06-09days on market $149,000 Active 84 DOM
-
2026-06-08days on market $149,000 Active 83 DOM
-
2026-06-07days on market $149,000 Active 82 DOM
-
2026-06-03days on market $149,000 Active 78 DOM
-
2026-06-02days on market $149,000 Active 77 DOM
-
2026-06-01days on market $149,000 Active 76 DOM
-
2026-05-31days on market $149,000 Active 75 DOM
-
2026-05-31days on market $149,000 Active 74 DOM
-
2026-04-07historical Pending - Continue to Show
-
2026-04-01price $150,000
-
2026-03-24price $175,000
-
2026-03-17$190,000 Active
-
2015-01-27soldstatus $68,000
-
2015-01-20soldstatus $68,000 104-char remark
Show marketing remark (104 chars)
Neat, clean, spotless! Convenient to everything including interstate & hospital, ready to move into.
-
2014-12-26$68,000 104-char remark
Show marketing remark (104 chars)
Neat, clean, spotless! Convenient to everything including interstate & hospital, ready to move into.
-
2007-06-05$65,500
ⓘ Source: listings_history table (triggers on properties + properties_extension) + one-shot
backfill from property_details.listing_events for pre-trigger history.
Tax reassessment forecast TN · Resets to sale price
- Current annual tax
- $523 · $44/mo
- Projected year-2 tax
- $1,022 · $85/mo
- Expected delta
- +$499/yr (+$42/mo · 95.5%)
ⓘ Screening estimate from a state-policy table — verify with the county assessor before closing.
Climate risk First Street
- Flood 10/10 Extreme FEMA zone X (unshaded) · 100% chance over 30 yrs
- Wildfire 2/10 Low
- Heat 6/10 Major 7 d/yr ≥104°F today · 22 d/yr by 30 yrs out
- Wind 2/10 Low 2% chance of damaging wind over 30 yrs
- Air quality 3/10 Moderate 2 unhealthy d/yr today · 2 by 30 yrs out
Nearby sold comps map
Loading sold comps map…
Walkable amenities ~0.75 mi
Loading nearby amenities…
Taxation est. · year 1
- Rental income
- $27,817
- − Mortgage interest
- −$8,066
- − Property taxes
- −$523
- − Insurance
- −$1,518
- − Repairs & maintenance
- −$2,225
- − Management
- −$2,225
- − Depreciation
- −$4,189
- Taxable income
- $9,071
- Est. tax owed @ 24.0%
- −$2,177
- After-tax cash flow
- $8,696/yr
For passive investors: Depreciation is non-cash, so a rental often shows a tax loss while cash-flowing — sheltering income. Rental losses are passive: they offset passive income freely, and up to $25,000/yr can offset ordinary (W-2) income if you actively participate and your MAGI is under $100k (phasing out to $0 by $150k); unused losses carry forward. On sale, claimed depreciation is recaptured at up to 25%, and gains may owe capital-gains tax (a 1031 exchange can defer both). Figures are a year-1 estimate at your 24.0% rate — not tax advice; consult a CPA.
Schools (NCES district)
- District
- Roane County
- NCES district ID
- 4703590
- Math proficiency
- 30% ▼ -10.00%
- Reading proficiency
- 29% ▼ -7.00%
- Median HH income
- $41,611
- Composite
- 25.0/100
- National rank
- #7557
- State rank
- #64 of 139 in TN
Livability — Kingston
- Score
- 63/100
- State rank
- #205
- US rank
- #16055
Category grades
Schools grade is shown separately in the Schools card above.
Census & demographics
- Census place
- Kingston, TN
- Population (ZIP)
- 16,394
Population outlook (Roane County) Hauer SSP2
- Today (2025)
- 49,652 people
- By 2030
- 47,648 · -4.0%
- By 2040
- 43,306 · -12.8%
- By 2050
- 39,294 · -20.9%
- By 2075
- 32,318 · -34.9%
- By 2100
- 27,137 · -45.3%
Race, ethnicity, and origin ACS 2023
- Neighborhood character
- Predominantly White (93%)
- Race & ethnicity
- White 93% Two or more races 2% Hispanic / Latino 2% Black 2%
- Common ancestry
- Serbian 3% Slovak 2% Lithuanian 2%
- Foreign-born
- 2% · Canada, Vietnam
- Languages at home
- 97% English-only · Spanish 2% German/W. Germanic 1%
Political lean MEDSL · Roane
- 2024 margin
- Solid R (+54.5) · D 22.1% · R 76.7% · Other 1.2%
- 2008→2024 swing
- -18.3pp toward R · 2008: -36.2pp · 2024: -54.5pp
- All cycles
- 2024: R+54.5 2020: R+50.9 2016: R+51.1 2012: R+41.3 2008: R+36.2
Not yet ingested
- Civics
- —
Market trends
- HPI YoY
- ▼ -104.77%
- Current HPI
- 235.9959
- Rent YoY
- —
- Metro
- —
- State GDP YoY
- ▲ 2.78%
- F500 in state
- 22
Industry mix (Fortune 500 HQ in TN)
| Industry | F500 HQs | Revenue |
|---|---|---|
| Healthcare | 3 | $91B |
|
||
| Retail | 3 | $72B |
|
||
| Transportation / Logistics | 1 | $88B |
|
||
| Paper / Packaging | 1 | $19B |
|
||
| Insurance | 1 | $13B |
|
||
| Energy | 1 | $12B |
|
||
Price history
+129.0% since first listed8 events — show timeline
- 2026-04-07 Contingent — Knoxville MLS
- 2026-04-01 Price Changed $150,000 Knoxville MLS
- 2026-03-24 Price Changed $175,000 Knoxville MLS
- 2026-03-17 Listed $190,000 Knoxville MLS
- 2015-01-27 Sold (Public Records) $68,000 Public Records
- 2015-01-20 Sold (MLS) $68,000 Knoxville MLS
- 2014-12-26 Listed $68,000 Knoxville MLS
- 2007-06-05 Listed $65,500 Knoxville MLS
Property tax history
-0.2%/yrLatest (2025): $523 · -0.2% YoY. Source: county tax records.
Cash-flow waterfall
monthlySold comps — $/sqft
last 12 mo · ≤1 miLoading sold comps…