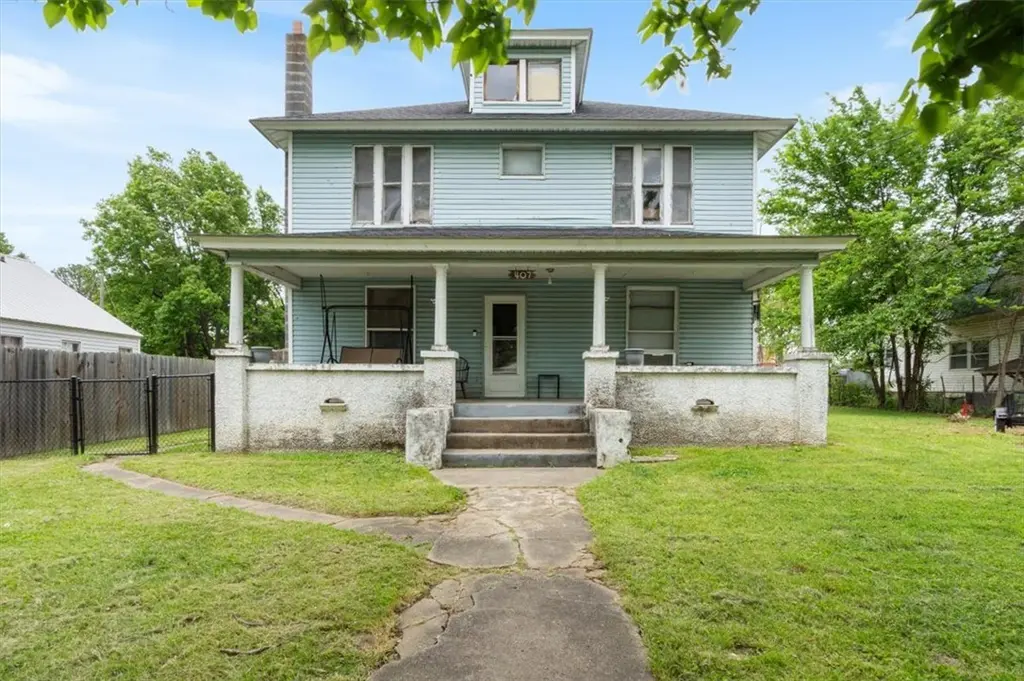
407 S Britt St · Siloam Springs, AR
Flood risk 1/10 · Minimal
- FEMA flood zone
- X (unshaded)
- Chance of flooding over 30 yrs
- 0.0%
- Est. flood insurance / yr
- $507 – $1,088
Fire risk 6/10 · Moderate
- Est. fire insurance / yr
- $1,499 – $2,785
Heat risk 5/10 · Moderate
- Hot days now (above 106°F)
- 7 days/yr
- Hot days in 30 yrs
- 21 days/yr
Wind risk 2/10 · Minimal
- Chance of severe wind over 30 yrs
- 2.0%
Air-quality risk 2/10 · Minimal
- Unhealthy air days now
- 1 days/yr
- Unhealthy air days in 30 yrs
- 2 days/yr
Risk factors via First Street. Map © Google.
Why this score? — see what drove the C grade
The composite is a weighted blend of 9 inputs, each scored 0–100. Each bar is that input's sub-score; the figure is the points it added to the 100-point composite (weight × sub-score).
- Cash flow +21.0/30.0
- ARV discount +14.9/15.0
- DSCR +6.7/10.0
- 1% rule +4.6/10.0
- Livability +3.7/5.0
- Schools +3.6/10.0
- Rent growth +2.5/5.0
- Condition / age +2.5/5.0
- Appreciation +0.0/10.0
$225,000
🖨 Deal sheet 📄 Offer letter ✓ Due diligence
Listing remarks MLS
Rare 2 1/2 story Historical home located in the heart of Siloam Springs. Close to downtown and shopping. Built in 1910, this home contains 3 bedrooms with a bonus room, 2 living areas, as well as a formal dining room. Natural hardwood floors, tall ceilings and detached shop/carport.
Key facts
- Formal dining room
- 0.24 acre lot
- Parking
Tags
Property features AI
Finance
- HOA & community: Monthly association fee
Exterior
- Parking: Detached garage; 1 covered parking space
- Utilities: Electricity available; Natural gas available; Public water; Public sewer
- Home design: Two-story home; Vinyl siding; Block foundation; Asphalt shingle roof
- Construction: Vinyl siding construction; Built 25+ years ago; Block foundation; Asphalt shingle roof
- Exterior features: Covered porch; Porch; Gravel driveway; Outbuilding; Partial backyard fencing; Back yard fencing; Public paved road frontage; Cleared, city lot in central business district
Interior
- Kitchen: Dishwasher; Gas cooktop
- Bedrooms: Bedrooms on multiple levels (2-story home)
- Flooring: Wood
- Bathrooms: 2 full bathrooms
- Heating & cooling: Gas heating; Space heater; Window cooling units
- Interior features: Ceiling fans; Wood flooring; Fireplace in the living room
- Laundry & utility: Washer hookup; Dryer hookup; Gas water heater
Neighborhood map
What this means for you Summary
Snapshot
- This is a 3-bed/1.0-bath single-family listed at $225k.
Deal economics
- At list price, monthly cash flow is $317 ($4k/yr) — positive.
- The deal already cash-flows at list — no discount required.
- To meet the 1% rule (rent ≥ 1% of price), the offer needs to be $217k (3.6% below list).
- Recommended offer: $217k (3.6% below list) — sets the bar for 1% rule.
- Cap rate 8.0% vs local median 3.9% in Siloam Springs — top-decile yield for the area; either an underpriced asset or a hidden risk that comps aren't pricing in. Stress-test before assuming the spread holds.
Location & tenants
- Location reads 74/100 on livability (#17 in AR, #4,621 nationally) — a middle-class / working-renter tenant base. Strengths: cost of living A+, housing A+, health & safety A+; Watch: schools D, crime D, amenities F.
- Siloam Springs School District (town): math 44% / reading 40% proficiency, ranked #53 of 238 in AR (top 22%) — families likely to look elsewhere, expect single-tenant / working-renter base with shorter leases.
- Market conditions: 362 active listings in the ZIP; 18 comparable units currently listed for rent nearby; rentals at typical pace (median 14d on market — plan ~3-4 weeks tenant-placement turnaround); solid renter incomes; 4,359 units permitted in Benton County in 2024 (402 in 5+ unit buildings).
- This rent runs 34% of the median local income ($76k/yr) — at the standard rent-burdened threshold; future hikes will face affordability resistance.
Forward outlook
- Local home prices are declining (-3.0%/yr); year-one equity from $2k of loan paydown is wiped out by about $7k of value loss. Plan a longer hold.
- Benton County population projected at +56% by 2050 — long-run rental-demand tailwind backs the buy-and-hold thesis.
Negotiation context
- It's been on market 55 days — a 3% lower offer ($218k) is reasonable based on typical stale-listing flexibility.
- 3 sale attempts since 8y ago; this cycle's ask has dropped $15k (6%) from the opening price — seller is motivated, your offer sets the floor, not the list.
- Current owner paid $178k; 27% above their basis — modest negotiation headroom, anchor on the comps not their cost.
Risks & watch-outs
- Watch-outs: built in 1910 — expect roof / HVAC / electrical / plumbing capex.
- Climate carrying-cost: major wildfire risk; extreme-heat days projected 7→21/yr by 2055 (HVAC capex compounding) — expect insurance premiums to compound above CPI over the hold.
Questions for the listing agent
- It's been on market 55 days. Have you received any prior offers? Is the seller open to a 4% concession, seller financing, or rate buy-down credit?
- Built in 1910 — when were the roof, HVAC, electrical panel, plumbing, and water heater last replaced?
- Is there a deadline driving the sale (1031 exchange, divorce, estate, relocation)? That informs how much negotiation room exists.
- Schools are D-rated, which usually means shorter tenancies and higher turnover. Who's the typical renter profile here, and what's been the actual vacancy rate?
- Crime grade is D in this area — have there been break-ins, vandalism, or insurance claims at this property in the last 3 years? What carrier currently insures it and at what premium?
- What's the average days-on-market for RENTAL listings here right now (not sales)? A rising rental-DOM trend means longer vacancies and softer asking-rent achievability than the comps imply.
- What's the recent tenant-quality profile in this submarket — average credit score on applications, eviction rate, late-payment / NSF rate, and stable-employment percentage? A property-management company in the area should have these aggregated.
- How much new for-sale + rental construction is in the pipeline within 1–3 miles? Heavy new supply typically softens prices + rents 12–24 months out; constrained supply supports both.
Investment metrics
- 1% rule
- 0.96% ✗
- Cap rate
- 7.98%
- Cash-on-cash
- 6.04%
- DSCR
- 1.27
- GRM
- 8.6
CMA / ARV
- ARV (median comp)
- $269,238
- List price
- $225,000
- Delta
- -16.43%
- Verdict
- UNDERPRICED
- Comps
- 20 within 1.0 mi
Show comp detail 12 sales within ~0.75 mi
| Address | Dist | Beds/Ba | Sqft | Sold | Price | $/sf | Match |
|---|---|---|---|---|---|---|---|
| 302 E Jefferson St | 0.28mi | 3/2.0 | 1,917 (-1%) | 10mo | $379,000 | $198 | 74 |
| 614 E Twin Springs St | 0.11mi | 3/2.5 | 1,850 (-4%) | 18mo | $240,000 | $130 | 66 |
| 110 N Gunter St | 0.21mi | 3/2.0 | 2,160 (+12%) | 6mo | $269,000 | $125 | 62 |
| 1218 E Kenwood St | 0.67mi | 3/2.5 | 2,048 (+6%) | 6mo | $200,000 | $98 | 48 |
| 503 N Wright St | 0.60mi | 3/1.5 | 1,696 (-12%) | 7mo | $230,000 | $136 | 43 |
| 600 University St | 0.73mi | 4/2.0 (+1) | 2,112 (+9%) | 1mo | $330,000 | $156 | 41 |
| 832 S Maxwell St | 0.53mi | 3/2.0 | 1,700 (-12%) | 13mo | $260,000 | $153 | 40 |
| 303 S Garrett St | 0.67mi | 2/2.0 (-1) | 1,772 (-8%) | 10mo | $355,000 | $200 | 38 |
| 605 N Wright St | 0.65mi | 4/2.0 (+1) | 1,689 (-13%) | 7mo | $315,000 | $187 | 34 |
| 503 W Twin Spgs | 0.64mi | 3/2.0 | 2,144 (+11%) | 22mo | $325,000 | $152 | 30 |
| 414 Franklin St | 0.57mi | 3/2.0 | 1,650 (-15%) | 22mo | $299,000 | $181 | 27 |
| 923 S Mount Olive St | 0.64mi | 3/2.0 | 2,196 (+14%) | 23mo | $279,000 | $127 | 24 |
Match score weights: distance 35% · size 25% · config 20% · recency 20%. Top-matched comps best support the ARV.
Projected returns pro-forma
-3.0% appreciation · 3.0% rent growth · sell at horizon
- IRR
- -7.0%
- Equity multiple
- 0.74×
- Total profit
- $-16,336
- Equity at exit
- $33,548
- IRR
- 2.6%
- Equity multiple
- 1.18×
- Total profit
- $11,508
- Equity at exit
- $19,454
Cash invested: $63,000 (down + closing). Projections, not guarantees.
Landlord ↔ Tenant lean methodology
- Overall (STATE)
- 92 Strongly Landlord-Friendly
- State Arkansas
- 92 Strongly Landlord-Friendly · R+14
- County
- — inherits STATE
- City
- — inherits STATE
ZIP-level market 72761
- Home prices YoY
- -13.6%
- Active inventory
- 362
- Price-to-rent
- 8.6×
Monthly cashflow live
- Estimated rent
- $2,168 high interval (Pro) →
- Mortgage (P&I)
- −$1,180
- Tax from tax record
- −$122 /mo · $1,469/yr
- Insurance
- −$94
- HOA
- −$0
- Vacancy / Maint / Mgmt
- −$455
- Net cashflow
- $317
Break-even live
UW: 25.0% down · 7.5% · 30yr · 1.5% tax · 5.0% vac · 8.0% maint · 8.0% mgmt
Financing live
Cash to close
- Down payment
- $56,250
- Closing costs
- $6,750
- Reserves months
- —
- Total cash needed
- —
Loan-product check · same deal, 3 products live
Conventional
25% down · 7.5% · 30yr
- Down + closing
- —
- Monthly P&I
- —
- Monthly cashflow
- —
- DSCR
- —
- Eligible?
- —
Personal DTI + credit; lowest rate.
DSCR
20% down · 8.5% · 30yr
- Down + closing
- —
- Monthly P&I
- —
- Monthly cashflow
- —
- DSCR
- —
- Eligible?
- —
No personal income docs; deal must DSCR.
Hard money
10% down · 12.0% · 12mo
- Down + closing
- —
- Monthly P&I
- —
- Monthly cashflow
- —
- DSCR
- —
- Eligible?
- —
Short-term bridge; refi at stabilization.
Rent comps 18 comps
| Address | Beds | Baths | Sqft | Rent | $/sqft | DOM | Units | Dist |
|---|---|---|---|---|---|---|---|---|
| 426 S Washington St Unit 1520937P Siloam Springs, AR | 3.0 | 2.0 | 1582 | $4,358 | $2.75 | 14d | 1 | 0.15mi |
| 413 S Madison St Unit 1520928P Siloam Springs, AR | 4.0 | 2.0 | 1700 | $3,735 | $2.20 | 14d | 1 | 0.19mi |
| 408 S Wright St Unit 1520957P Siloam Springs, AR | 4.0 | 3.0 | 2109 | $4,449 | $2.11 | 21d | 1 | 0.44mi |
| 851 S Jersey Siloam Springs, AR | 3.0 | 2.0 | 1460 | $1,400 | $0.96 | 23d | 1 | 0.54mi |
| 111 W Tahlequah St Unit 1520930P Siloam Springs, AR | 3.0 | 2.0 | 1345 | $3,827 | $2.85 | 14d | 1 | 0.54mi |
| 315 W Harvard St Unit 1520942P Siloam Springs, AR | 3.0 | 2.0 | 2045 | $3,266 | $1.60 | 13d | 1 | 0.57mi |
| 2060 Ravenwood Blvd Unit B Siloam Springs, AR | 2.0 | 2.0 | 1452 | $1,250 | $0.86 | 14d | 1 | 0.84mi |
| 255 Ravenwood Rd Siloam Springs, AR | 3.0 | 2.0 | 1421 | $1,395 | $0.98 | 23d | 1 | 0.88mi |
| 1806 Azlin Pl Unit C Siloam Springs, AR | 4.0 | 2.5 | 1781 | $1,425 | $0.80 | 14d | 1 | 0.91mi |
| 1903 Azlin Pl Unit B Siloam Springs, AR | 3.0 | 2.5 | 1800 | $1,500 | $0.83 | 21d | 1 | 0.95mi |
| 1903 Azlin Pl Siloam Springs, AR | 3.0 | 2.5 | 1800 | $1,500 | $0.83 | 14d | 1 | 0.96mi |
| 201 N Dogwood St Unit 1241305P Siloam Springs, AR | 3.0 | 2.0 | 1969 | $3,298 | $1.67 | 13d | 1 | 1.09mi |
| 2010 S Elm St Siloam Springs, AR | 3.0 | 2.0 | 1566 | $1,750 | $1.12 | 13d | 1 | 1.15mi |
| 2302 Aspen Siloam Springs, AR | 4.0 | 2.0 | 1940 | $1,850 | $0.95 | 23d | 1 | 1.17mi |
| 1107 E Ken Leach Siloam Springs, AR | 3.0 | 2.0 | 1398 | $1,500 | $1.07 | 21d | 1 | 1.23mi |
| 731 Cypress Ct Unit 1520954P Siloam Springs, AR | 4.0 | 2.0 | 1560 | $3,790 | $2.43 | 13d | 1 | 1.25mi |
| 2910 Dawn Ct Unit C Siloam Springs, AR | 3.0 | 2.0 | 1449 | $1,300 | $0.90 | 23d | 1 | 1.31mi |
| 1413 E Emelyn Siloam Springs, AR | 4.0 | 2.0 | 1900 | $2,000 | $1.05 | 14d | 1 | 1.45mi |
Listing history 30 events
-
2026-06-18days on market $225,000 Active 55 DOM
-
2026-06-17days on market $225,000 Active 54 DOM
-
2026-06-16days on market $225,000 Active 53 DOM
-
2026-06-15days on market $225,000 Active 52 DOM
-
2026-06-14days on market $225,000 Active 50 DOM
-
2026-06-10days on market $225,000 Active 47 DOM
-
2026-06-09days on market $225,000 Active 46 DOM
-
2026-06-08days on market $225,000 Active 45 DOM
-
2026-06-07pricedays on market $225,000 Active 44 DOM
-
2026-06-03days on market $230,000 Active 40 DOM
-
2026-06-02days on market $230,000 Active 39 DOM
-
2026-06-01days on market $230,000 Active 38 DOM
-
2026-05-31days on market $230,000 Active 37 DOM
-
2026-05-31days on market $230,000 Active 36 DOM
-
2026-05-11price $230,000 659-char remark
-
2026-04-24$240,000 Active 659-char remark
-
2022-11-03soldstatus $177,500
-
2022-10-31soldstatus $177,500 Closed 283-char remark
Show marketing remark (283 chars)
Rare 2 1/2 story Historical home located in the heart of Siloam Springs. Close to downtown and shopping. Built in 1910, this home contains 3 bedrooms with a bonus room, 2 living areas, as well as a formal dining room. Natural hardwood floors, tall ceilings and detached shop/carport.
-
2022-09-29status Pending 283-char remark
Show marketing remark (283 chars)
Rare 2 1/2 story Historical home located in the heart of Siloam Springs. Close to downtown and shopping. Built in 1910, this home contains 3 bedrooms with a bonus room, 2 living areas, as well as a formal dining room. Natural hardwood floors, tall ceilings and detached shop/carport.
-
2022-09-13price $187,500 283-char remark
Show marketing remark (283 chars)
Rare 2 1/2 story Historical home located in the heart of Siloam Springs. Close to downtown and shopping. Built in 1910, this home contains 3 bedrooms with a bonus room, 2 living areas, as well as a formal dining room. Natural hardwood floors, tall ceilings and detached shop/carport.
-
2022-09-01price $195,000 283-char remark
Show marketing remark (283 chars)
Rare 2 1/2 story Historical home located in the heart of Siloam Springs. Close to downtown and shopping. Built in 1910, this home contains 3 bedrooms with a bonus room, 2 living areas, as well as a formal dining room. Natural hardwood floors, tall ceilings and detached shop/carport.
-
2022-08-15price $199,500 283-char remark
Show marketing remark (283 chars)
Rare 2 1/2 story Historical home located in the heart of Siloam Springs. Close to downtown and shopping. Built in 1910, this home contains 3 bedrooms with a bonus room, 2 living areas, as well as a formal dining room. Natural hardwood floors, tall ceilings and detached shop/carport.
-
2022-08-10price $203,500 283-char remark
Show marketing remark (283 chars)
Rare 2 1/2 story Historical home located in the heart of Siloam Springs. Close to downtown and shopping. Built in 1910, this home contains 3 bedrooms with a bonus room, 2 living areas, as well as a formal dining room. Natural hardwood floors, tall ceilings and detached shop/carport.
-
2022-07-29price $210,000 283-char remark
Show marketing remark (283 chars)
Rare 2 1/2 story Historical home located in the heart of Siloam Springs. Close to downtown and shopping. Built in 1910, this home contains 3 bedrooms with a bonus room, 2 living areas, as well as a formal dining room. Natural hardwood floors, tall ceilings and detached shop/carport.
-
2022-07-05price $220,000 283-char remark
Show marketing remark (283 chars)
Rare 2 1/2 story Historical home located in the heart of Siloam Springs. Close to downtown and shopping. Built in 1910, this home contains 3 bedrooms with a bonus room, 2 living areas, as well as a formal dining room. Natural hardwood floors, tall ceilings and detached shop/carport.
-
2022-06-27price $230,000 283-char remark
Show marketing remark (283 chars)
Rare 2 1/2 story Historical home located in the heart of Siloam Springs. Close to downtown and shopping. Built in 1910, this home contains 3 bedrooms with a bonus room, 2 living areas, as well as a formal dining room. Natural hardwood floors, tall ceilings and detached shop/carport.
-
2022-06-20$240,000 Active 283-char remark
Show marketing remark (283 chars)
Rare 2 1/2 story Historical home located in the heart of Siloam Springs. Close to downtown and shopping. Built in 1910, this home contains 3 bedrooms with a bonus room, 2 living areas, as well as a formal dining room. Natural hardwood floors, tall ceilings and detached shop/carport.
-
2019-03-05soldstatus $58,110
-
2019-03-01soldstatus $58,100
Show marketing remark (241 chars)
This is a certified historic home in the heart of Siloam Springs that has tons of potential and a huge lot, big enough to build another home on. Detached shop/garage and a storage building on site has enough space to store anything you have.
-
2018-11-03$60,000
Show marketing remark (241 chars)
This is a certified historic home in the heart of Siloam Springs that has tons of potential and a huge lot, big enough to build another home on. Detached shop/garage and a storage building on site has enough space to store anything you have.
ⓘ Source: listings_history table (triggers on properties + properties_extension) + one-shot
backfill from property_details.listing_events for pre-trigger history.
Tax reassessment forecast AR · Resets to sale price
- Current annual tax
- $1,469 · $122/mo
- Projected year-2 tax
- $1,469 · $122/mo
- Expected delta
- $0/yr ($0/mo · 0.0%)
ⓘ Screening estimate from a state-policy table — verify with the county assessor before closing.
Climate risk First Street
- Flood 1/10 Low FEMA zone X (unshaded) · 0% chance over 30 yrs
- Wildfire 6/10 Major
- Heat 5/10 Major 7 d/yr ≥106°F today · 21 d/yr by 30 yrs out
- Wind 2/10 Low 2% chance of damaging wind over 30 yrs
- Air quality 2/10 Low 1 unhealthy d/yr today · 2 by 30 yrs out
Nearby sold comps map
Loading sold comps map…
Walkable amenities ~0.75 mi
Loading nearby amenities…
Taxation est. · year 1
- Rental income
- $26,022
- − Mortgage interest
- −$12,603
- − Property taxes
- −$1,469
- − Insurance
- −$1,125
- − Repairs & maintenance
- −$2,082
- − Management
- −$2,082
- − Depreciation
- −$6,545
- Taxable income
- $115
- Est. tax owed @ 24.0%
- −$28
- After-tax cash flow
- $3,776/yr
For passive investors: Depreciation is non-cash, so a rental often shows a tax loss while cash-flowing — sheltering income. Rental losses are passive: they offset passive income freely, and up to $25,000/yr can offset ordinary (W-2) income if you actively participate and your MAGI is under $100k (phasing out to $0 by $150k); unused losses carry forward. On sale, claimed depreciation is recaptured at up to 25%, and gains may owe capital-gains tax (a 1031 exchange can defer both). Figures are a year-1 estimate at your 24.0% rate — not tax advice; consult a CPA.
Schools (NCES district)
- District
- Siloam Springs School District
- NCES district ID
- 0512450
- Math proficiency
- 44% ▼ -7.00%
- Reading proficiency
- 40% ▼ -2.00%
- Median HH income
- $46,222
- Composite
- 35.81/100
- National rank
- #4828
- State rank
- #53 of 238 in AR
Livability — Siloam Springs
- Score
- 74/100
- State rank
- #17
- US rank
- #4621
Category grades
Schools grade is shown separately in the Schools card above.
Census & demographics
- Census place
- Siloam Springs, AR
- County
- Benton County · 259,241 people
- City population
- 24,745
- Metro
- Fayetteville-Springdale-Rogers, AR
- Population (ZIP)
- 24,745
- Household income
- $76,122
- Rent vs Own
- Severe rent burden
- 176.0
Population outlook (Benton County) Hauer SSP2
- Today (2025)
- 318,683 people
- By 2030
- 353,481 · +10.9%
- By 2040
- 425,280 · +33.4%
- By 2050
- 497,239 · +56.0%
- By 2075
- 662,114 · +107.8%
- By 2100
- 776,431 · +143.6%
Race, ethnicity, and origin ACS 2023
- Neighborhood character
- Diverse neighborhood (Simpson 0.63)
- Race & ethnicity
- White 58% Two or more races 24% Hispanic / Latino 19% Native American 4% Asian 3%
- Hispanic origin (detail)
- Mexican 8% Puerto Rican 2%
- Common ancestry
- Italian 2% Slovak 1% Serbian 1%
- Foreign-born
- 11% · Canada
- Languages at home
- 85% English-only · Spanish 13% Other Indo-European 1%
Political lean MEDSL · Benton
- 2024 margin
- Strong R (+27.0) · D 35.2% · R 62.1% · Other 2.7%
- 2008→2024 swing
- +9.6pp toward D · 2008: -36.5pp · 2024: -27.0pp
- All cycles
- 2024: R+27.0 2020: R+26.4 2016: R+34.9 2012: R+40.4 2008: R+36.5
Not yet ingested
- Civics
- —
Market trends
- HPI YoY
- ▼ -45.93%
- Current HPI
- 291.1062
- Rent YoY
- —
- Metro
- Fayetteville-Springdale-Rogers, AR
- State GDP YoY
- ▲ 3.80%
- F500 in state
- 10
Industry mix (Fortune 500 HQ in AR)
| Industry | F500 HQs | Revenue |
|---|---|---|
| Retail | 1 | $681B |
|
||
| Food / Agriculture | 1 | $53B |
|
||
| Retail / Energy | 1 | $22B |
|
||
| Transportation / Logistics | 1 | $12B |
|
||
| Energy | 1 | $4B |
|
||
Price history
+275.0% since first listed17 events — show timeline
- 2026-06-03 Price Changed $225,000 NWARMLS
- 2026-05-11 Price Changed $230,000 NWARMLS
- 2026-04-24 Listed $240,000 NWARMLS
- 2022-11-03 Sold (Public Records) $177,500 Public Records
- 2022-10-31 Sold (MLS) $177,500 NWARMLS
- 2022-09-29 Pending — NWARMLS
- 2022-09-13 Price Changed $187,500 NWARMLS
- 2022-09-01 Price Changed $195,000 NWARMLS
- 2022-08-15 Price Changed $199,500 NWARMLS
- 2022-08-10 Price Changed $203,500 NWARMLS
- 2022-07-29 Price Changed $210,000 NWARMLS
- 2022-07-05 Price Changed $220,000 NWARMLS
- 2022-06-27 Price Changed $230,000 NWARMLS
- 2022-06-20 Listed $240,000 NWARMLS
- 2019-03-05 Sold (Public Records) $58,110 Public Records
- 2019-03-01 Sold (MLS) $58,100 NWARMLS
- 2018-11-03 Listed $60,000 NWARMLS
Property tax history
+19.9%/yrLatest (2025): $1,469 · +10.2% YoY. Source: county tax records.
Cash-flow waterfall
monthlySold comps — $/sqft
last 12 mo · ≤1 miLoading sold comps…