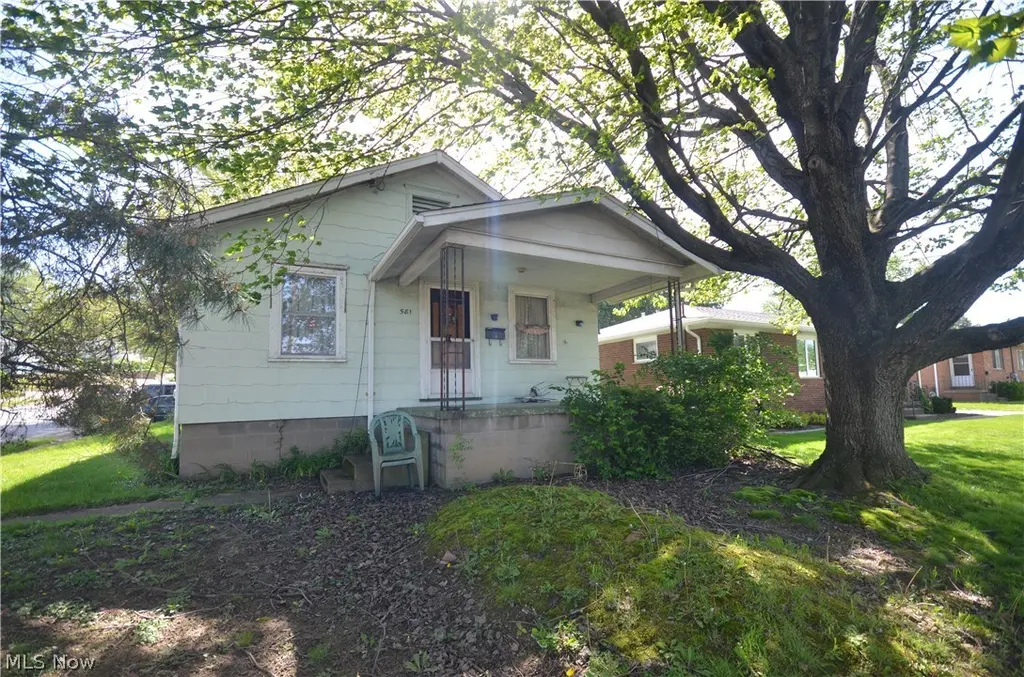
581 Baldwin Rd · Akron, OH
Flood risk 1/10 · Minimal
- FEMA flood zone
- X (unshaded)
- Chance of flooding over 30 yrs
- 0.0%
- Est. flood insurance / yr
- $473 – $860
Fire risk 1/10 · Minimal
- Est. fire insurance / yr
- $713 – $1,323
Heat risk 3/10 · Minor
- Hot days now (above 97°F)
- 7 days/yr
- Hot days in 30 yrs
- 17 days/yr
Wind risk 1/10 · Minimal
- Chance of severe wind over 30 yrs
- —
Air-quality risk 2/10 · Minimal
- Unhealthy air days now
- 1 days/yr
- Unhealthy air days in 30 yrs
- 2 days/yr
Risk factors via First Street. Map © Google.
Why this score? — see what drove the C+ grade
The composite is a weighted blend of 9 inputs, each scored 0–100. Each bar is that input's sub-score; the figure is the points it added to the 100-point composite (weight × sub-score).
- Cash flow +20.4/30.0
- ARV discount +15.0/15.0
- 1% rule +7.7/10.0
- DSCR +6.5/10.0
- Livability +4.0/5.0
- Rent growth +2.5/5.0
- Condition / age +2.5/5.0
- Schools +2.1/10.0
- Appreciation +0.0/10.0
$79,900
🖨 Deal sheet 📄 Offer letter ✓ Due diligence
Listing remarks
Tons of potential in this Ellet ranch! Spacious living area and a nice sized kitchen with eating area make it an excellent option. The = lot extends beyond the 1 car garage w concrete floor. There is a patio out back that leads to the rear door of the home and out front there is a large covered patio. Dimensional Shingle roof. The eat in kitchen has a nice sized eating area along with good cabinet storage. The living area is very large for a 2 bedroom home and included a brick decorative fireplace. 2 Bedrooms and a full bathroom on the main level. There is a full basement including a laundry area. The home is being sold AS IS including all contents inside of the home. Seller reserves the ri
Key facts
- 7,200 sq ft lot
- Garage
- Built 1920
Neighborhood map
What this means for you Summary
Snapshot
- This is a 2-bed/1.0-bath single-family listed at $80k.
Deal economics
- At list price, monthly cash flow is $104 ($1k/yr) — positive.
- The deal already cash-flows at list — no discount required.
- Meets the 1% rule at list price ($1k rent vs $80k).
Location & tenants
- Location reads 81/100 on livability (#104 in OH, #1,591 nationally) — a professional / high-income tenant draw. Strengths: amenities A+, commute A+, cost of living A+; Watch: crime F, employment F.
- Akron City (urban): math 22% / reading 30% proficiency, ranked #602 of 656 in OH (top 92%) — low school quality limits family demand, transient renter base, plan for 1-2y turnover; 66% free/reduced lunch — lower-income household profile, screen leases tightly.
- Market conditions: 137 active listings in the ZIP; 23 comparable units currently listed for rent nearby; rentals at typical pace (median 24d on market — plan ~3-4 weeks tenant-placement turnaround); 1,114 units permitted in Summit County in 2024 (397 in 5+ unit buildings).
Forward outlook
- Local home prices are declining (-3.0%/yr); year-one equity from $552 of loan paydown is wiped out by about $2k of value loss. Plan a longer hold.
- Summit County population projected to shrink 6% by 2050 — rents likely to lag national; underwrite the cash flow, not the appreciation.
Negotiation context
- Only 0 days on market — expect competitive offers; lowballing is unlikely to land.
Risks & watch-outs
- Watch-outs: property tax is 3.7% of price; built in 1920 — expect roof / HVAC / electrical / plumbing capex.
Questions for the listing agent
- Built in 1920 — when were the roof, HVAC, electrical panel, plumbing, and water heater last replaced?
- Property tax is high relative to price — has the assessment been appealed recently, and will the sale trigger a re-assessment?
- Is there a deadline driving the sale (1031 exchange, divorce, estate, relocation)? That informs how much negotiation room exists.
- Crime grade is F in this area — have there been break-ins, vandalism, or insurance claims at this property in the last 3 years? What carrier currently insures it and at what premium?
- What's the average days-on-market for RENTAL listings here right now (not sales)? A rising rental-DOM trend means longer vacancies and softer asking-rent achievability than the comps imply.
- What's the recent tenant-quality profile in this submarket — average credit score on applications, eviction rate, late-payment / NSF rate, and stable-employment percentage? A property-management company in the area should have these aggregated.
- How much new for-sale + rental construction is in the pipeline within 1–3 miles? Heavy new supply typically softens prices + rents 12–24 months out; constrained supply supports both.
Investment metrics
- 1% rule
- 1.27% ✓
- Cap rate
- 7.86%
- Cash-on-cash
- 5.59%
- DSCR
- 1.25
- GRM
- 6.6
CMA / ARV
- ARV (on-the-fly)
- $149,732
- Comps found
- 12
Show comp detail 12 sales within ~0.75 mi
| Address | Dist | Beds/Ba | Sqft | Sold | Price | $/sf | Match |
|---|---|---|---|---|---|---|---|
| 581 Baldwin Rd | 0.00mi | 2/1.0 | 913 (0%) | 1mo | $69,500 | $76 | 99 |
| 614 Stanley Rd | 0.28mi | 2/1.0 | 913 (0%) | 1mo | $150,000 | $164 | 86 |
| 1867 Triplett Blvd | 0.13mi | 2/1.5 | 1,016 (+11%) | 2mo | $155,000 | $153 | 72 |
| 581 Stanley Rd | 0.29mi | 3/2.0 (+1) | 980 (+7%) | 3mo | $193,000 | $197 | 62 |
| 547 Lansing Rd | 0.37mi | 3/2.0 (+1) | 960 (+5%) | 7mo | $180,000 | $188 | 59 |
| 545 Hillman Rd | 0.25mi | 3/1.0 (+1) | 1,040 (+14%) | 2mo | $187,500 | $180 | 59 |
| 636 Woodstock Rd | 0.58mi | 2/1.0 | 960 (+5%) | 7mo | $134,900 | $141 | 58 |
| 451 Fulmer Ave | 0.30mi | 3/1.5 (+1) | 1,040 (+14%) | 1mo | $215,000 | $207 | 54 |
| 586 Ingalls Rd | 0.53mi | 3/2.0 (+1) | 960 (+5%) | 6mo | $182,000 | $190 | 53 |
| 597 Hillman Rd | 0.24mi | 3/2.0 (+1) | 1,040 (+14%) | 8mo | $163,500 | $157 | 50 |
| 364 Stanley Rd | 0.49mi | 3/1.0 (+1) | 805 (-12%) | 7mo | $100,000 | $124 | 46 |
| 1835 Penthley Ave | 0.58mi | 3/1.0 (+1) | 1,040 (+14%) | 4mo | $155,000 | $149 | 42 |
Match score weights: distance 35% · size 25% · config 20% · recency 20%. Top-matched comps best support the ARV.
Projected returns pro-forma
-3.0% appreciation · 3.0% rent growth · sell at horizon
- IRR
- -7.5%
- Equity multiple
- 0.72×
- Total profit
- $-6,207
- Equity at exit
- $11,913
- IRR
- 2.2%
- Equity multiple
- 1.16×
- Total profit
- $3,566
- Equity at exit
- $6,908
Cash invested: $22,372 (down + closing). Projections, not guarantees.
Landlord ↔ Tenant lean methodology
- Overall (STATE)
- 73 Landlord-Friendly
- State Ohio
- 73 Landlord-Friendly · R+6
- County
- — inherits STATE
- City
- — inherits STATE
ZIP-level market 44312
- Active inventory
- 137
- Price-to-rent
- 6.6×
Monthly cashflow live
- Estimated rent
- $1,016 high interval (Pro) →
- Mortgage (P&I)
- −$419
- Tax from tax record
- −$246 /mo · $2,954/yr
- Insurance
- −$33
- HOA
- −$0
- Vacancy / Maint / Mgmt
- −$213
- Net cashflow
- $104
Break-even live
UW: 25.0% down · 7.5% · 30yr · 1.5% tax · 5.0% vac · 8.0% maint · 8.0% mgmt
Financing live
Cash to close
- Down payment
- $19,975
- Closing costs
- $2,397
- Reserves months
- —
- Total cash needed
- —
Loan-product check · same deal, 3 products live
Conventional
25% down · 7.5% · 30yr
- Down + closing
- —
- Monthly P&I
- —
- Monthly cashflow
- —
- DSCR
- —
- Eligible?
- —
Personal DTI + credit; lowest rate.
DSCR
20% down · 8.5% · 30yr
- Down + closing
- —
- Monthly P&I
- —
- Monthly cashflow
- —
- DSCR
- —
- Eligible?
- —
No personal income docs; deal must DSCR.
Hard money
10% down · 12.0% · 12mo
- Down + closing
- —
- Monthly P&I
- —
- Monthly cashflow
- —
- DSCR
- —
- Eligible?
- —
Short-term bridge; refi at stabilization.
Rent comps 23 comps
| Address | Beds | Baths | Sqft | Rent | $/sqft | DOM | Units | Dist |
|---|---|---|---|---|---|---|---|---|
| 1920 Garden Ct S Akron, OH | 2.0 | 1.0 | 800 | $1,019 | $1.27 | 14d | 1 | 0.74mi |
| 551 Baltimore Ave Akron, OH | 2.0 | 1.0 | 588 | $850 | $1.45 | 23d | 1 | 0.93mi |
| 551 Baltimore Ave Unit 551 Akron, OH | 2.0 | 1.0 | 588 | $850 | $1.45 | 43d | 1 | 0.94mi |
| 779 Anderson Ave Apt 11 Akron, OH | 2.0 | 1.0 | 900 | $900 | $1.00 | 23d | 1 | 0.97mi |
| 779 Anderson Ave Apt 10 Akron, OH | 2.0 | 1.0 | 900 | $900 | $1.00 | 14d | 1 | 0.97mi |
| 779 Anderson Ave Apt 11 Akron, OH | 2.0 | 1.0 | 900 | $900 | $1.00 | 43d | 1 | 0.97mi |
| 769 Anderson Ave #6 Akron, OH | 1.0 | 1.0 | 600 | $785 | $1.31 | 14d | 1 | 0.97mi |
| 783 Anderson Ave Apt 10 Akron, OH | 2.0 | 1.0 | 900 | $900 | $1.00 | 14d | 1 | 0.98mi |
| 783 Anderson Ave Apt 5 Akron, OH | 2.0 | 1.0 | 900 | $900 | $1.00 | 43d | 1 | 0.98mi |
| 794 Anderson Ave #9 Akron, OH | 1.0 | 1.0 | 600 | $785 | $1.31 | 23d | 1 | 1.01mi |
| 780 Anderson Ave #13 Akron, OH | 1.0 | 1.0 | 700 | $785 | $1.12 | 43d | 1 | 1.01mi |
| 780 Anderson Ave #12 Akron, OH | 1.0 | 1.0 | 700 | $785 | $1.12 | 14d | 1 | 1.01mi |
| 778 Ravenswood St Akron, OH | 2.0 | 1.0 | 616 | $1,150 | $1.87 | 23d | 1 | 1.21mi |
| 931 Crestline Dr Akron, OH | 3.0 | 1.0 | 976 | $1,550 | $1.59 | 14d | 1 | 1.22mi |
| 1628 E Market St Akron, OH | 2.0 | 1.0 | 800 | $850 | $1.06 | 43d | 1 | 1.26mi |
| 1125 Georgia Ave Akron, OH | 3.0 | 1.0 | 1060 | $1,300 | $1.23 | 14d | 1 | 1.27mi |
| 1093 Georgia Ave Akron, OH | 2.0 | 1.0 | 752 | $1,103 | $1.47 | 14d | 1 | 1.33mi |
| 920 Clement St Akron, OH | 2.0 | 1.0 | 940 | $995 | $1.06 | 14d | 1 | 1.36mi |
| 2612 Leland Ave Unit Left/Down Akron, OH | 2.0 | 1.0 | 572 | $850 | $1.49 | 21d | 1 | 1.36mi |
| 1078 Lindsay Ave Akron, OH | 3.0 | 2.0 | 1005 | $1,350 | $1.34 | 43d | 1 | 1.38mi |
| 1055 Neville Ave Akron, OH | 2.0 | 1.0 | 600 | $700 | $1.17 | 43d | 1 | 1.41mi |
| 668 Roscoe Ave Akron, OH | 2.0 | 1.0 | 720 | $875 | $1.22 | 43d | 1 | 1.44mi |
| 1017 Neville Ave Akron, OH | 2.0 | 1.0 | 600 | $675 | $1.12 | 43d | 1 | 1.49mi |
Listing history 2 events
-
2026-05-05historical
-
2026-05-04$79,900
ⓘ Source: listings_history table (triggers on properties + properties_extension) + one-shot
backfill from property_details.listing_events for pre-trigger history.
Tax reassessment forecast OH · Partial reset (capped growth)
- Current annual tax
- $2,954 · $246/mo
- Projected year-2 tax
- $2,954 · $246/mo
- Expected delta
- $0/yr ($0/mo · 0.0%)
ⓘ Screening estimate from a state-policy table — verify with the county assessor before closing.
Climate risk First Street
- Flood 1/10 Low FEMA zone X (unshaded) · 0% chance over 30 yrs
- Wildfire 1/10 Low
- Heat 3/10 Moderate 7 d/yr ≥97°F today · 17 d/yr by 30 yrs out
- Wind 1/10 Low
- Air quality 2/10 Low 1 unhealthy d/yr today · 2 by 30 yrs out
Nearby sold comps map
Loading sold comps map…
Walkable amenities ~0.75 mi
Loading nearby amenities…
Taxation est. · year 1
- Rental income
- $12,192
- − Mortgage interest
- −$4,476
- − Property taxes
- −$2,954
- − Insurance
- −$400
- − Repairs & maintenance
- −$975
- − Management
- −$975
- − Depreciation
- −$2,324
- Taxable income
- $88
- Est. tax owed @ 24.0%
- −$21
- After-tax cash flow
- $1,229/yr
For passive investors: Depreciation is non-cash, so a rental often shows a tax loss while cash-flowing — sheltering income. Rental losses are passive: they offset passive income freely, and up to $25,000/yr can offset ordinary (W-2) income if you actively participate and your MAGI is under $100k (phasing out to $0 by $150k); unused losses carry forward. On sale, claimed depreciation is recaptured at up to 25%, and gains may owe capital-gains tax (a 1031 exchange can defer both). Figures are a year-1 estimate at your 24.0% rate — not tax advice; consult a CPA.
Schools (NCES district)
- District
- Akron City
- NCES district ID
- 3904348
- Math proficiency
- 22% ▼ -17.00%
- Reading proficiency
- 30% ▼ -12.00%
- Median HH income
- $33,811
- Composite
- 21.31/100
- National rank
- #8383
- State rank
- #602 of 656 in OH
Livability — Akron
- Score
- 81/100
- State rank
- #104
- US rank
- #1591
Category grades
Schools grade is shown separately in the Schools card above.
Census & demographics
- Census place
- Akron, OH
- County
- Summit County · 440,783 people
- Metro
- Akron, OH
- Population (ZIP)
- 30,280
- Household income
- $65,480
- Rent vs Own
- Severe rent burden
- 483.0
Population outlook (Summit County) Hauer SSP2
- Today (2025)
- 546,583 people
- By 2030
- 544,028 · -0.5%
- By 2040
- 531,363 · -2.8%
- By 2050
- 514,923 · -5.8%
- By 2075
- 481,765 · -11.9%
- By 2100
- 432,265 · -20.9%
Race, ethnicity, and origin ACS 2023
- Neighborhood character
- Predominantly White (90%)
- Race & ethnicity
- White 90% Two or more races 5% Black 3% Hispanic / Latino 2%
- Common ancestry
- Romanian 3% Slovak 2% Serbian 2%
- Foreign-born
- 2% · Canada
- Languages at home
- 97% English-only · Spanish 2% Russian/Polish/Slavic 1%
Political lean MEDSL · Summit
- 2024 margin
- Lean D (+7.0) · D 53.0% · R 46.0%
- 2008→2024 swing
- -9.6pp toward R · 2008: 16.6pp · 2024: 7.0pp
- All cycles
- 2024: D+7.0 2020: D+9.6 2016: D+8.2 2012: D+14.8 2008: D+16.6
Not yet ingested
- Civics
- —
Market trends
- HPI YoY
- ▼ -203.00%
- Current HPI
- 197.5988
- Rent YoY
- —
- Metro
- Akron, OH
- State GDP YoY
- ▲ 1.98%
- F500 in state
- 48
Industry mix (Fortune 500 HQ in OH)
| Industry | F500 HQs | Revenue |
|---|---|---|
| Insurance | 3 | $145B |
|
||
| Industrial Machinery | 3 | $49B |
|
||
| Financial Services | 3 | $24B |
|
||
| Consumer Goods | 2 | $93B |
|
||
| Aerospace / Defense | 2 | $47B |
|
||
| Utilities | 2 | $33B |
|
||
Price history
2 events — show timeline
- 2026-05-05 Listing Removed — MLSNOW
- 2026-05-04 Listed $79,900 MLSNOW
Property tax history
+8.2%/yrLatest (2025): $2,954 · +15.1% YoY. Source: county tax records.
Cash-flow waterfall
monthlySold comps — $/sqft
last 12 mo · ≤1 miLoading sold comps…