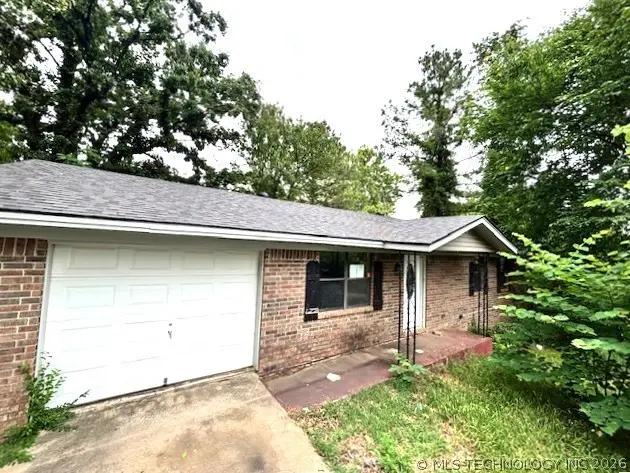
500 NW 2nd St · Wilburton, OK
Flood risk 1/10 · Minimal
- FEMA flood zone
- X
- Chance of flooding over 30 yrs
- 0.0%
- Est. flood insurance / yr
- $507 – $1,088
Fire risk 7/10 · Major
- Est. fire insurance / yr
- $2,463 – $4,575
Heat risk 6/10 · Moderate
- Hot days now (above 112°F)
- 7 days/yr
- Hot days in 30 yrs
- 19 days/yr
Wind risk 3/10 · Minor
- Chance of severe wind over 30 yrs
- 6.0%
Air-quality risk 2/10 · Minimal
- Unhealthy air days now
- 1 days/yr
- Unhealthy air days in 30 yrs
- 1 days/yr
Risk factors via First Street. Map © Google.
Why this score? — see what drove the C- grade
The composite is a weighted blend of 9 inputs, each scored 0–100. Each bar is that input's sub-score; the figure is the points it added to the 100-point composite (weight × sub-score).
- Cash flow +20.2/30.0
- DSCR +6.4/10.0
- Appreciation +5.2/10.0
- ARV discount +4.9/15.0
- 1% rule +4.5/10.0
- Livability +3.0/5.0
- Rent growth +2.5/5.0
- Condition / age +2.5/5.0
- Schools +2.0/10.0
$99,900
🖨 Deal sheet (PDF) 📄 Offer letter ✓ Due diligence
Listing remarks MLS
Adorable & affordable 3 bedroom 2 bath brick home w/ separate office space w/ built in desk & bookshelves, eat-in kitchen, laundry room, 2 storage buildings, large deck, w/ built in table & seating, & beautiful landscaping!! Don't miss out!
Key facts
- Enclosed garage area
- Cul-de-sac setting
- Large storage barn
Tags
Property features AI
Exterior
- Security: No safety shelter
- Utilities: Electricity available; Public water; Public sewer
- Home design: Single-story; Faces west; Slab foundation
- Construction: Brick and wood frame construction; Asphalt/fiberglass roof
- Exterior features: Deck; Shed(s); Located on a cul-de-sac
Interior
- Kitchen: Oven; Range; Stove; Dishwasher
- Flooring: Concrete; Laminate
- Bathrooms: 1 full bathroom; 1 half bathroom
- Heating & cooling: Central heating (electric); Central air conditioning
- Interior features: Ceiling fan(s); Laminate counters; Electric range connection; Vinyl windows; No additional interior exterior features listed
- Laundry & utility: Washer hookup; Electric dryer hookup; Washer; Dryer; Electric water heater
Neighborhood map
What this means for you Summary
Snapshot
- This is a 3-bed/2.0-bath single-family listed at $100k.
Deal economics
- At list price, monthly cash flow is $126 ($2k/yr) — positive.
- The deal already cash-flows at list — no discount required.
- To meet the 1% rule (rent ≥ 1% of price), the offer needs to be $95k (4.9% below list).
- Recommended offer: $95k (4.9% below list) — sets the bar for 1% rule.
Location & tenants
- Location reads 60/100 on livability (#351 in OK) — a middle-class / working-renter tenant base. Strengths: cost of living A+, housing A+, crime B+; Watch: schools F, amenities F, commute F.
- Wilburton (town): math 25% / reading 22% proficiency, ranked #136 of 270 in OK (top 50%) — low school quality limits family demand, transient renter base, plan for 1-2y turnover.
- Market conditions: 57 active listings in the ZIP.
Forward outlook
- In year one you build about $1k of equity ($691 loan paydown + $412 appreciation (0.4% local appreciation)).
- Latimer County population projected at -24% by 2050 — secular population decline; favor cash flow + early exit over multi-decade hold.
- At projected returns (0.4% appreciation + 3.0% rent growth), your $28k cash investment doubles in ~8 years — after that, you're playing with house money.
Negotiation context
- It's been on market 31 days — a 3% lower offer ($97k) is reasonable based on typical stale-listing flexibility.
- 3 sale attempts since 9y ago with the ask held roughly flat each time — persistent listings suggest the price (not the market) is what's stuck; bring a comps-based counter.
- Current owner paid $72k; 39% above their basis — modest negotiation headroom, anchor on the comps not their cost.
Risks & watch-outs
- Climate carrying-cost: major wildfire risk; extreme-heat days projected 7→19/yr by 2055 (HVAC capex compounding) — expect insurance premiums to compound above CPI over the hold.
Questions for the listing agent
- It's been on market 31 days. Have you received any prior offers? Is the seller open to a 5% concession, seller financing, or rate buy-down credit?
- Is there a deadline driving the sale (1031 exchange, divorce, estate, relocation)? That informs how much negotiation room exists.
- Schools are F-rated, which usually means shorter tenancies and higher turnover. Who's the typical renter profile here, and what's been the actual vacancy rate?
- What's the average days-on-market for RENTAL listings here right now (not sales)? A rising rental-DOM trend means longer vacancies and softer asking-rent achievability than the comps imply.
- What's the recent tenant-quality profile in this submarket — average credit score on applications, eviction rate, late-payment / NSF rate, and stable-employment percentage? A property-management company in the area should have these aggregated.
- How much new for-sale + rental construction is in the pipeline within 1–3 miles? Heavy new supply typically softens prices + rents 12–24 months out; constrained supply supports both.
Investment metrics
- 1% rule
- 0.95% ✗
- Cap rate
- 7.80%
- Cash-on-cash
- 5.40%
- DSCR
- 1.24
- GRM
- 8.8
CMA / ARV
- ARV (on-the-fly)
- $94,500
- Comps found
- 5
Show comp detail 5 sales within ~0.75 mi
| Address | Dist | Beds/Ba | Sqft | Sold | Price | $/sf | Match |
|---|---|---|---|---|---|---|---|
| 700 W Caddo | 0.34mi | 3/1.0 | 1,020 (-3%) | 10mo | $69,000 | $68 | 67 |
| 203 E Cedar Ave | 0.63mi | 3/1.0 | 1,056 (+1%) | 3mo | $115,000 | $109 | 63 |
| 111 E Blair Ave | 0.31mi | 2/2.0 (-1) | 936 (-11%) | 21mo | $69,200 | $74 | 45 |
| 116 SW 10th | 0.59mi | 3/1.5 | 1,164 (+11%) | 11mo | $105,000 | $90 | 44 |
| 414 E Ada | 0.66mi | 3/1.0 | 1,100 (+5%) | 19mo | $105,000 | $95 | 41 |
Match score weights: distance 35% · size 25% · config 20% · recency 20%. Top-matched comps best support the ARV.
Projected returns pro-forma
0.41% appreciation · 3.0% rent growth · sell at horizon
- IRR
- 5.1%
- Equity multiple
- 1.25×
- Total profit
- $7,018
- Equity at exit
- $31,087
- IRR
- 9.9%
- Equity multiple
- 2.13×
- Total profit
- $31,675
- Equity at exit
- $39,071
Cash invested: $27,972 (down + closing). Projections, not guarantees.
Landlord ↔ Tenant lean methodology
- Overall (STATE)
- 83 Strongly Landlord-Friendly
- State Oklahoma
- 83 Strongly Landlord-Friendly · R+20
- County
- — inherits STATE
- City
- — inherits STATE
ZIP-level market 74578
- Home prices YoY
- 0.2%
- Active inventory
- 57
- Price-to-rent
- 8.8×
Monthly cashflow live
- Estimated rent
- $950 medium interval (Pro) →
- Mortgage (P&I)
- −$524
- Tax from tax record
- −$59 /mo · $709/yr
- Insurance
- −$42
- HOA
- −$0
- Vacancy / Maint / Mgmt
- −$199
- Net cashflow
- $126
Break-even live
Sensitivity live
| Price | -10% $182 | -5% $154 | +0% $126 | +5% $98 | +10% $69 |
|---|---|---|---|---|---|
| Rent | -10% $51 | -5% $88 | +0% $126 | +5% $163 | +10% $201 |
| Rate | -1.0pp $176 | -0.5pp $151 | base $126 | +0.5pp $100 | +1.0pp $74 |
UW: 25.0% down · 7.5% · 30yr · 1.5% tax · 5.0% vac · 8.0% maint · 8.0% mgmt
Financing live
Cash to close
- Down payment
- $24,975
- Closing costs
- $2,997
- Reserves months
- —
- Total cash needed
- —
Loan-product check · same deal, 3 products live
Conventional
25% down · 7.5% · 30yr
- Down + closing
- —
- Monthly P&I
- —
- Monthly cashflow
- —
- DSCR
- —
- Eligible?
- —
Personal DTI + credit; lowest rate.
DSCR
20% down · 8.5% · 30yr
- Down + closing
- —
- Monthly P&I
- —
- Monthly cashflow
- —
- DSCR
- —
- Eligible?
- —
No personal income docs; deal must DSCR.
Hard money
10% down · 12.0% · 12mo
- Down + closing
- —
- Monthly P&I
- —
- Monthly cashflow
- —
- DSCR
- —
- Eligible?
- —
Short-term bridge; refi at stabilization.
Listing history 23 events
-
2026-06-21days on market $99,900 Active 31 DOM
-
2026-06-18days on market $99,900 Active 29 DOM
-
2026-06-17days on market $99,900 Active 28 DOM
-
2026-06-16days on market $99,900 Active 27 DOM
-
2026-06-15days on market $99,900 Active 26 DOM
-
2026-06-13days on market $99,900 Active 24 DOM
-
2026-06-12days on market $99,900 Active 23 DOM
-
2026-06-09days on market $99,900 Active 20 DOM
-
2026-06-08days on market $99,900 Active 19 DOM
-
2026-06-08days on market $99,900 Active 18 DOM
-
2026-06-07days on market $99,900 Active 17 DOM
-
2026-06-04days on market $99,900 Active 14 DOM
-
2026-06-02days on market $99,900 Active 13 DOM
-
2026-06-01days on market $99,900 Active 12 DOM
-
2026-05-31days on market $99,900 Active 11 DOM
-
2026-05-19$99,900 Active
-
2025-09-16historical
-
2025-07-01$79,000 Active
-
2017-11-30soldstatus $72,000
-
2017-11-29soldstatus $72,000 263-char remark
Show marketing remark (263 chars)
Adorable & affordable 3 bedroom 2 bath brick home w/ separate office space w/ built in desk & bookshelves, eat-in kitchen, laundry room, 2 storage buildings, large deck, w/ built in table & seating, & beautiful landscaping!! Don't miss out!
-
2017-09-13soldstatus $170,000
-
2017-06-22$79,000 263-char remark
Show marketing remark (263 chars)
Adorable & affordable 3 bedroom 2 bath brick home w/ separate office space w/ built in desk & bookshelves, eat-in kitchen, laundry room, 2 storage buildings, large deck, w/ built in table & seating, & beautiful landscaping!! Don't miss out!
-
2001-02-09soldstatus $45,000
ⓘ Source: listings_history table (triggers on properties + properties_extension) + one-shot
backfill from property_details.listing_events for pre-trigger history.
Tax reassessment forecast OK · Resets to sale price
- Current annual tax
- $709 · $59/mo
- Projected year-2 tax
- $899 · $75/mo
- Expected delta
- +$190/yr (+$16/mo · 26.8%)
ⓘ Screening estimate from a state-policy table — verify with the county assessor before closing.
Climate risk First Street
- Flood 1/10 Low FEMA zone X · 0% chance over 30 yrs
- Wildfire 7/10 Severe
- Heat 6/10 Major 7 d/yr ≥112°F today · 19 d/yr by 30 yrs out
- Wind 3/10 Moderate 6% chance of damaging wind over 30 yrs
- Air quality 2/10 Low 1 unhealthy d/yr today · 1 by 30 yrs out
Nearby sold comps map
Loading sold comps map…
Walkable amenities ~0.75 mi
Loading nearby amenities…
Taxation est. · year 1
- Rental income
- $11,398
- − Mortgage interest
- −$5,596
- − Property taxes
- −$709
- − Insurance
- −$500
- − Repairs & maintenance
- −$912
- − Management
- −$912
- − Depreciation
- −$2,906
- Taxable loss
- −$136
- Est. tax savings @ 24.0%
- +$33
- After-tax cash flow
- $1,542/yr
For passive investors: Depreciation is non-cash, so a rental often shows a tax loss while cash-flowing — sheltering income. Rental losses are passive: they offset passive income freely, and up to $25,000/yr can offset ordinary (W-2) income if you actively participate and your MAGI is under $100k (phasing out to $0 by $150k); unused losses carry forward. On sale, claimed depreciation is recaptured at up to 25%, and gains may owe capital-gains tax (a 1031 exchange can defer both). Figures are a year-1 estimate at your 24.0% rate — not tax advice; consult a CPA.
Schools (NCES district)
- District
- Wilburton
- NCES district ID
- 4032790
- Math proficiency
- 25% ▼ -10.00%
- Reading proficiency
- 22% ▼ -11.00%
- Median HH income
- $38,345
- Composite
- 19.72/100
- National rank
- #8718
- State rank
- #136 of 270 in OK
Livability — Wilburton
- Score
- 60/100
- State rank
- #351
- US rank
- #19035
Category grades
Schools grade is shown separately in the Schools card above.
Census & demographics
- Census place
- Wilburton, OK
- Population (ZIP)
- 5,721
Population outlook (Latimer County) Hauer SSP2
- Today (2025)
- 9,565 people
- By 2030
- 9,029 · -5.6%
- By 2040
- 8,084 · -15.5%
- By 2050
- 7,283 · -23.9%
- By 2075
- 5,893 · -38.4%
- By 2100
- 4,944 · -48.3%
Race, ethnicity, and origin ACS 2023
- Neighborhood character
- Diverse neighborhood (Simpson 0.62)
- Race & ethnicity
- White 61% Native American 24% Two or more races 10% Hispanic / Latino 5% Black 1%
- Common ancestry
- Italian 2% Lithuanian 1% Iranian 1%
- Foreign-born
- 1% · Canada
- Languages at home
- 97% English-only · Spanish 2%
Political lean MEDSL · Latimer
- 2024 margin
- Solid R (+65.6) · D 16.7% · R 82.3% · Other 1.0%
- 2008→2024 swing
- -28.5pp toward R · 2008: -37.1pp · 2024: -65.6pp
- All cycles
- 2024: R+65.6 2020: R+63.0 2016: R+56.7 2012: R+38.3 2008: R+37.1
Not yet ingested
- Civics
- —
Market trends
- HPI YoY
- ▲ 0.41%
- Current HPI
- 176.1285
- Rent YoY
- —
- Metro
- —
- State GDP YoY
- ▲ 1.55%
- F500 in state
- 6
Industry mix (Fortune 500 HQ in OK)
| Industry | F500 HQs | Revenue |
|---|---|---|
| Energy | 3 | $48B |
|
||
Price history
+122.0% since first listed8 events — show timeline
- 2026-05-19 Listed $99,900 MLS Technology, Inc.
- 2025-09-16 Listing Removed — MLS Technology, Inc.
- 2025-07-01 Listed $79,000 MLS Technology, Inc.
- 2017-11-30 Sold (Public Records) $72,000 Public Records
- 2017-11-29 Sold (MLS) $72,000 MLS Technology, Inc.
- 2017-09-13 Sold (Public Records) $170,000 Public Records
- 2017-06-22 Listed $79,000 MLS Technology, Inc.
- 2001-02-09 Sold (Public Records) $45,000 Public Records
Property tax history
+5.0%/yrLatest (2025): $709 · -3.4% YoY. Source: county tax records.
Cash-flow waterfall
monthlySold comps — $/sqft
last 12 mo · ≤1 miLoading sold comps…