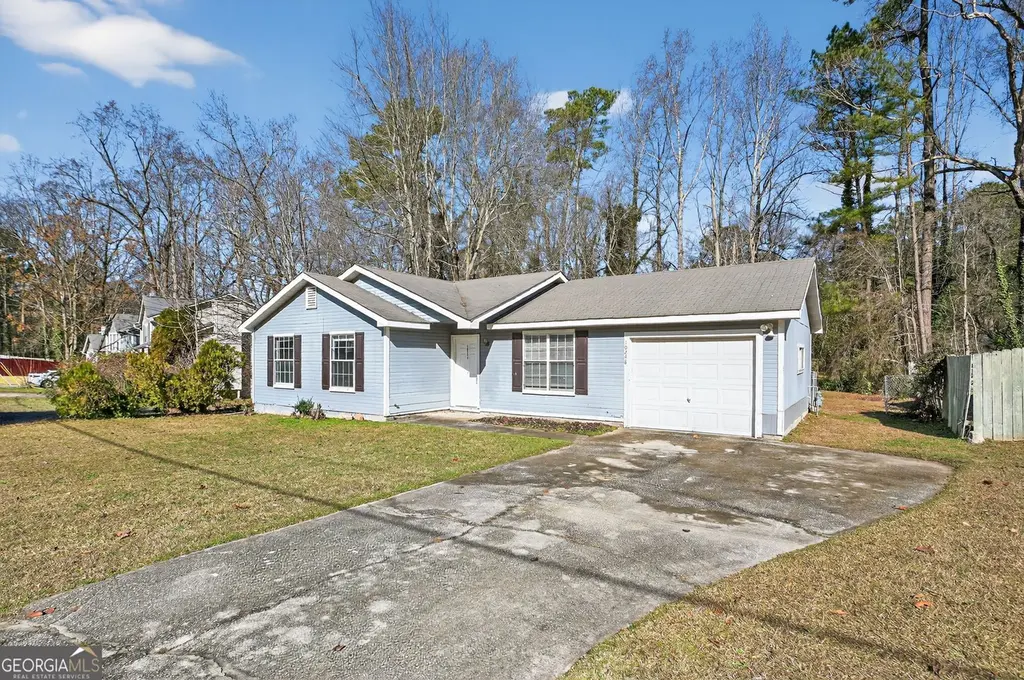
10248 Briarbay Loop · Irondale, GA
Flood risk 1/10 · Minimal
- FEMA flood zone
- X (unshaded)
- Chance of flooding over 30 yrs
- 0.0%
- Est. flood insurance / yr
- $507 – $1,088
Fire risk 1/10 · Minimal
- Est. fire insurance / yr
- $963 – $1,789
Heat risk 6/10 · Moderate
- Hot days now (above 105°F)
- 7 days/yr
- Hot days in 30 yrs
- 18 days/yr
Wind risk 6/10 · Moderate
- Chance of severe wind over 30 yrs
- 27.0%
Air-quality risk 4/10 · Minor
- Unhealthy air days now
- 5 days/yr
- Unhealthy air days in 30 yrs
- 6 days/yr
Risk factors via First Street. Map © Google.
Why this score? — see what drove the D grade
The composite is a weighted blend of 9 inputs, each scored 0–100. Each bar is that input's sub-score; the figure is the points it added to the 100-point composite (weight × sub-score).
- Cash flow +13.7/30.0
- ARV discount +8.9/15.0
- DSCR +4.1/10.0
- 1% rule +3.6/10.0
- Rent growth +3.0/5.0
- Livability +2.9/5.0
- Condition / age +2.5/5.0
- Schools +1.3/10.0
- Appreciation +0.0/10.0
$209,900
🖨 Deal sheet 📄 Offer letter ✓ Due diligence
Listing remarks MLS
Welcome to 10248 Briarbay Loop in Jonesboro, a comfortable and well-laid-out home featuring 3 bedrooms and 2 full baths. The primary bedroom includes a walk-in closet, offering added storage and convenience. Located in an established neighborhood with easy access to shopping, dining, schools, and major roadways, this home is ideal for everyday living or as an investment opportunity.
Key facts
- Walk-in closet
- 0.29 acre lot
- Garage
Tags
Neighborhood map
What this means for you Summary
Snapshot
- This is a 3-bed/2.0-bath single-family listed at $210k.
Deal economics
- At list price, monthly cash flow is $15 ($184/yr) — positive.
- The deal already cash-flows at list — no discount required.
- To meet the 1% rule (rent ≥ 1% of price), the offer needs to be $180k (14.3% below list).
- Recommended offer: $180k (14.3% below list) — sets the bar for 1% rule.
- Cap rate 6.4% vs local median 5.1% in Irondale — meaningfully above typical; check what's discounted (condition, days-on-market, listing class) to confirm the premium yield is real.
Location & tenants
- Location reads 57/100 on livability (#466 in GA) — a working-class tenant base; expect higher turnover. Strengths: cost of living A+, housing A+; Watch: crime D+, schools F, amenities F.
- Clayton County (suburban): math 11% / reading 20% proficiency, ranked #155 of 174 in GA (top 89%) — low school quality limits family demand, transient renter base, plan for 1-2y turnover; 78% free/reduced lunch — lower-income household profile, screen leases tightly.
- Market conditions: Rents rising (+2.1%/yr); 251 active listings in the ZIP; 35 comparable units currently listed for rent nearby; rentals at typical pace (median 24d on market — plan ~3-4 weeks tenant-placement turnaround); 49% of comp listings sitting > 30 days — soft ceiling on asking rent; 865 units permitted in Clayton County in 2024 (448 in 5+ unit buildings).
- This rent runs 35% of the median local income ($62k/yr) — at the standard rent-burdened threshold; future hikes will face affordability resistance.
Forward outlook
- Local home prices are declining (-3.0%/yr); year-one equity from $1k of loan paydown is wiped out by about $6k of value loss. Plan a longer hold.
- Clayton County population projected at +29% by 2050 — long-run rental-demand tailwind backs the buy-and-hold thesis.
Negotiation context
- It's been on market 155 days — a 12% lower offer ($185k) is reasonable based on typical stale-listing flexibility.
- 5 sale attempts since 13y ago with the ask held roughly flat each time — persistent listings suggest the price (not the market) is what's stuck; bring a comps-based counter.
Risks & watch-outs
- Climate carrying-cost: major wind risk, 27% chance of damaging wind over 30y; extreme-heat days projected 7→18/yr by 2055 (HVAC capex compounding) — expect insurance premiums to compound above CPI over the hold.
Questions for the listing agent
- It's been on market 155 days. Have you received any prior offers? Is the seller open to a 14% concession, seller financing, or rate buy-down credit?
- Why hasn't it sold? Are there any deal-killer items the seller is aware of (foundation, flood, title, zoning, code violations)?
- Is there a deadline driving the sale (1031 exchange, divorce, estate, relocation)? That informs how much negotiation room exists.
- Schools are F-rated, which usually means shorter tenancies and higher turnover. Who's the typical renter profile here, and what's been the actual vacancy rate?
- Crime grade is D in this area — have there been break-ins, vandalism, or insurance claims at this property in the last 3 years? What carrier currently insures it and at what premium?
- The area grade is low — what's the realistic commute time and amenity access for the typical tenant pool here? Any planned neighborhood developments (good or bad) we should know about?
- What's the average days-on-market for RENTAL listings here right now (not sales)? A rising rental-DOM trend means longer vacancies and softer asking-rent achievability than the comps imply.
- What's the recent tenant-quality profile in this submarket — average credit score on applications, eviction rate, late-payment / NSF rate, and stable-employment percentage? A property-management company in the area should have these aggregated.
- How much new for-sale + rental construction is in the pipeline within 1–3 miles? Heavy new supply typically softens prices + rents 12–24 months out; constrained supply supports both.
Investment metrics
- 1% rule
- 0.86% ✗
- Cap rate
- 6.38%
- Cash-on-cash
- 0.31%
- DSCR
- 1.01
- GRM
- 9.7
CMA / ARV
- ARV (median comp)
- $216,876
- List price
- $209,900
- Delta
- -3.22%
- Verdict
- FAIR
- Comps
- 20 within 1.0 mi
Show comp detail 12 sales within ~0.75 mi
| Address | Dist | Beds/Ba | Sqft | Sold | Price | $/sf | Match |
|---|---|---|---|---|---|---|---|
| 10330 Wisteria Ln | 0.13mi | 3/2.0 | 1,065 (0%) | 13mo | $240,000 | $225 | 83 |
| 1375 Labelle St | 0.14mi | 3/2.0 | 1,100 (+3%) | 8mo | $209,000 | $190 | 81 |
| 10331 Wrens Dr | 0.26mi | 3/2.0 | 1,072 (+1%) | 13mo | $239,900 | $224 | 76 |
| 1320 Labelle St | 0.29mi | 3/1.5 | 1,075 (+1%) | 13mo | $165,000 | $153 | 72 |
| 1494 Iron Gate Blvd | 0.32mi | 3/1.5 | 1,107 (+4%) | 6mo | $150,000 | $136 | 71 |
| 1341 Wrens Ct | 0.22mi | 3/2.0 | 1,101 (+3%) | 16mo | $229,000 | $208 | 71 |
| 10173 Brass Ring Rd | 0.39mi | 3/2.0 | 1,092 (+2%) | 11mo | $190,000 | $174 | 68 |
| 10452 Candlelight Rd | 0.45mi | 3/2.0 | 1,172 (+10%) | 14mo | $219,000 | $187 | 51 |
| 10190 Hamilton Glen Gln | 0.47mi | 3/2.0 | 1,200 (+13%) | 8mo | $225,000 | $188 | 50 |
| 10307 Fairhaven Rd | 0.49mi | 3/2.0 | 1,154 (+8%) | 19mo | $210,000 | $182 | 47 |
| 10281 Fairhaven Rd | 0.48mi | 3/2.0 | 1,176 (+10%) | 20mo | $225,000 | $191 | 43 |
| 1100 Walnut Creek Ln | 0.63mi | 3/2.0 | 1,176 (+10%) | 17mo | $210,000 | $179 | 39 |
Match score weights: distance 35% · size 25% · config 20% · recency 20%. Top-matched comps best support the ARV.
Projected returns pro-forma
-3.0% appreciation · 2.06% rent growth · sell at horizon
- IRR
- -16.8%
- Equity multiple
- 0.41×
- Total profit
- $-34,721
- Equity at exit
- $31,297
- IRR
- -10.4%
- Equity multiple
- 0.39×
- Total profit
- $-35,764
- Equity at exit
- $18,148
Cash invested: $58,772 (down + closing). Projections, not guarantees.
Landlord ↔ Tenant lean methodology
- Overall (STATE)
- 90 Strongly Landlord-Friendly
- State Georgia
- 90 Strongly Landlord-Friendly · R+3
- County
- — inherits STATE
- City
- — inherits STATE
ZIP-level market 30238
- Home prices YoY
- -33.3%
- Rents YoY
- 2.1%
- Active inventory
- 251
- Price-to-rent
- 9.7×
Monthly cashflow live
- Estimated rent
- $1,799 high interval (Pro) →
- Mortgage (P&I)
- −$1,101
- Tax from tax record
- −$217 /mo · $2,609/yr
- Insurance
- −$87
- HOA
- −$0
- Vacancy / Maint / Mgmt
- −$378
- Net cashflow
- $15
Break-even live
UW: 25.0% down · 7.5% · 30yr · 1.5% tax · 5.0% vac · 8.0% maint · 8.0% mgmt
Financing live
Cash to close
- Down payment
- $52,475
- Closing costs
- $6,297
- Reserves months
- —
- Total cash needed
- —
Loan-product check · same deal, 3 products live
Conventional
25% down · 7.5% · 30yr
- Down + closing
- —
- Monthly P&I
- —
- Monthly cashflow
- —
- DSCR
- —
- Eligible?
- —
Personal DTI + credit; lowest rate.
DSCR
20% down · 8.5% · 30yr
- Down + closing
- —
- Monthly P&I
- —
- Monthly cashflow
- —
- DSCR
- —
- Eligible?
- —
No personal income docs; deal must DSCR.
Hard money
10% down · 12.0% · 12mo
- Down + closing
- —
- Monthly P&I
- —
- Monthly cashflow
- —
- DSCR
- —
- Eligible?
- —
Short-term bridge; refi at stabilization.
Rent comps 35 comps
| Address | Beds | Baths | Sqft | Rent | $/sqft | DOM | Units | Dist |
|---|---|---|---|---|---|---|---|---|
| 10299 Wisteria Ln Jonesboro, GA | 3.0 | 2.0 | 1257 | $1,770 | $1.41 | 43d | 1 | 0.05mi |
| 10346 Wisteria Ln Jonesboro, GA | 3.0 | 2.0 | 1042 | $1,595 | $1.53 | 12d | 1 | 0.13mi |
| 10357 Briarbay Dr Jonesboro, GA | 3.0 | 2.0 | 1180 | $1,610 | $1.36 | 1d | 1 | 0.16mi |
| 1834 Old Dogwood Jonesboro, GA | 3.0 | 2.5 | 1454 | $1,730 | $1.19 | 43d | 1 | 0.21mi |
| 1830 Old Dogwood Jonesboro, GA | 3.0 | 2.5 | 1454 | $1,730 | $1.19 | 43d | 1 | 0.21mi |
| 1433 Iron Gate Blvd Jonesboro, GA | 3.0 | 1.5 | 1075 | $1,475 | $1.37 | 12d | 1 | 0.21mi |
| 1545 Iris Walk Jonesboro, GA | 3.0 | 3.0 | 1453 | $1,800 | $1.24 | 24d | 1 | 0.22mi |
| 1485 Bola Ct Jonesboro, GA | 4.0 | 2.0 | 1300 | $1,780 | $1.37 | 5d | 1 | 0.22mi |
| 1814 Old Dogwood Jonesboro, GA | 3.0 | 2.5 | 1454 | $1,730 | $1.19 | 43d | 1 | 0.24mi |
| 1795 Old Dogwood Jonesboro, GA | 3.0 | 3.0 | 1454 | $1,730 | $1.19 | 43d | 1 | 0.26mi |
| 1798 Old Dogwood Jonesboro, GA | 3.0 | 3.0 | 1454 | $1,730 | $1.19 | 24d | 1 | 0.27mi |
| 1334 Labelle St Jonesboro, GA | 4.0 | 2.0 | 1352 | $1,521 | $1.12 | 5d | 1 | 0.27mi |
| 1786 Old Dogwood Jonesboro, GA | 3.0 | 2.5 | 1454 | $1,730 | $1.19 | 43d | 1 | 0.29mi |
| 1779 Old Dogwood Jonesboro, GA | 3.0 | 2.5 | 1454 | $1,730 | $1.19 | 43d | 1 | 0.29mi |
| 10375 Larrack Trce Jonesboro, GA | 3.0 | 2.0 | 1340 | $1,800 | $1.34 | 17d | 1 | 0.30mi |
| 10091 Silent Trl Jonesboro, GA | 3.0 | 1.5 | 1456 | $1,395 | $0.96 | 24d | 1 | 0.31mi |
| 1277 Iron Gate Blvd Jonesboro, GA | 3.0 | 2.0 | 1120 | $1,499 | $1.34 | 1d | 1 | 0.32mi |
| 1478 Carriage Ln Jonesboro, GA | 3.0 | 2.0 | 1436 | $1,675 | $1.17 | 21d | 1 | 0.33mi |
| 1260 Iron Gate Blvd Jonesboro, GA | 3.0 | 2.0 | 1460 | $1,745 | $1.20 | 19d | 1 | 0.35mi |
| 10485 Ace Ct Jonesboro, GA | 3.0 | 2.0 | 1288 | $1,611 | $1.25 | 43d | 1 | 0.53mi |
| 1556 Wren Rd Jonesboro, GA | 3.0 | 2.0 | 1388 | $1,715 | $1.24 | 43d | 1 | 0.55mi |
| 1174 Walnut Creek Ln Jonesboro, GA | 3.0 | 2.0 | 1218 | $1,861 | $1.53 | 43d | 1 | 0.59mi |
| 1139 Commons Ct Jonesboro, GA | 3.0 | 2.0 | 1421 | $1,795 | $1.26 | 20d | 1 | 0.63mi |
| 1546 Plover Rd Jonesboro, GA | 4.0 | 3.0 | 1040 | $1,730 | $1.66 | 43d | 1 | 0.66mi |
| 1096 Bonita Cir Jonesboro, GA | 3.0 | 2.0 | 1442 | $1,700 | $1.18 | 24d | 1 | 0.67mi |
| 1108 Sunday Ln Jonesboro, GA | 3.0 | 2.0 | 1137 | $1,625 | $1.43 | 43d | 1 | 0.68mi |
| 1496 Paladin Ct Hampton, GA | 4.0 | 2.5 | 1116 | $2,045 | $1.83 | 19d | 1 | 0.69mi |
| 10624 Woodcock St Jonesboro, GA | 4.0 | 2.0 | 1171 | $1,670 | $1.43 | 21d | 1 | 0.82mi |
| 10348 Commons Xing Jonesboro, GA | 3.0 | 2.0 | 1372 | $2,500 | $1.82 | 16d | 1 | 0.82mi |
| 1117 Village Crk Jonesboro, GA | 3.0 | 2.5 | 1330 | $1,815 | $1.36 | 43d | 1 | 0.85mi |
| 1374 Misty Ridge Ct Hampton, GA | 3.0 | 2.0 | 1250 | $1,775 | $1.42 | 43d | 1 | 1.02mi |
| 10445 Ivygate Ave Jonesboro, GA | 3.0 | 2.0 | 1400 | $1,720 | $1.23 | 43d | 1 | 1.20mi |
| 10903 Thrasher Rd Hampton, GA | 3.0 | 2.0 | 1412 | $1,725 | $1.22 | 21d | 1 | 1.21mi |
| 10784 Knotty Pine Pl Hampton, GA | 3.0 | 2.0 | 1329 | $1,795 | $1.35 | 43d | 1 | 1.32mi |
| 1652 Thorn Ridge Trl Hampton, GA | 3.0 | 2.0 | 1360 | $1,960 | $1.44 | 43d | 1 | 1.34mi |
Listing history 36 events
-
2026-06-18days on market $209,900 Active 155 DOM
-
2026-06-17days on market $209,900 Active 154 DOM
-
2026-06-16days on market $209,900 Active 153 DOM
-
2026-06-15days on market $209,900 Active 152 DOM
-
2026-06-13days on market $209,900 Active 150 DOM
-
2026-06-09days on market $209,900 Active 146 DOM
-
2026-06-08days on market $209,900 Active 145 DOM
-
2026-06-07days on market $209,900 Active 144 DOM
-
2026-06-04days on market $209,900 Active 141 DOM
-
2026-06-03days on market $209,900 Active 140 DOM
-
2026-06-02days on market $209,900 Active 139 DOM
-
2026-06-01days on market $209,900 Active 138 DOM
-
2026-05-31days on market $209,900 Active 137 DOM
-
2026-02-24price $209,900 385-char remark
Show marketing remark (385 chars)
Welcome to 10248 Briarbay Loop in Jonesboro, a comfortable and well-laid-out home featuring 3 bedrooms and 2 full baths. The primary bedroom includes a walk-in closet, offering added storage and convenience. Located in an established neighborhood with easy access to shopping, dining, schools, and major roadways, this home is ideal for everyday living or as an investment opportunity.
-
2026-01-31price $214,900 385-char remark
Show marketing remark (385 chars)
Welcome to 10248 Briarbay Loop in Jonesboro, a comfortable and well-laid-out home featuring 3 bedrooms and 2 full baths. The primary bedroom includes a walk-in closet, offering added storage and convenience. Located in an established neighborhood with easy access to shopping, dining, schools, and major roadways, this home is ideal for everyday living or as an investment opportunity.
-
2026-01-14$219,900 New 385-char remark
Show marketing remark (385 chars)
Welcome to 10248 Briarbay Loop in Jonesboro, a comfortable and well-laid-out home featuring 3 bedrooms and 2 full baths. The primary bedroom includes a walk-in closet, offering added storage and convenience. Located in an established neighborhood with easy access to shopping, dining, schools, and major roadways, this home is ideal for everyday living or as an investment opportunity.
-
2026-01-05historical
-
2025-12-04price $219,900
-
2025-11-17price $224,900
-
2025-10-02price $229,900
-
2025-09-23price $234,900
-
2025-09-05$239,900 New
-
2022-02-16soldstatus $4,857,881
-
2017-07-31soldstatus $2,566,600
-
2016-11-01historical
-
2016-10-18price $79,500
-
2016-10-13price $80,600
-
2016-10-03status Back on Market
-
2016-10-01historical
-
2016-09-07$85,000 New
-
2014-05-01historical
-
2013-12-07price $81,488 Increased
-
2013-10-28$74,080 New
-
2000-04-26soldstatus $82,500
-
1991-06-10soldstatus $59,500
-
1987-09-30soldstatus $59,500
ⓘ Source: listings_history table (triggers on properties + properties_extension) + one-shot
backfill from property_details.listing_events for pre-trigger history.
Tax reassessment forecast GA · Resets to sale price
- Current annual tax
- $2,609 · $217/mo
- Projected year-2 tax
- $2,609 · $217/mo
- Expected delta
- $0/yr ($0/mo · 0.0%)
ⓘ Screening estimate from a state-policy table — verify with the county assessor before closing.
Climate risk First Street
- Flood 1/10 Low FEMA zone X (unshaded) · 0% chance over 30 yrs
- Wildfire 1/10 Low
- Heat 6/10 Major 7 d/yr ≥105°F today · 18 d/yr by 30 yrs out
- Wind 6/10 Major 27% chance of damaging wind over 30 yrs
- Air quality 4/10 Moderate 5 unhealthy d/yr today · 6 by 30 yrs out
Nearby sold comps map
Loading sold comps map…
Walkable amenities ~0.75 mi
Loading nearby amenities…
Taxation est. · year 1
- Rental income
- $21,584
- − Mortgage interest
- −$11,758
- − Property taxes
- −$2,609
- − Insurance
- −$1,050
- − Repairs & maintenance
- −$1,727
- − Management
- −$1,727
- − Depreciation
- −$6,106
- Taxable loss
- −$3,392
- Est. tax savings @ 24.0%
- +$814
- After-tax cash flow
- $998/yr
For passive investors: Depreciation is non-cash, so a rental often shows a tax loss while cash-flowing — sheltering income. Rental losses are passive: they offset passive income freely, and up to $25,000/yr can offset ordinary (W-2) income if you actively participate and your MAGI is under $100k (phasing out to $0 by $150k); unused losses carry forward. On sale, claimed depreciation is recaptured at up to 25%, and gains may owe capital-gains tax (a 1031 exchange can defer both). Figures are a year-1 estimate at your 24.0% rate — not tax advice; consult a CPA.
Schools (NCES district)
- District
- Clayton County
- NCES district ID
- 1301230
- Math proficiency
- 11% ▼ -13.00%
- Reading proficiency
- 20% ▼ -9.00%
- Median HH income
- $42,266
- Composite
- 13.41/100
- National rank
- #9527
- State rank
- #155 of 174 in GA
Livability — Irondale
- Score
- 57/100
- State rank
- #466
- US rank
- #22025
Category grades
Schools grade is shown separately in the Schools card above.
Census & demographics
- Census place
- Irondale, GA
- County
- Clayton County · 230,153 people
- Metro
- Atlanta-Sandy Springs-Alpharetta, GA
- Population (ZIP)
- 43,191
- Household income
- $62,185
- Rent vs Own
- Severe rent burden
- 1992.0
Population outlook (Clayton County) Hauer SSP2
- Today (2025)
- 310,777 people
- By 2030
- 329,762 · +6.1%
- By 2040
- 368,052 · +18.4%
- By 2050
- 401,196 · +29.1%
- By 2075
- 472,488 · +52.0%
- By 2100
- 500,446 · +61.0%
Race, ethnicity, and origin ACS 2023
- Neighborhood character
- Predominantly Black (71%)
- Race & ethnicity
- Black 71% Hispanic / Latino 17% White 7% Two or more races 7%
- Hispanic origin (detail)
- Mexican 13% Puerto Rican 2%
- Foreign-born
- 11% · Canada, United Kingdom
- Languages at home
- 83% English-only · Spanish 14% French/Haitian/Cajun 1%
Political lean MEDSL · Clayton
- 2024 margin
- Solid D (+69.2) · D 84.3% · R 15.1%
- 2008→2024 swing
- +2.8pp toward D · 2008: 66.4pp · 2024: 69.2pp
- All cycles
- 2024: D+69.2 2020: D+70.9 2016: D+71.9 2012: D+70.1 2008: D+66.4
Not yet ingested
- Civics
- —
Market trends
- HPI YoY
- ▼ -105.48%
- Current HPI
- 211.6309
- Rent YoY
- ▲ 2.06%
- Metro
- Atlanta-Sandy Springs-Alpharetta, GA
- State GDP YoY
- ▲ 2.66%
- F500 in state
- 28
Industry mix (Fortune 500 HQ in GA)
| Industry | F500 HQs | Revenue |
|---|---|---|
| Paper / Packaging | 2 | $29B |
|
||
| Retail | 1 | $160B |
|
||
| Transportation / Logistics | 1 | $91B |
|
||
| Airlines | 1 | $62B |
|
||
| Consumer Goods | 1 | $47B |
|
||
| Utilities | 1 | $25B |
|
||
Price history
+252.8% since first listed23 events — show timeline
- 2026-02-24 Price Changed $209,900 GAMLS
- 2026-01-31 Price Changed $214,900 GAMLS
- 2026-01-14 Listed $219,900 GAMLS
- 2026-01-05 Listing Removed — GAMLS
- 2025-12-04 Price Changed $219,900 GAMLS
- 2025-11-17 Price Changed $224,900 GAMLS
- 2025-10-02 Price Changed $229,900 GAMLS
- 2025-09-23 Price Changed $234,900 GAMLS
- 2025-09-05 Listed $239,900 GAMLS
- 2022-02-16 Sold (Public Records) $4,857,881 Public Records
- 2017-07-31 Sold (Public Records) $2,566,600 Public Records
- 2016-11-01 Listing Removed — GAMLS
- 2016-10-18 Price Changed $79,500 GAMLS
- 2016-10-13 Price Changed $80,600 GAMLS
- 2016-10-03 Relisted — GAMLS
- 2016-10-01 Listing Removed — GAMLS
- 2016-09-07 Listed $85,000 GAMLS
- 2014-05-01 Listing Removed — GAMLS
- 2013-12-07 Price Changed $81,488 GAMLS
- 2013-10-28 Listed $74,080 GAMLS
- 2000-04-26 Sold (Public Records) $82,500 Public Records
- 1991-06-10 Sold (Public Records) $59,500 Public Records
- 1987-09-30 Sold (Public Records) $59,500 Public Records
Property tax history
+8.6%/yrLatest (2025): $2,609 · -1.8% YoY. Source: county tax records.
Cash-flow waterfall
monthlySold comps — $/sqft
last 12 mo · ≤1 miLoading sold comps…