 🏗️ New Construction
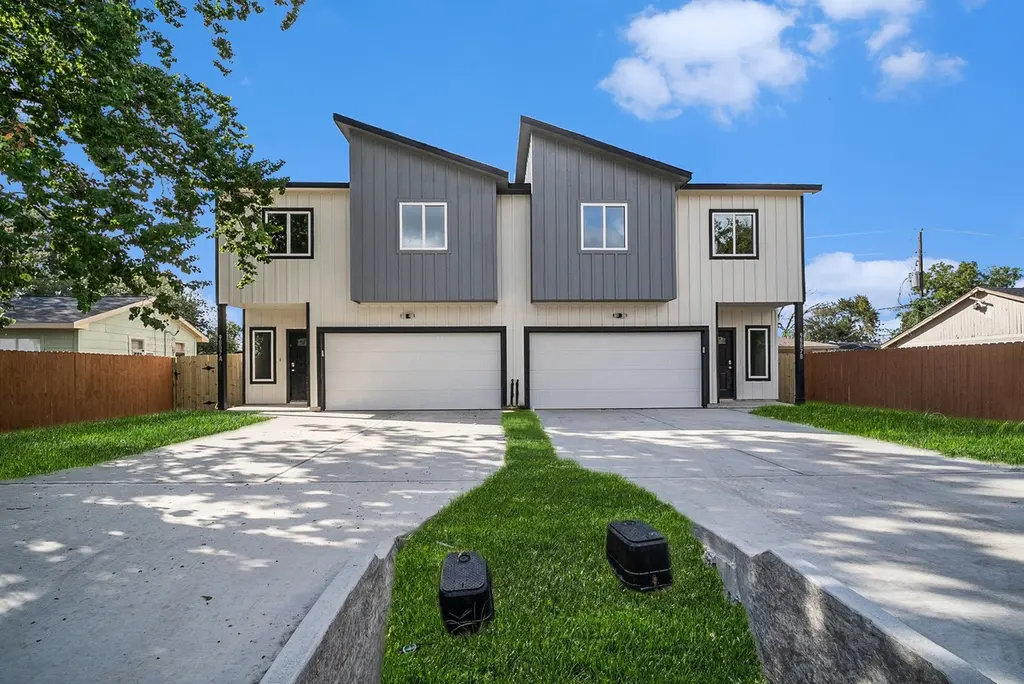
9807 Bamboo Unit A · Houston, TX
Flood risk 4/10 · Minor
- FEMA flood zone
- X (unshaded)
- Chance of flooding over 30 yrs
- 0.22%
- Est. flood insurance / yr
- $507 – $1,088
Fire risk 1/10 · Minimal
- Est. fire insurance / yr
- $1,222 – $2,270
Heat risk 9/10 · Severe
- Hot days now (above 109°F)
- 7 days/yr
- Hot days in 30 yrs
- 23 days/yr
Wind risk 9/10 · Severe
- Chance of severe wind over 30 yrs
- 99.0%
Air-quality risk 3/10 · Minor
- Unhealthy air days now
- 3 days/yr
- Unhealthy air days in 30 yrs
- 3 days/yr
Risk factors via First Street. Map © Google.
Why this score? — see what drove the F grade
The composite is a weighted blend of 9 inputs, each scored 0–100. Each bar is that input's sub-score; the figure is the points it added to the 100-point composite (weight × sub-score).
- ARV discount +7.5/15.0
- Cash flow +5.9/30.0
- Schools +4.4/10.0
- Appreciation +4.3/10.0
- Condition / age +4.0/5.0
- Livability +3.7/5.0
- Rent growth +2.6/5.0
- 1% rule +1.3/10.0
- DSCR +0.3/10.0
$349,900
🖨 Deal sheet (PDF) 📄 Offer letter ✓ Due diligence
Listing remarks
Each unit is $349,900K, Duplex for $699,900K. Welcome to this beautifully designed new construction duplex, offering a perfect blend of comfort, style, and functionality. Whether you're looking to live in one unit and rent the other or seeking a smart investment property, this duplex offers flexibility and opportunity in one package. Each unit features an open-concept floor plan with woodlook tile flooring, recessed lighting and abundant natural light. The kitchen showcases sleek white cabinetry, subway tile backsplash, quartz countertops, and a spacious island with bar seating, ideal for everyday living and entertaining. The living area flows seamlessly into the dining space, creating a br
Key facts
- Recessed lighting
- Listed 16 days
Tags
Property features AI
Exterior
- Security: Fire alarm
- Utilities: Cable available; Electricity available; Natural gas available; Water available
- Home design: Residential income property; New construction
- Construction: Composition roof; Built by private builder
- Exterior features: Cleared lot
Interior
- Kitchen: Dishwasher; Disposal
- Bedrooms: 4 bedrooms
- Bathrooms: 2 full bathrooms
- Heating & cooling: Central heating (gas); Central air conditioning (gas)
- Interior features: Satellite dish; Dishwasher; Disposal
- Laundry & utility: Common area laundry
Neighborhood map
What this means for you Summary
Snapshot
- This is a 4-bed/2.0-bath condo listed at $350k. Condition is rated good.
Deal economics
- At list price, monthly cash flow is $-748 ($-9k/yr) — negative.
- To cash-flow at today's rent, offer at most $272k (22.2% below list).
- To meet the 1% rule (rent ≥ 1% of price), the offer needs to be $238k (31.9% below list).
- Recommended offer: $238k (31.9% below list) — sets the bar for 1% rule.
- Cap rate 3.9% vs local median 3.2% in Houston — meaningfully above typical; check what's discounted (condition, days-on-market, listing class) to confirm the premium yield is real.
Location & tenants
- Location reads 74/100 on livability (#184 in TX, #4,771 nationally) — a middle-class / working-renter tenant base. Strengths: amenities A+, cost of living A+, housing A+; Watch: crime F.
- Cypress-Fairbanks ISD (suburban): math 45% / reading 52% proficiency, ranked #161 of 826 in TX (top 20%) — families likely to look elsewhere, expect single-tenant / working-renter base with shorter leases.
- Zoned schools: Kirk El (math 25% / reading 32%, grade F, #2,706 of 4,322 statewide, top 63%, 852 students, 79% FRL); Truitt Middle (math 34% / reading 41%, grade F, #736 of 1,662 statewide, top 45%, 1,419 students, 76% FRL); Cypress Ridge H S (math 45% / reading 53%, grade D, #553 of 1,632 statewide, top 34%, 2,921 students, 76% FRL) — zoned schools average 77% FRL vs 43% district-wide (34 pts higher); higher-poverty schools than district average — tighter screening recommended.
- Market conditions: Rents flat; 177 active listings in the ZIP; 40 comparable units currently listed for rent nearby; rentals at typical pace (median 26d on market — plan ~3-4 weeks tenant-placement turnaround); solid renter incomes; 29,883 units permitted in Harris County in 2024 (8,621 in 5+ unit buildings).
- This rent runs 37% of the median local income ($77k/yr) — at the standard rent-burdened threshold; future hikes will face affordability resistance.
Forward outlook
- Local home prices are declining (-1.5%/yr); year-one equity from $3k of loan paydown is wiped out by about $6k of value loss. Plan a longer hold.
- Harris County population projected at +47% by 2050 — long-run rental-demand tailwind backs the buy-and-hold thesis.
Negotiation context
- It's been on market 16 days — a 2% lower offer ($345k) is reasonable based on typical stale-listing flexibility.
- 2 sale attempts with the ask held roughly flat each time — persistent listings suggest the price (not the market) is what's stuck; bring a comps-based counter.
Risks & watch-outs
- Climate carrying-cost: severe wind risk, 99% chance of damaging wind over 30y; extreme-heat days projected 7→23/yr by 2055 (HVAC capex compounding) — expect insurance premiums to compound above CPI over the hold.
Questions for the listing agent
- What do current leases actually rent for vs. the listed asking? Can we see a recent rent roll and the last 12 months of T-12 income?
- Any open or pending special assessments — roof, HVAC, plumbing, elevator, façade? What's the per-unit balance and payoff schedule, and is the seller paying it off at close or rolling it to the buyer?
- Is there a deadline driving the sale (1031 exchange, divorce, estate, relocation)? That informs how much negotiation room exists.
- Schools are D-rated, which usually means shorter tenancies and higher turnover. Who's the typical renter profile here, and what's been the actual vacancy rate?
- Crime grade is F in this area — have there been break-ins, vandalism, or insurance claims at this property in the last 3 years? What carrier currently insures it and at what premium?
- The area grade is low — what's the realistic commute time and amenity access for the typical tenant pool here? Any planned neighborhood developments (good or bad) we should know about?
- What's the average days-on-market for RENTAL listings here right now (not sales)? A rising rental-DOM trend means longer vacancies and softer asking-rent achievability than the comps imply.
- What's the recent tenant-quality profile in this submarket — average credit score on applications, eviction rate, late-payment / NSF rate, and stable-employment percentage? A property-management company in the area should have these aggregated.
- How much new apartment / multifamily construction is in the pipeline within 1–3 miles? Heavy new supply (>2% of stock underway) typically softens rents 12–24 months out; light construction supports rent growth.
Investment metrics
- 1% rule
- 0.63% ✗
- Cap rate
- 3.93%
- Cash-on-cash
- -8.43%
- DSCR
- 0.63
- GRM
- 13.3
CMA / ARV
- ARV (median comp)
- $380,503
- List price
- $349,900
- Delta
- -8.04%
- Verdict
- FAIR
- Comps
- 10 within 1.0 mi
Projected returns pro-forma
-1.47% appreciation · 0.25% rent growth · sell at horizon
- IRR
- -21.5%
- Equity multiple
- 0.15×
- Total profit
- $-90,664
- Equity at exit
- $83,346
- IRR
- -18.4%
- Equity multiple
- -0.33×
- Total profit
- $-142,130
- Equity at exit
- $80,464
Cash invested: $106,541 (down + closing). Projections, not guarantees.
Landlord ↔ Tenant lean methodology
- Overall (STATE)
- 87 Strongly Landlord-Friendly
- State Texas
- 87 Strongly Landlord-Friendly · R+5
- County
- — inherits STATE
- City
- — inherits STATE
ZIP-level market 77041
- Home prices YoY
- -0.6%
- Rents YoY
- 0.2%
- Active inventory
- 177
- Price-to-rent
- 12.2×
Monthly cashflow live
- Estimated rent
- $2,382 high interval (Pro) →
- Mortgage (P&I)
- −$1,995
- Tax est. 1.5%
- −$476 /mo · $5,708/yr
- Insurance
- −$159
- HOA
- −$0
- Vacancy / Maint / Mgmt
- −$500
- Net cashflow
- $-748
Break-even live
Sensitivity live
| Price | -10% $-485 | -5% $-617 | +0% $-748 | +5% $-880 | +10% $-1,011 |
|---|---|---|---|---|---|
| Rent | -10% $-936 | -5% $-842 | +0% $-748 | +5% $-654 | +10% $-560 |
| Rate | -1.0pp $-556 | -0.5pp $-651 | base $-748 | +0.5pp $-847 | +1.0pp $-947 |
UW: 25.0% down · 7.5% · 30yr · 1.5% tax · 5.0% vac · 8.0% maint · 8.0% mgmt
Financing live
Cash to close
- Down payment
- $95,126
- Closing costs
- $11,415
- Reserves months
- —
- Total cash needed
- —
Loan-product check · same deal, 3 products live
Conventional
25% down · 7.5% · 30yr
- Down + closing
- —
- Monthly P&I
- —
- Monthly cashflow
- —
- DSCR
- —
- Eligible?
- —
Personal DTI + credit; lowest rate.
DSCR
20% down · 8.5% · 30yr
- Down + closing
- —
- Monthly P&I
- —
- Monthly cashflow
- —
- DSCR
- —
- Eligible?
- —
No personal income docs; deal must DSCR.
Hard money
10% down · 12.0% · 12mo
- Down + closing
- —
- Monthly P&I
- —
- Monthly cashflow
- —
- DSCR
- —
- Eligible?
- —
Short-term bridge; refi at stabilization.
Rent comps 40 comps
| Address | Beds | Baths | Sqft | Rent | $/sqft | DOM | Units | Dist |
|---|---|---|---|---|---|---|---|---|
| 9815 Bamboo Rd Houston, TX | 4.0 | 2.5 | — | $2,340 | — | 0d | 1 | 0.04mi |
| 9911 Porto Rico Rd Unit A Houston, TX | 5.0 | 2.0 | 1500 | $2,650 | $1.77 | 26d | 1 | 0.20mi |
| 9911 Porto Rico Rd Unit A Houston, TX | 4.0 | 2.5 | — | $2,300 | — | 4d | 1 | 0.20mi |
| 9911 Porto Rico Rd Unit A Houston, TX | 5.0 | 2.5 | — | $2,650 | — | 45d | 1 | 0.20mi |
| 9913 Porto Rico Rd Unit B Houston, TX | 5.0 | 2.5 | — | $2,400 | — | 14d | 1 | 0.21mi |
| 9946 Algiers Rd Houston, TX | 4.0 | 1.5 | — | $1,895 | — | 14d | 1 | 0.32mi |
| 10015 Porto Rico Rd Houston, TX | 3.0 | 2.0 | — | $1,800 | — | 45d | 1 | 0.38mi |
| 10021 Alfred Ln Houston, TX | 4.0 | 3.0 | 1970 | $3,000 | $1.52 | 45d | 1 | 0.58mi |
| 10021 Alfred Ln Unit B Houston, TX | 4.0 | 2.5 | — | $3,000 | — | 45d | 1 | 0.58mi |
| 4617 Talina Way Unit A Houston, TX | 3.0 | 2.0 | — | $1,600 | — | 26d | 1 | 0.89mi |
| 5039 E Pagewick Dr Houston, TX | 3.0 | 2.0 | — | $2,100 | — | 45d | 1 | 0.91mi |
| 5035 E Pagewick Dr Houston, TX | 3.0 | 2.5 | — | $2,500 | — | 1d | 1 | 0.91mi |
| 8303 Fawndale Ln Houston, TX | 3.0 | 2.0 | — | $2,150 | — | 26d | 1 | 1.01mi |
| 4923 Kentwalk Dr Houston, TX | 3.0 | 2.0 | — | $1,945 | — | 45d | 1 | 1.03mi |
| 4922 E Laureldale Dr Houston, TX | 4.0 | 2.0 | — | $2,500 | — | 6d | 1 | 1.09mi |
| 9826 Rugged Oaks Dr Houston, TX | 3.0 | 2.5 | 1942 | $2,250 | $1.16 | 26d | 1 | 1.10mi |
| 10323 Lone Brook Dr Houston, TX | 3.0 | 2.0 | — | $2,200 | — | 12d | 1 | 1.10mi |
| 10254 Valleywood Dr Houston, TX | 3.0 | 2.5 | — | $1,950 | — | 45d | 1 | 1.11mi |
| 9912 Storehouse Dr Houston, TX | 3.0 | 2.5 | — | $2,650 | — | 6d | 1 | 1.11mi |
| 4208 Peaceful Pines Ln Houston, TX | 3.0 | 2.5 | — | $2,600 | — | 45d | 1 | 1.12mi |
| 9811 Falling Fern Ln Houston, TX | 3.0 | 2.5 | 1942 | $2,400 | $1.24 | 0d | 1 | 1.13mi |
| 9813 Falling Fern Ln Houston, TX | 3.0 | 2.5 | 1650 | $2,295 | $1.39 | 26d | 1 | 1.13mi |
| 9945 Storehouse Dr Houston, TX | 3.0 | 2.5 | 2119 | $2,600 | $1.23 | 45d | 1 | 1.14mi |
| 4212 Lyons Fall Ln Houston, TX | 3.0 | 2.5 | — | $2,599 | — | 23d | 1 | 1.14mi |
| 4212 Lyons Fall Ln Houston, TX | 3.0 | 2.5 | — | $2,499 | — | 4d | 1 | 1.14mi |
| 10519 N Newpark Dr Houston, TX | 3.0 | 2.0 | — | $2,100 | — | 26d | 1 | 1.15mi |
| 4120 Split Ivy Dr Houston, TX | 3.0 | 2.5 | — | $3,100 | — | 6d | 1 | 1.16mi |
| 10010 Rustic Charm St Houston, TX | 3.0 | 2.5 | — | $2,800 | — | 0d | 1 | 1.16mi |
| 10323 Bridgeland Ln Houston, TX | 3.0 | 2.5 | — | $2,000 | — | 45d | 1 | 1.18mi |
| 10252 Cottage Field Rd Houston, TX | 3.0 | 2.5 | — | $1,800 | — | 26d | 1 | 1.18mi |
| 9541 Clanton St Houston, TX | 3.0 | 2.5 | — | $1,500 | — | 45d | 1 | 1.21mi |
| 8046 Ellinger Ln Houston, TX | 3.0 | 2.5 | — | $1,750 | — | 19d | 1 | 1.22mi |
| 9535 Clanton St Houston, TX | 3.0 | 2.5 | — | $1,600 | — | 45d | 1 | 1.22mi |
| 4109 Fig Grove St Houston, TX | 3.0 | 2.5 | — | $2,400 | — | 12d | 1 | 1.24mi |
| 10022 Cloud Mist Dr Houston, TX | 4.0 | 3.0 | — | $3,500 | — | 45d | 1 | 1.24mi |
| 8018 Grow Ln Houston, TX | 3.0 | 2.5 | 1770 | $2,050 | $1.16 | 26d | 1 | 1.29mi |
| 8018 Grow Ln Houston, TX | 3.0 | 2.5 | — | $1,875 | — | 4d | 1 | 1.29mi |
| 9639 Springview Ln Houston, TX | 4.0 | 2.0 | — | $2,900 | — | 45d | 1 | 1.30mi |
| 9614 Springmont Dr Unit 1042671P Houston, TX | 5.0 | 2.5 | 2174 | $14,296 | $6.58 | 23d | 1 | 1.32mi |
| 10615 Heatherford Dr Houston, TX | 4.0 | 2.0 | 2120 | $2,495 | $1.18 | 9d | 1 | 1.34mi |
HOA detail condo
- Monthly dues
- $0 · $0/yr
- Assessments
- None detected in remarks — confirm with the listing agent.
Listing history 18 events
-
2026-06-21days on market $349,900 Active 16 DOM
-
2026-06-18days on market $349,900 Active 13 DOM
-
2026-06-17days on market $349,900 Active 12 DOM
-
2026-06-16days on market $349,900 Active 11 DOM
-
2026-06-15days on market $349,900 Active 10 DOM
-
2026-06-13days on market $349,900 Active 8 DOM
-
2026-06-13days on market $349,900 Active 7 DOM
-
2026-06-09days on market $349,900 Active 4 DOM
-
2026-06-08days on market $349,900 Active 3 DOM
-
2026-06-07days on market $349,900 Active 2 DOM
-
2026-06-04pricedays on market $349,900 Active 252 DOM
-
2026-06-03days on market $375,000 Active 251 DOM
-
2026-06-02days on market $375,000 Active 250 DOM
-
2026-06-02days on market $375,000 Active 249 DOM
-
2026-05-31days on market $375,000 Active 248 DOM
-
2026-04-10price $375,000 994-char remark
-
2026-01-12price $390,000 994-char remark
-
2025-09-24$410,000 Active 994-char remark
ⓘ Source: listings_history table (triggers on properties + properties_extension) + one-shot
backfill from property_details.listing_events for pre-trigger history.
Climate risk First Street
- Flood 4/10 Moderate FEMA zone X (unshaded) · 22% chance over 30 yrs
- Wildfire 1/10 Low
- Heat 9/10 Extreme 7 d/yr ≥109°F today · 23 d/yr by 30 yrs out
- Wind 9/10 Extreme 99% chance of damaging wind over 30 yrs
- Air quality 3/10 Moderate 3 unhealthy d/yr today · 3 by 30 yrs out
Nearby sold comps map
Loading sold comps map…
Walkable amenities ~0.75 mi
Loading nearby amenities…
Taxation est. · year 1
- Rental income
- $28,580
- − Mortgage interest
- −$21,314
- − Property taxes
- −$5,708
- − Insurance
- −$1,903
- − Repairs & maintenance
- −$2,286
- − Management
- −$2,286
- − Depreciation
- −$11,069
- Taxable loss
- −$15,986
- Est. tax savings @ 24.0%
- +$3,837
- After-tax cash flow
- $-5,140/yr
For passive investors: Depreciation is non-cash, so a rental often shows a tax loss while cash-flowing — sheltering income. Rental losses are passive: they offset passive income freely, and up to $25,000/yr can offset ordinary (W-2) income if you actively participate and your MAGI is under $100k (phasing out to $0 by $150k); unused losses carry forward. On sale, claimed depreciation is recaptured at up to 25%, and gains may owe capital-gains tax (a 1031 exchange can defer both). Figures are a year-1 estimate at your 24.0% rate — not tax advice; consult a CPA.
Condition & rehab AI · 6 photos
This beautifully designed new construction duplex is in excellent condition with modern finishes and a well-maintained exterior. It offers a perfect blend of comfort, style, and functionality, making it an attractive investment property.
Value-add opportunities
- Both Painting the exterior and interior walls — Fresh paint can enhance curb appeal and interior aesthetics.
- Both Landscaping improvements — Enhanced landscaping can improve curb appeal and attract potential buyers/tenants.
- Both Adding smart home features — Smart home features can increase both resale and rental value by making the property more attractive and convenient for occupants.
- Both Upgrading appliances — Upgrading to more energy-efficient or modern appliances can increase both resale and rental value by making the property more appealing and potentially reducing utility costs.
Renovation cost estimate screening
Value-add ROI direction
- Both Painting the exterior and interior walls — Fresh paint can enhance curb appeal and interior aesthetics. ↑
- Both Landscaping improvements — Enhanced landscaping can improve curb appeal and attract potential buyers/tenants. ↑
- Both Adding smart home features — Smart home features can increase both resale and rental value by making the property more attractive and convenient for occupants. ↑
- Both Upgrading appliances — Upgrading to more energy-efficient or modern appliances can increase both resale and rental value by making the property more appealing and potentially reducing utility costs. ↑
ⓘ Cost ranges are severity-bucket heuristics (US national rule-of-thumb). Get contractor quotes + a written scope before underwriting a rehab budget.
Schools (NCES district)
- District
- Cypress-Fairbanks ISD
- NCES district ID
- 4816110
- Math proficiency
- 45% ▼ -12.00%
- Reading proficiency
- 52% ▼ -2.00%
- Median HH income
- $72,025
- Composite
- 43.63/100
- National rank
- #2968
- State rank
- #161 of 826 in TX
Livability — Houston
- Score
- 74/100
- State rank
- #184
- US rank
- #4771
Category grades
Schools grade is shown separately in the Schools card above.
Census & demographics
- Census place
- Houston, TX
- County
- Harris County · 4,702,590 people
- City population
- 3,226,434
- Metro
- Houston-The Woodlands-Sugar Land, TX
- Population (ZIP)
- 33,349
- Household income
- $77,083
- Rent vs Own
- Severe rent burden
- 537.0
Population outlook (Harris County) Hauer SSP2
- Today (2025)
- 5,571,493 people
- By 2030
- 6,089,821 · +9.3%
- By 2040
- 7,142,806 · +28.2%
- By 2050
- 8,185,864 · +46.9%
- By 2075
- 10,574,329 · +89.8%
- By 2100
- 12,109,958 · +117.4%
Race, ethnicity, and origin ACS 2023
- Neighborhood character
- Diverse neighborhood (Simpson 0.67)
- Race & ethnicity
- Hispanic / Latino 50% Two or more races 25% White 23% Asian 16% Black 9% Native American 3%
- Hispanic origin (detail)
- Mexican 36% Cuban 2% Salvadoran 1%
- Common ancestry
- Italian 1% Portuguese 1% Romanian 1%
- Foreign-born
- 38% · Canada, Vietnam, China
- Languages at home
- 45% English-only · Spanish 39% Vietnamese 8% Other Indo-European 3%
Political lean MEDSL · Harris
- 2024 margin
- Lean D (+5.5) · D 52.0% · R 46.4% · Other 1.6%
- 2008→2024 swing
- +3.9pp toward D · 2008: 1.6pp · 2024: 5.5pp
- All cycles
- 2024: D+5.5 2020: D+13.3 2016: D+12.4 2012: D+0.1 2008: D+1.6
Not yet ingested
- Civics
- —
Market trends
- HPI YoY
- ▼ -1.47%
- Current HPI
- 241.5096
- Rent YoY
- ▲ 0.25%
- Metro
- Houston-The Woodlands-Sugar Land, TX
- State GDP YoY
- ▲ 3.95%
- F500 in state
- 110
Industry mix (Fortune 500 HQ in TX)
| Industry | F500 HQs | Revenue |
|---|---|---|
| Energy | 16 | $1,198B |
|
||
| Technology | 5 | $198B |
|
||
| Engineering / Construction | 4 | $72B |
|
||
| Energy Services | 3 | $60B |
|
||
| Utilities | 3 | $41B |
|
||
| Healthcare | 2 | $330B |
|
||
Price history
-14.7% since first listed6 events — show timeline
- 2026-06-05 Listed $349,900 HARMLS
- 2026-06-04 Listing Removed — HARMLS
- 2026-06-03 Price Changed $349,900 HARMLS
- 2026-04-10 Price Changed $375,000 HARMLS
- 2026-01-12 Price Changed $390,000 HARMLS
- 2025-09-24 Listed $410,000 HARMLS
Cash-flow waterfall
monthlySold comps — $/sqft
last 12 mo · ≤1 miLoading sold comps…