38 Plantation Dr #203 · West Vero Corridor, FL
Flood risk 1/10 · Minimal
- FEMA flood zone
- X (unshaded)
- Chance of flooding over 30 yrs
- 0.0%
- Est. flood insurance / yr
- $507 – $1,088
Fire risk 4/10 · Minor
- Est. fire insurance / yr
- $947 – $1,759
Heat risk 10/10 · Severe
- Hot days now (above 106°F)
- 7 days/yr
- Hot days in 30 yrs
- 23 days/yr
Wind risk 10/10 · Severe
- Chance of severe wind over 30 yrs
- 99.0%
Air-quality risk 1/10 · Minimal
- Unhealthy air days now
- 0 days/yr
- Unhealthy air days in 30 yrs
- 0 days/yr
Risk factors via First Street. Map © Google.
Why this score? — see what drove the C- grade
The composite is a weighted blend of 9 inputs, each scored 0–100. Each bar is that input's sub-score; the figure is the points it added to the 100-point composite (weight × sub-score).
- Cash flow +16.9/30.0
- 1% rule +9.3/10.0
- ARV discount +7.5/15.0
- DSCR +5.3/10.0
- Schools +4.2/10.0
- Livability +3.7/5.0
- Rent growth +2.7/5.0
- Condition / age +2.5/5.0
- Appreciation +0.0/10.0
$139,900
🖨 Deal sheet 📄 Offer letter ✓ Due diligence
Listing remarks
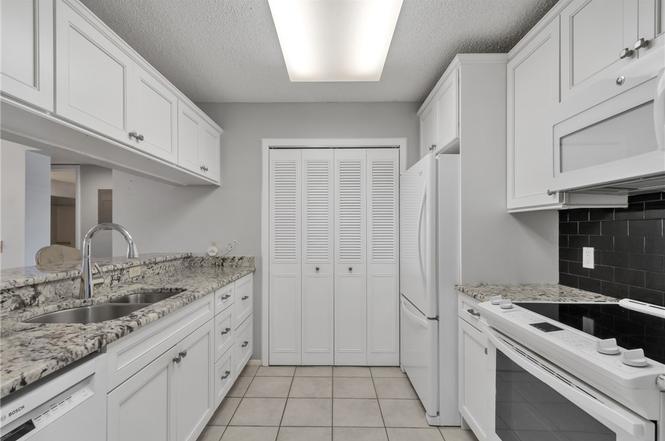
Welcome home to this lovely unfurnished gem calling your name! Sip morning coffee while enjoying spectacular lake & golf course views, & the morning sun overlooking the water! This dreamy condo, centrally located btwn both heated pools/clubhouse/covered pavilion/pro shop/pickle ball. Boasts upgraded kitchen w/ pantry, granite counters, tile backsplash, tile floors/plush carpets t/o. Spacious Primary bed boasts HUGE walk-in closet & shower! Convenience of washer/dryer in-unit, assigned covered parking & impact windows! Golf course/driving range-open to the public! Near shopping/dining/beaches!
Key facts
- Tile floors
- Lake views
- Upgraded kitchen
Tags
Property features AI
Finance
- Financial info: Pets not allowed
- HOA & community: HOA: First Service Residential; Monthly HOA dues; HOA fee includes common areas, cable TV, insurance, internet, structure maintenance, parking, reserve fund, sewer, trash, water; Community amenities: clubhouse, pool, tennis courts, pickleball, shuffleboard, barbecue, library, on-site property manager
Exterior
- Parking: Assigned carport; 1 carport space
- Security: Smoke detector(s)
- Utilities: Public water; County sewer
- Home design: 2-story building; Faces west; Attached property
- Construction: Concrete construction; Shingle roof
- Exterior features: Sprinkler/irrigation; Rain gutters; Lake/pond nearby; Community pool (heated, gas heat, free-form)
Interior
- Kitchen: Range; Microwave; Dishwasher; Refrigerator
- Bedrooms: Bedroom (10 x 12); Bedroom (13 x 12)
- Flooring: Carpet; Tile
- Bathrooms: 2 full bathrooms
- Heating & cooling: Central heating (electric); Central air (electric)
- Interior features: Window treatments; Pantry; Split bedrooms; Walk-in closet(s)
- Laundry & utility: In-unit laundry; Washer; Dryer; Electric water heater
Neighborhood map
What this means for you Summary
Snapshot
- This is a 2-bed/2.0-bath condo listed at $140k.
Deal economics
- At list price, monthly cash flow is $93 ($1k/yr) — positive.
- The deal already cash-flows at list — no discount required.
- Meets the 1% rule at list price ($2k rent vs $140k).
- Recommended offer: $123k (12.0% below list) — sets the bar for market timing.
- Cap rate 7.1% vs local median 4.0% in West Vero Corridor — top-decile yield for the area; either an underpriced asset or a hidden risk that comps aren't pricing in. Stress-test before assuming the spread holds.
Location & tenants
- Location reads 74/100 on livability (#273 in FL, #4,421 nationally) — a middle-class / working-renter tenant base. Strengths: cost of living A+, housing A+, commute A; Watch: schools F, amenities F, health & safety D-.
- Indian River (other): math 48% / reading 52% proficiency, ranked #35 of 73 in FL (top 48%) — acceptable for families but not a draw, mixed tenant base, ~2y average lease.
- Market conditions: Rents flat; 380 active listings in the ZIP; 25 comparable units currently listed for rent nearby; rentals at typical pace (median 21d on market — plan ~3-4 weeks tenant-placement turnaround); 564 units permitted in Indian River County in 2024 (281 in 5+ unit buildings).
- This rent runs 36% of the median local income ($67k/yr) — at the standard rent-burdened threshold; future hikes will face affordability resistance.
Forward outlook
- Local home prices are declining (-3.0%/yr); year-one equity from $967 of loan paydown is wiped out by about $4k of value loss. Plan a longer hold.
- Indian River County population projected at +18% by 2050 — long-run rental-demand tailwind backs the buy-and-hold thesis.
Negotiation context
- It's been on market 159 days — a 12% lower offer ($123k) is reasonable based on typical stale-listing flexibility.
- Current owner paid $73k; list at $140k implies a 92% gain — meaningful room to come down on a strong offer.
Risks & watch-outs
- Watch-outs: HOA is 33% of rent.
- Climate carrying-cost: severe wind risk, 99% chance of damaging wind over 30y; extreme-heat days projected 7→23/yr by 2055 (HVAC capex compounding) — expect insurance premiums to compound above CPI over the hold.
Questions for the listing agent
- It's been on market 159 days. Have you received any prior offers? Is the seller open to a 12% concession, seller financing, or rate buy-down credit?
- What does the HOA fee cover, when was the last increase, and are there any pending special assessments or reserve-fund shortfalls?
- Any open or pending special assessments — roof, HVAC, plumbing, elevator, façade? What's the per-unit balance and payoff schedule, and is the seller paying it off at close or rolling it to the buyer?
- Why hasn't it sold? Are there any deal-killer items the seller is aware of (foundation, flood, title, zoning, code violations)?
- Is there a deadline driving the sale (1031 exchange, divorce, estate, relocation)? That informs how much negotiation room exists.
- Schools are F-rated, which usually means shorter tenancies and higher turnover. Who's the typical renter profile here, and what's been the actual vacancy rate?
- What's the average days-on-market for RENTAL listings here right now (not sales)? A rising rental-DOM trend means longer vacancies and softer asking-rent achievability than the comps imply.
- What's the recent tenant-quality profile in this submarket — average credit score on applications, eviction rate, late-payment / NSF rate, and stable-employment percentage? A property-management company in the area should have these aggregated.
- How much new apartment / multifamily construction is in the pipeline within 1–3 miles? Heavy new supply (>2% of stock underway) typically softens rents 12–24 months out; light construction supports rent growth.
Investment metrics
- 1% rule
- 1.43% ✓
- Cap rate
- 7.09%
- Cash-on-cash
- 2.84%
- DSCR
- 1.13
- GRM
- 5.8
CMA / ARV
No comps found within radius.
Projected returns pro-forma
-3.0% appreciation · 0.6% rent growth · sell at horizon
- IRR
- -15.7%
- Equity multiple
- 0.46×
- Total profit
- $-21,143
- Equity at exit
- $20,860
- IRR
- -14.8%
- Equity multiple
- 0.29×
- Total profit
- $-27,873
- Equity at exit
- $12,096
Cash invested: $39,172 (down + closing). Projections, not guarantees.
Landlord ↔ Tenant lean methodology
- Overall (STATE)
- 87 Strongly Landlord-Friendly
- State Florida
- 87 Strongly Landlord-Friendly · R+3
- County
- — inherits STATE
- City
- — inherits STATE
ZIP-level market 32966
- Home prices YoY
- -26.7%
- Rents YoY
- 0.6%
- Active inventory
- 380
- Price-to-rent
- 5.8×
Monthly cashflow live
- Estimated rent
- $2,005 high interval (Pro) →
- Mortgage (P&I)
- −$734
- Tax from tax record
- −$47 /mo · $560/yr
- Insurance
- −$58
- HOA
- −$653
- Vacancy / Maint / Mgmt
- −$421
- Net cashflow
- $93
Break-even live
UW: 25.0% down · 7.5% · 30yr · 1.5% tax · 5.0% vac · 8.0% maint · 8.0% mgmt
Financing live
Cash to close
- Down payment
- $34,975
- Closing costs
- $4,197
- Reserves months
- —
- Total cash needed
- —
Loan-product check · same deal, 3 products live
Conventional
25% down · 7.5% · 30yr
- Down + closing
- —
- Monthly P&I
- —
- Monthly cashflow
- —
- DSCR
- —
- Eligible?
- —
Personal DTI + credit; lowest rate.
DSCR
20% down · 8.5% · 30yr
- Down + closing
- —
- Monthly P&I
- —
- Monthly cashflow
- —
- DSCR
- —
- Eligible?
- —
No personal income docs; deal must DSCR.
Hard money
10% down · 12.0% · 12mo
- Down + closing
- —
- Monthly P&I
- —
- Monthly cashflow
- —
- DSCR
- —
- Eligible?
- —
Short-term bridge; refi at stabilization.
Rent comps 25 comps
| Address | Beds | Baths | Sqft | Rent | $/sqft | DOM | Units | Dist |
|---|---|---|---|---|---|---|---|---|
| 39 Plantation Dr #101 Vero Beach, FL | 2.0 | 2.0 | 1188 | $2,200 | $1.85 | 21d | 1 | 0.01mi |
| 43 Plantation Dr #106 Vero Beach, FL | 2.0 | 2.0 | 1188 | $1,850 | $1.56 | 21d | 1 | 0.08mi |
| 42 Plantation Dr #103 Vero Beach, FL | 2.0 | 2.0 | 1188 | $1,900 | $1.60 | 21d | 1 | 0.08mi |
| 30 Plantation Dr #101 Vero Beach, FL | 2.0 | 2.0 | 1188 | $2,000 | $1.68 | 21d | 1 | 0.22mi |
| 29 Plantation Dr Vero Beach, FL | 2.0 | 2.0 | 1188 | $1,800 | $1.52 | 21d | 1 | 0.24mi |
| 3 Plantation Dr #105 Vero Beach, FL | 1.0 | 1.0 | 804 | $1,500 | $1.87 | 21d | 1 | 0.26mi |
| 16 Plantation Dr #105 Vero Beach, FL | 1.0 | 1.0 | 804 | $1,850 | $2.30 | 21d | 1 | 0.28mi |
| 24 Plantation Dr #201 Vero Beach, FL | 2.0 | 2.0 | 1188 | $1,750 | $1.47 | 21d | 1 | 0.29mi |
| 28 Plantation Dr Vero Beach, FL | 2.0 | 2.0 | 1188 | $2,000 | $1.68 | 21d | 1 | 0.35mi |
| 20 Plantation Dr #101 Vero Beach, FL | 2.0 | 2.0 | 1188 | $2,200 | $1.85 | 21d | 1 | 0.35mi |
| 1930 Westminster Cir #2 Vero Beach, FL | 2.0 | 3.0 | 1430 | $1,800 | $1.26 | 21d | 1 | 0.49mi |
| 1924 Westminster Cir #6 Vero Beach, FL | 2.0 | 3.0 | 1350 | $2,000 | $1.48 | 21d | 1 | 0.52mi |
| 1827 Aynsley Way Unit 2-27 Vero Beach, FL | 2.0 | 2.0 | 1500 | $3,300 | $2.20 | 21d | 1 | 0.54mi |
| 1868 Sixty Oaks Ln Vero Beach, FL | 2.0 | 2.0 | 971 | $2,450 | $2.52 | 21d | 1 | 0.83mi |
| 1890 Tatnall Sq Vero Beach, FL | 1.0–3.0 | 1.0–2.0 | 1098 | $1,945 | $1.77 | 13d | 7 | 0.87mi |
| 6295 33rd Mnr Vero Beach, FL | 3.0 | 2.0 | 1464 | $2,500 | $1.71 | 13d | 1 | 1.04mi |
| 7580 Heron Cir Vero Beach, FL | 1.0–3.0 | 1.0–2.0 | 1003 | $2,076 | $2.07 | 13d | 21 | 1.14mi |
| 2260 57th Cir #2260 Vero Beach, FL | 2.0 | 2.0 | 1170 | $1,800 | $1.54 | 21d | 1 | 1.21mi |
| 2260 57th Cir Vero Beach, FL | 2.0 | 2.0 | 1170 | $1,850 | $1.58 | 21d | 1 | 1.21mi |
| 2448 57th Cir #2448 Vero Beach, FL | 2.0 | 2.0 | 1170 | $1,750 | $1.50 | 21d | 1 | 1.21mi |
| 2448 57th Cir Vero Beach, FL | 2.0 | 2.0 | 1170 | $1,700 | $1.45 | 21d | 1 | 1.21mi |
| 2288 57th Cir Unit 2288 Vero Beach, FL | 1.0 | 1.0 | 705 | $2,000 | $2.84 | 21d | 1 | 1.21mi |
| 2526 57th Cir Vero Beach, FL | 2.0 | 2.0 | 1170 | $1,800 | $1.54 | 21d | 1 | 1.21mi |
| 2482 57th Cir #2482 Vero Beach, FL | 1.0 | 1.0 | 851 | $1,400 | $1.65 | 21d | 1 | 1.21mi |
| 2050 Griffon Rd Vero Beach, FL | 1.0–2.0 | 1.0–2.0 | 850 | $2,295 | $2.70 | 13d | 31 | 1.31mi |
HOA detail condo
- Monthly dues
- $653 · $7,836/yr
- Likely covers
- waterpool
- Assessments
- None detected in remarks — confirm with the listing agent.
Listing history 25 events
-
2026-06-19days on market $139,900 Active 159 DOM
-
2026-06-18days on market $139,900 Active 158 DOM
-
2026-06-17days on market $139,900 Active 157 DOM
-
2026-06-16days on market $139,900 Active 156 DOM
-
2026-06-15pricedays on market $139,900 Active 155 DOM
-
2026-06-14days on market $149,900 Active 153 DOM
-
2026-06-13days on market $149,900 Active 152 DOM
-
2026-06-10days on market $149,900 Active 150 DOM
-
2026-06-09days on market $149,900 Active 149 DOM
-
2026-06-08days on market $149,900 Active 148 DOM
-
2026-06-07days on market $149,900 Active 147 DOM
-
2026-06-05days on market $149,900 Active 144 DOM
-
2026-06-02days on market $149,900 Active 142 DOM
-
2026-06-01days on market $149,900 Active 141 DOM
-
2026-05-31days on market $149,900 Active 140 DOM
-
2026-05-30days on market $149,900 Active 139 DOM
-
2026-05-20price $149,900
-
2026-04-30price $158,900
-
2026-04-13price $168,500
-
2026-03-19price $174,900
-
2026-01-11$178,900 Active
-
2015-04-06soldstatus $73,000
-
2002-04-05soldstatus $86,400
-
1989-03-01soldstatus $68,500
-
1988-09-01soldstatus $68,900
ⓘ Source: listings_history table (triggers on properties + properties_extension) + one-shot
backfill from property_details.listing_events for pre-trigger history.
Tax reassessment forecast FL · Resets to sale price
- Current annual tax
- $560 · $47/mo
- Projected year-2 tax
- $1,161 · $97/mo
- Expected delta
- +$601/yr (+$50/mo · 107.2%)
ⓘ Screening estimate from a state-policy table — verify with the county assessor before closing.
Climate risk First Street
- Flood 1/10 Low FEMA zone X (unshaded) · 0% chance over 30 yrs
- Wildfire 4/10 Moderate
- Heat 10/10 Extreme 7 d/yr ≥106°F today · 23 d/yr by 30 yrs out
- Wind 10/10 Extreme 99% chance of damaging wind over 30 yrs
- Air quality 1/10 Low 0 unhealthy d/yr today · 0 by 30 yrs out
Nearby sold comps map
Loading sold comps map…
Walkable amenities ~0.75 mi
Loading nearby amenities…
Taxation est. · year 1
- Rental income
- $24,066
- − Mortgage interest
- −$7,837
- − Property taxes
- −$560
- − Insurance
- −$700
- − Repairs & maintenance
- −$1,925
- − Management
- −$1,925
- − HOA
- −$7,836
- − Depreciation
- −$4,070
- Taxable loss
- −$787
- Est. tax savings @ 24.0%
- +$189
- After-tax cash flow
- $1,301/yr
For passive investors: Depreciation is non-cash, so a rental often shows a tax loss while cash-flowing — sheltering income. Rental losses are passive: they offset passive income freely, and up to $25,000/yr can offset ordinary (W-2) income if you actively participate and your MAGI is under $100k (phasing out to $0 by $150k); unused losses carry forward. On sale, claimed depreciation is recaptured at up to 25%, and gains may owe capital-gains tax (a 1031 exchange can defer both). Figures are a year-1 estimate at your 24.0% rate — not tax advice; consult a CPA.
Schools (NCES district)
- District
- Indian River
- NCES district ID
- 1200930
- Math proficiency
- 48% ▼ -9.00%
- Reading proficiency
- 52% ▼ -3.00%
- Median HH income
- $46,597
- Composite
- 42.45/100
- National rank
- #3218
- State rank
- #35 of 73 in FL
Livability — West Vero Corridor
- Score
- 74/100
- State rank
- #273
- US rank
- #4421
Category grades
Schools grade is shown separately in the Schools card above.
Census & demographics
- Census place
- West Vero Corridor, FL
- County
- Indian River County · 143,738 people
- Metro
- Sebastian-Vero Beach, FL
- Population (ZIP)
- 20,686
- Household income
- $66,771
- Rent vs Own
- Severe rent burden
- 766.0
Population outlook (Indian River County) Hauer SSP2
- Today (2025)
- 165,104 people
- By 2030
- 172,869 · +4.7%
- By 2040
- 185,640 · +12.4%
- By 2050
- 194,465 · +17.8%
- By 2075
- 211,115 · +27.9%
- By 2100
- 211,781 · +28.3%
Race, ethnicity, and origin ACS 2023
- Neighborhood character
- Predominantly White (83%)
- Race & ethnicity
- White 83% Hispanic / Latino 9% Two or more races 7% Black 5%
- Hispanic origin (detail)
- Puerto Rican 4% Cuban 1%
- Common ancestry
- Romanian 5% Lithuanian 3% Slovak 2%
- Foreign-born
- 8% · Canada, Jamaica
- Languages at home
- 90% English-only · Spanish 7% Russian/Polish/Slavic 1% French/Haitian/Cajun 1%
Political lean MEDSL · Indian River
- 2024 margin
- Strong R (+27.4) · D 36.0% · R 63.4%
- 2008→2024 swing
- -12.5pp toward R · 2008: -14.8pp · 2024: -27.4pp
- All cycles
- 2024: R+27.4 2020: R+21.6 2016: R+24.5 2012: R+22.3 2008: R+14.8
Not yet ingested
- Civics
- —
Market trends
- HPI YoY
- ▼ -102.01%
- Current HPI
- 280.669
- Rent YoY
- ▲ 0.60%
- Metro
- Sebastian-Vero Beach, FL
- State GDP YoY
- ▲ 3.28%
- F500 in state
- 36
Industry mix (Fortune 500 HQ in FL)
| Industry | F500 HQs | Revenue |
|---|---|---|
| Industrial Technology | 2 | $29B |
|
||
| Insurance | 2 | $17B |
|
||
| Retail | 1 | $60B |
|
||
| Technology Distribution | 1 | $58B |
|
||
| Homebuilding | 1 | $35B |
|
||
| Technology Manufacturing | 1 | $35B |
|
||
Price history
+117.6% since first listed9 events — show timeline
- 2026-05-20 Price Changed $149,900 RAIRCMLS
- 2026-04-30 Price Changed $158,900 RAIRCMLS
- 2026-04-13 Price Changed $168,500 RAIRCMLS
- 2026-03-19 Price Changed $174,900 RAIRCMLS
- 2026-01-11 Listed $178,900 RAIRCMLS
- 2015-04-06 Sold (Public Records) $73,000 Public Records
- 2002-04-05 Sold (Public Records) $86,400 Public Records
- 1989-03-01 Sold (Public Records) $68,500 Public Records
- 1988-09-01 Sold (Public Records) $68,900 Public Records
Property tax history
+0.6%/yrLatest (2025): $560 · +9.0% YoY. Source: county tax records.
Cash-flow waterfall
monthlySold comps — $/sqft
last 12 mo · ≤1 miLoading sold comps…