1936 W Beckert Ave · Reserve, PA
Flood risk No data
- FEMA flood zone
- —
- Chance of flooding over 30 yrs
- —
- Est. flood insurance / yr
- —
Fire risk No data
- Est. fire insurance / yr
- —
Heat risk No data
- Hot days now (above threshold)
- —
- Hot days in 30 yrs
- —
Wind risk No data
- Chance of severe wind over 30 yrs
- —
Air-quality risk No data
- Unhealthy air days now
- —
- Unhealthy air days in 30 yrs
- —
Risk factors via First Street. Map © Google.
Why this score? — see what drove the C- grade
The composite is a weighted blend of 9 inputs, each scored 0–100. Each bar is that input's sub-score; the figure is the points it added to the 100-point composite (weight × sub-score).
- Cash flow +21.0/30.0
- ARV discount +7.5/15.0
- DSCR +6.7/10.0
- 1% rule +5.5/10.0
- Schools +4.1/10.0
- Rent growth +3.5/5.0
- Livability +2.5/5.0
- Condition / age +2.5/5.0
- Appreciation +0.0/10.0
$320,000
🖨 Deal sheet 📄 Offer letter ✓ Due diligence
Listing remarks
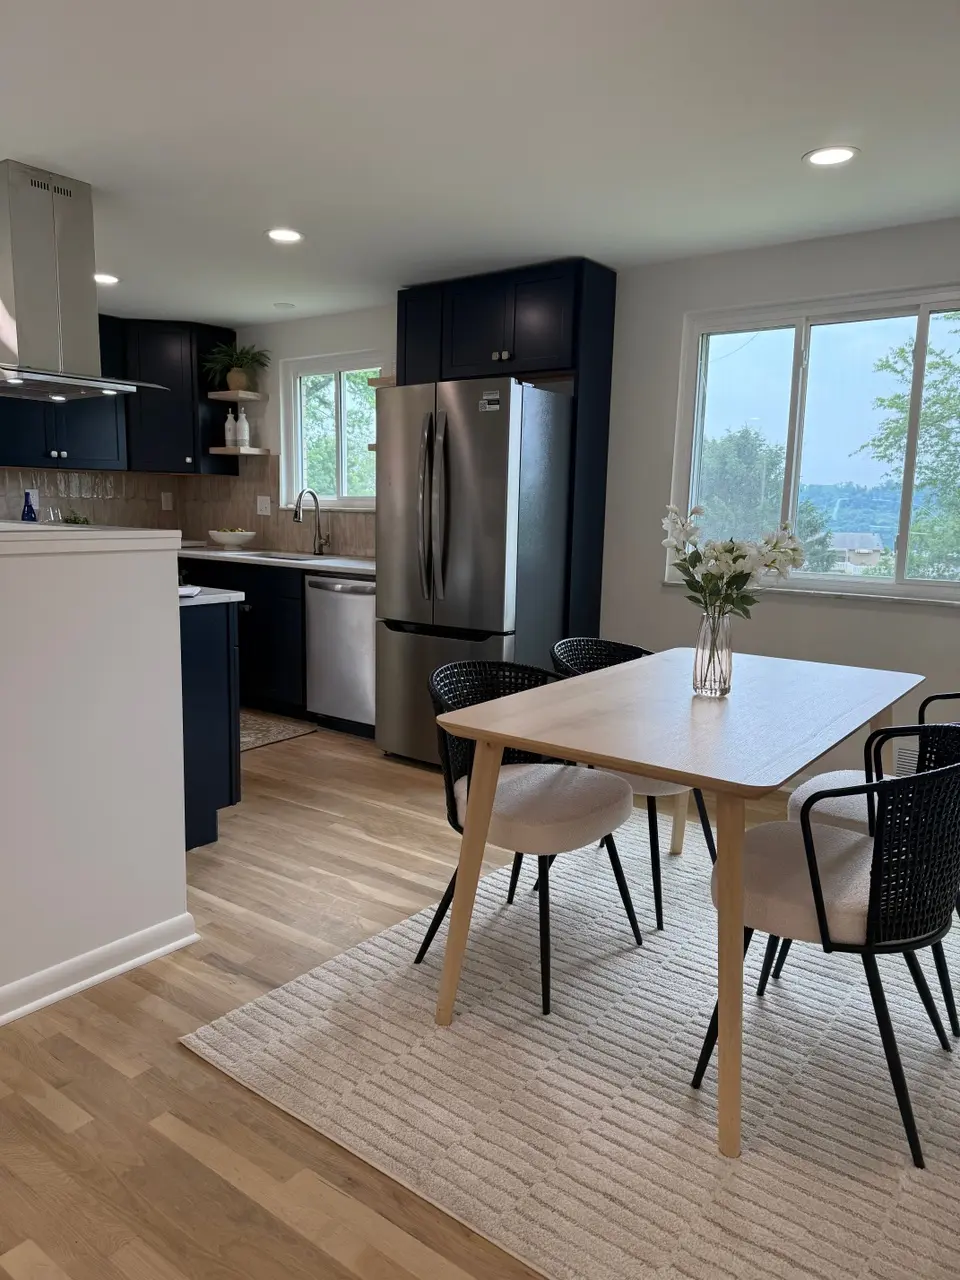
Welcome home to this bright and airy 3-bedroom, 2-full-bath ranch, tucked away on a peaceful dead-end street in Reserve Township. Totally renovated from top to bottom, this gem features brand-new windows that flood the home with natural light and frame lush green views from almost every room. Completely updated with modern finishes and a bright, open feel. State-of-the-art kitchen equipped with premium appliances and sleek finishes. The navy blue cabinets, the quartz countertops and the hand textured cream tile all give the house an elevated feel. Two fully renovated, pristine full bathrooms with thoughtful tile choices and a spa-like feel. Don't forget the delightfully airy finished baseme
Key facts
- Quartz countertops
- Brand-new windows
- Premium appliances
Tags
Property features AI
Exterior
- Parking: Garage
- Home design: Single-family property
Interior
- Bedrooms: 3 bedrooms
- Bathrooms: 2 bathrooms
- Heating & cooling: Air conditioning
- Interior features: 6 total rooms
Neighborhood map
What this means for you Summary
Snapshot
- This is a 3-bed/1.0-bath single-family listed at $320k.
Deal economics
- At list price, monthly cash flow is $452 ($5k/yr) — positive.
- The deal already cash-flows at list — no discount required.
- Meets the 1% rule at list price ($3k rent vs $320k).
Location & tenants
- Location reads: area grade C — affects rentability + tenant quality, not the cash-flow math above.
- Shaler Area SD (suburban): math 36% / reading 59% proficiency, ranked #208 of 539 in PA (top 39%) — families likely to look elsewhere, expect single-tenant / working-renter base with shorter leases.
- Market conditions: Rents rising fast (+4.0%/yr); 11 active listings in the ZIP; 14 comparable units currently listed for rent nearby; rentals leasing fast (median 5d on market — plan ~1-2 weeks tenant-placement turnaround); 2,996 units permitted in Allegheny County in 2024 (1,588 in 5+ unit buildings).
- At $3,372/mo this rent would consume 63% of the median local household income ($64k/yr) (locally 1584% of renters already pay >50% of income on rent) — very limited rent-growth headroom before tenants either downsize or default.
Forward outlook
- Local home prices are declining (-3.0%/yr); year-one equity from $2k of loan paydown is wiped out by about $10k of value loss. Plan a longer hold.
Negotiation context
- Only 2 days on market — expect competitive offers; lowballing is unlikely to land.
Risks & watch-outs
- Watch-outs: built in 1950 — expect roof / HVAC / electrical / plumbing capex.
Questions for the listing agent
- Built in 1950 — when were the roof, HVAC, electrical panel, plumbing, and water heater last replaced?
- Is there a deadline driving the sale (1031 exchange, divorce, estate, relocation)? That informs how much negotiation room exists.
- What's the average days-on-market for RENTAL listings here right now (not sales)? A rising rental-DOM trend means longer vacancies and softer asking-rent achievability than the comps imply.
- What's the recent tenant-quality profile in this submarket — average credit score on applications, eviction rate, late-payment / NSF rate, and stable-employment percentage? A property-management company in the area should have these aggregated.
- How much new for-sale + rental construction is in the pipeline within 1–3 miles? Heavy new supply typically softens prices + rents 12–24 months out; constrained supply supports both.
Investment metrics
- 1% rule
- 1.05% ✓
- Cap rate
- 7.99%
- Cash-on-cash
- 6.06%
- DSCR
- 1.27
- GRM
- 7.9
CMA / ARV
- ARV (on-the-fly)
- $171,600
- Comps found
- 12
Show comp detail 12 sales within ~0.75 mi
| Address | Dist | Beds/Ba | Sqft | Sold | Price | $/sf | Match |
|---|---|---|---|---|---|---|---|
| 2020 Lowrie | 0.23mi | 2/1.0 (-1) | 1,079 (+4%) | 1mo | $140,000 | $130 | 77 |
| 2104 Straubs Ln | 0.24mi | 2/1.0 (-1) | 1,066 (+2%) | 12mo | $92,000 | $86 | 70 |
| 2126 Rockledge St | 0.35mi | 3/2.0 | 1,080 (+4%) | 7mo | $182,000 | $169 | 67 |
| 2041 E Homestead St | 0.28mi | 3/2.0 | 1,050 (+1%) | 21mo | $189,175 | $180 | 64 |
| 1920 Lowrie St | 0.26mi | 2/1.0 (-1) | 1,122 (+8%) | 8mo | $180,000 | $160 | 63 |
| 2136 Liedertafel Way | 0.27mi | 2/1.0 (-1) | 1,008 (-3%) | 18mo | $70,000 | $69 | 62 |
| 2608 Volta St | 0.35mi | 3/1.0 | 985 (-5%) | 18mo | $145,000 | $147 | 60 |
| 2719 Edison St | 0.50mi | 3/1.0 | 1,080 (+4%) | 14mo | $190,000 | $176 | 59 |
| 2162 Lowrie St | 0.35mi | 2/1.5 (-1) | 1,104 (+6%) | 13mo | $147,000 | $133 | 56 |
| 2136 Harbor St | 0.30mi | 2/1.0 (-1) | 1,152 (+11%) | 17mo | $190,000 | $165 | 49 |
| 2816 Wohleber St | 0.47mi | 2/1.0 (-1) | 918 (-12%) | 15mo | $205,000 | $223 | 41 |
| 209 Arlington St | 0.63mi | 2/1.0 (-1) | 1,148 (+10%) | 16mo | $200,000 | $174 | 35 |
Match score weights: distance 35% · size 25% · config 20% · recency 20%. Top-matched comps best support the ARV.
Projected returns pro-forma
-3.0% appreciation · 4.01% rent growth · sell at horizon
- IRR
- -5.8%
- Equity multiple
- 0.78×
- Total profit
- $-19,523
- Equity at exit
- $47,713
- IRR
- 5.0%
- Equity multiple
- 1.39×
- Total profit
- $34,814
- Equity at exit
- $27,668
Cash invested: $89,600 (down + closing). Projections, not guarantees.
Landlord ↔ Tenant lean methodology
- Overall (STATE)
- 62 Landlord-Friendly
- State Pennsylvania
- 62 Landlord-Friendly · EVEN
- County
- — inherits STATE
- City
- — inherits STATE
ZIP-level market 15212
- Home prices YoY
- -31.6%
- Rents YoY
- 4.0%
- Active inventory
- 11
- Price-to-rent
- 7.9×
Monthly cashflow live
- Estimated rent
- $3,372 high interval (Pro) →
- Mortgage (P&I)
- −$1,678
- Tax est. 1.5%
- −$400 /mo · $4,800/yr
- Insurance
- −$133
- HOA
- −$0
- Vacancy / Maint / Mgmt
- −$708
- Net cashflow
- $452
Break-even live
UW: 25.0% down · 7.5% · 30yr · 1.5% tax · 5.0% vac · 8.0% maint · 8.0% mgmt
Financing live
Cash to close
- Down payment
- $80,000
- Closing costs
- $9,600
- Reserves months
- —
- Total cash needed
- —
Loan-product check · same deal, 3 products live
Conventional
25% down · 7.5% · 30yr
- Down + closing
- —
- Monthly P&I
- —
- Monthly cashflow
- —
- DSCR
- —
- Eligible?
- —
Personal DTI + credit; lowest rate.
DSCR
20% down · 8.5% · 30yr
- Down + closing
- —
- Monthly P&I
- —
- Monthly cashflow
- —
- DSCR
- —
- Eligible?
- —
No personal income docs; deal must DSCR.
Hard money
10% down · 12.0% · 12mo
- Down + closing
- —
- Monthly P&I
- —
- Monthly cashflow
- —
- DSCR
- —
- Eligible?
- —
Short-term bridge; refi at stabilization.
Rent comps 14 comps
| Address | Beds | Baths | Sqft | Rent | $/sqft | DOM | Units | Dist |
|---|---|---|---|---|---|---|---|---|
| 1907 Mount Troy Rd Apt 2 Pittsburgh, PA | 2.0 | 1.0 | 900 | $994 | $1.10 | 12d | 1 | 0.18mi |
| 2939 Smallman St Pittsburgh, PA | 3.0 | 1.0–2.0 | 919 | $4,580 | $4.98 | 2d | 53 | 0.90mi |
| 2645 Railroad St Pittsburgh, PA | 2.0 | 1.0–2.0 | 825 | $3,067 | $3.72 | 3d | 24 | 0.91mi |
| 2926 Smallman St Pittsburgh, PA | 3.0 | 1.0–2.0 | 871 | $4,600 | $5.28 | 15d | 52 | 0.92mi |
| 2930 Smallman St Pittsburgh, PA | 3.0 | 1.0–2.0 | 872 | $4,600 | $5.27 | 8d | 56 | 0.93mi |
| 147 39th St Pittsburgh, PA | 3.0 | 1.0–2.0 | 934 | $3,463 | $3.71 | 2d | 44 | 0.98mi |
| 3459 Butler St Pittsburgh, PA | 2.0 | 2.0 | 970 | $2,590 | $2.67 | 24d | 12 | 1.00mi |
| 4107 Willow St Pittsburgh, PA | 2.0 | 1.0–2.0 | 917 | $3,334 | $3.63 | 2d | 28 | 1.04mi |
| 3725 Butler St Pittsburgh, PA | 2.0 | 2.0 | 1236 | $3,899 | $3.15 | 15d | 1 | 1.05mi |
| 2349 Railroad St Pittsburgh, PA | 1.0–3.0 | 1.0–2.0 | 1533 | $5,650 | $3.68 | 2d | 23 | 1.06mi |
| 300 Heinz St Pittsburgh, PA | 1.0–3.0 | 1.0–3.0 | 1232 | $3,941 | $3.20 | 3d | 12 | 1.15mi |
| 950 Progress St Pittsburgh, PA | 1.0–2.0 | 1.0–1.5 | 817 | $2,350 | $2.88 | 21d | 4 | 1.19mi |
| 1909 Waterfront Pl Pittsburgh, PA | 2.0 | 1.0–2.0 | 866 | $3,780 | $4.36 | 2d | 27 | 1.23mi |
| 265 46th St Pittsburgh, PA | 1.0–3.0 | 1.0–1.5 | 883 | $2,745 | $3.11 | 4d | 10 | 1.45mi |
Listing history 7 events
-
2026-06-18days on market $320,000 Active 2 DOM
-
2026-06-16pricestatusdays on market $320,000 Active 1 DOM
-
2026-06-15days on market $325,000 Coming Soon 6 DOM
-
2026-06-13days on market $325,000 Coming Soon 4 DOM
-
2026-06-13days on market $325,000 Coming Soon 3 DOM
-
2026-06-10remarks 699-char remark
-
2026-06-10$325,000 Coming Soon 1 DOM
ⓘ Source: listings_history table (triggers on properties + properties_extension) + one-shot
backfill from property_details.listing_events for pre-trigger history.
Nearby sold comps map
Loading sold comps map…
Walkable amenities ~0.75 mi
Loading nearby amenities…
Taxation est. · year 1
- Rental income
- $40,465
- − Mortgage interest
- −$17,925
- − Property taxes
- −$4,800
- − Insurance
- −$1,600
- − Repairs & maintenance
- −$3,237
- − Management
- −$3,237
- − Depreciation
- −$9,309
- Taxable income
- $356
- Est. tax owed @ 24.0%
- −$86
- After-tax cash flow
- $5,344/yr
For passive investors: Depreciation is non-cash, so a rental often shows a tax loss while cash-flowing — sheltering income. Rental losses are passive: they offset passive income freely, and up to $25,000/yr can offset ordinary (W-2) income if you actively participate and your MAGI is under $100k (phasing out to $0 by $150k); unused losses carry forward. On sale, claimed depreciation is recaptured at up to 25%, and gains may owe capital-gains tax (a 1031 exchange can defer both). Figures are a year-1 estimate at your 24.0% rate — not tax advice; consult a CPA.
Schools (NCES district)
- District
- Shaler Area SD
- NCES district ID
- 4221200
- Math proficiency
- 36% ▼ -16.00%
- Reading proficiency
- 59% ▼ -15.00%
- Median HH income
- $57,411
- Composite
- 41.33/100
- National rank
- #3506
- State rank
- #208 of 539 in PA
Livability — Reserve
No livability data for this city. (Only ~50 U.S. cities are tracked.)
Census & demographics
- County
- Allegheny County · 1,022,028 people
- Metro
- Pittsburgh, PA
- Population (ZIP)
- 27,652
- Household income
- $64,077
- Rent vs Own
- Severe rent burden
- 1584.0
Population outlook (Allegheny County) Hauer SSP2
- Today (2025)
- 1,250,282 people
- By 2030
- 1,256,482 · +0.5%
- By 2040
- 1,256,318 · +0.5%
- By 2050
- 1,244,169 · -0.5%
- By 2075
- 1,197,693 · -4.2%
- By 2100
- 1,093,187 · -12.6%
Race, ethnicity, and origin ACS 2023
- Neighborhood character
- Diverse neighborhood (Simpson 0.56)
- Race & ethnicity
- White 62% Black 25% Two or more races 7% Hispanic / Latino 4% Asian 2%
- Common ancestry
- Romanian 6% Lithuanian 3% Serbian 1%
- Foreign-born
- 5% · Canada
- Languages at home
- 94% English-only · Spanish 3% Other Indo-European 1% Arabic 1%
Political lean MEDSL · Allegheny
- 2024 margin
- Strong D (+20.3) · D 59.7% · R 39.4%
- 2008→2024 swing
- +4.8pp toward D · 2008: 15.5pp · 2024: 20.3pp
- All cycles
- 2024: D+20.3 2020: D+20.4 2016: D+16.4 2012: D+14.4 2008: D+15.5
Not yet ingested
- Civics
- —
Market trends
- HPI YoY
- ▼ -120.40%
- Current HPI
- 260.4262
- Rent YoY
- ▲ 4.01%
- Metro
- Pittsburgh, PA
- State GDP YoY
- ▲ 1.68%
- F500 in state
- 34
Industry mix (Fortune 500 HQ in PA)
| Industry | F500 HQs | Revenue |
|---|---|---|
| Healthcare | 2 | $309B |
|
||
| Insurance | 2 | $27B |
|
||
| Telecommunications / Media | 1 | $124B |
|
||
| Industrial Distribution | 1 | $22B |
|
||
| Financial Services | 1 | $20B |
|
||
| Chemicals / Materials | 1 | $18B |
|
||
Cash-flow waterfall
monthlySold comps — $/sqft
last 12 mo · ≤1 miLoading sold comps…