145 Cranford Rd · Fountain Inn, SC
Flood risk 1/10 · Minimal
- FEMA flood zone
- X (unshaded)
- Chance of flooding over 30 yrs
- 0.0%
- Est. flood insurance / yr
- $507 – $1,088
Fire risk 4/10 · Minor
- Est. fire insurance / yr
- $783 – $1,453
Heat risk 5/10 · Moderate
- Hot days now (above 104°F)
- 7 days/yr
- Hot days in 30 yrs
- 15 days/yr
Wind risk 2/10 · Minimal
- Chance of severe wind over 30 yrs
- 3.0%
Air-quality risk 3/10 · Minor
- Unhealthy air days now
- 3 days/yr
- Unhealthy air days in 30 yrs
- 3 days/yr
Risk factors via First Street. Map © Google.
Why this score? — see what drove the D grade
The composite is a weighted blend of 9 inputs, each scored 0–100. Each bar is that input's sub-score; the figure is the points it added to the 100-point composite (weight × sub-score).
- Cash flow +11.2/30.0
- ARV discount +8.1/15.0
- Condition / age +4.8/5.0
- Schools +4.2/10.0
- Livability +4.1/5.0
- Rent growth +3.6/5.0
- 1% rule +3.5/10.0
- DSCR +3.3/10.0
- Appreciation +0.0/10.0
$305,900
🖨 Deal sheet (PDF) 📄 Offer letter ✓ Due diligence
Listing remarks
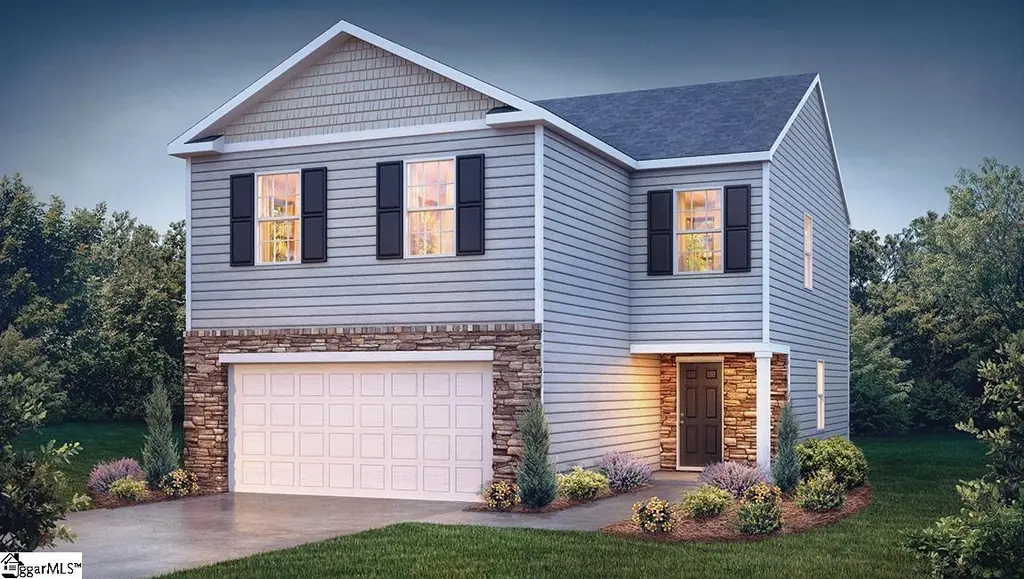
Check out 145 Cranford Road, a stunning new home in our Cedar Gap community. This spacious, two-story home features four bedrooms, two and a half bathrooms, and a two-car garage. As you step inside, you’ll be greeted by a welcoming foyer that leads directly into the heart of the home. The open-concept layout connects the family room, dining area, and kitchen, creating a seamless flow throughout the main living spaces. The kitchen is equipped with a pantry, stainless steel appliances, and a large island with a breakfast bar, making it perfect for both everyday meals and entertaining guests. Upstairs, you’ll find the private primary suite, featuring a generous walk-in closet and a
Key facts
- Pantry
- Large island
- Breakfast bar
Tags
Property features AI
Finance
- HOA & community: Homeowners association present; HOA includes pool, street lights, bylaws, and restrictive covenants; Community amenities include common areas, lights, pool, and some sidewalks
Exterior
- Parking: Attached 2-car garage with door opener; Paved concrete driveway
- Utilities: Public water; Tankless gas water heater; Public sewer; Public garbage pickup; Attached garage; Electric service for cooling and dryer
- Home design: Two-story home; Model: Aisle J; Under construction (approx. 2026)
- Construction: Built by D.R. Horton; Slab foundation; Storage in attic and garage
- Exterior features: Patio; Tilt-out windows; Vinyl/aluminum trim; Thermal windows; Stone and vinyl siding exterior; Composition shingle roof
Interior
- Kitchen: Dishwasher; Disposal; Gas range (stand-alone); Self-cleaning oven; Built-in microwave; 14 x 11 kitchen
- Bedrooms: Primary bedroom on 2nd level with double sink, full bath, separate shower and walk-in closet; Bedroom 2: 10 x 13; Bedroom 3: 10 x 11; Bedroom 4: 10 x 12; Primary bedroom size: 12 x 16
- Flooring: Carpet; Luxury vinyl tile/plank
- Bathrooms: 2 full bathrooms; 1 half bathroom
- Heating & cooling: Forced air heating (natural gas) with damper control; Central electric cooling with damper control
- Interior features: Attic stairs (disappearing); Cable available; Smooth ceilings; Open floor plan; Smoke detector; Walk-in closet(s); Quartz countertops; Walk-in pantry; Radon mitigation system; Pre-wired for smart systems; No fireplace
- Laundry & utility: Laundry on 2nd floor with walk-in area and electric dryer hookup
Neighborhood map
What this means for you Summary
Snapshot
- This is a 4-bed/2.5-bath single-family listed at $306k. Condition is rated excellent.
Deal economics
- At list price, monthly cash flow is $-118 ($-1k/yr) — negative.
- To cash-flow at today's rent, offer at most $289k (5.6% below list).
- To meet the 1% rule (rent ≥ 1% of price), the offer needs to be $259k (15.3% below list).
- Recommended offer: $259k (15.3% below list) — sets the bar for 1% rule.
- Cap rate 5.8% vs local median 4.1% in Fountain Inn — top-decile yield for the area; either an underpriced asset or a hidden risk that comps aren't pricing in. Stress-test before assuming the spread holds.
Location & tenants
- Location reads 82/100 on livability (#4 in SC, #1,162 nationally) — a professional / high-income tenant draw. Strengths: crime A+, cost of living A+, housing A+; Watch: commute F.
- Greenville 01 (suburban): math 44% / reading 54% proficiency, ranked #10 of 80 in SC (top 12%) — families likely to look elsewhere, expect single-tenant / working-renter base with shorter leases.
- Zoned schools: Bryson Elementary (math 52% / reading 52%, grade C-, #145 of 597 statewide, top 26%, 911 students, 70% FRL) — zoned schools average 70% FRL vs 42% district-wide (28 pts higher); higher-poverty schools than district average — tighter screening recommended.
- Market conditions: Rents rising fast (+4.5%/yr); 484 active listings in the ZIP; 3 comparable units currently listed for rent nearby; rentals at typical pace (median 21d on market — plan ~3-4 weeks tenant-placement turnaround); 5,595 units permitted in Greenville County in 2024 (566 in 5+ unit buildings).
- This rent runs 44% of the median local income ($70k/yr) — at the standard rent-burdened threshold; future hikes will face affordability resistance.
Forward outlook
- Local home prices are declining (-3.0%/yr); year-one equity from $2k of loan paydown is wiped out by about $9k of value loss. Plan a longer hold.
- Greenville County population projected at +34% by 2050 — long-run rental-demand tailwind backs the buy-and-hold thesis.
Negotiation context
- It's been on market 26 days — a 2% lower offer ($301k) is reasonable based on typical stale-listing flexibility.
Risks & watch-outs
- Climate carrying-cost: extreme-heat days projected 7→15/yr by 2055 (HVAC capex compounding) — expect insurance premiums to compound above CPI over the hold.
Questions for the listing agent
- What do current leases actually rent for vs. the listed asking? Can we see a recent rent roll and the last 12 months of T-12 income?
- What does the HOA fee cover, when was the last increase, and are there any pending special assessments or reserve-fund shortfalls?
- Is there a deadline driving the sale (1031 exchange, divorce, estate, relocation)? That informs how much negotiation room exists.
- The area grade is low — what's the realistic commute time and amenity access for the typical tenant pool here? Any planned neighborhood developments (good or bad) we should know about?
- What's the average days-on-market for RENTAL listings here right now (not sales)? A rising rental-DOM trend means longer vacancies and softer asking-rent achievability than the comps imply.
- What's the recent tenant-quality profile in this submarket — average credit score on applications, eviction rate, late-payment / NSF rate, and stable-employment percentage? A property-management company in the area should have these aggregated.
- How much new for-sale + rental construction is in the pipeline within 1–3 miles? Heavy new supply typically softens prices + rents 12–24 months out; constrained supply supports both.
Investment metrics
- 1% rule
- 0.85% ✗
- Cap rate
- 5.83%
- Cash-on-cash
- -1.66%
- DSCR
- 0.93
- GRM
- 9.8
CMA / ARV
- ARV (on-the-fly)
- $310,247
- Comps found
- 5
Show comp detail 5 sales within ~0.75 mi
| Address | Dist | Beds/Ba | Sqft | Sold | Price | $/sf | Match |
|---|---|---|---|---|---|---|---|
| 104 Leacock Dr | 0.45mi | 4/2.5 | 1,965 (+2%) | 6mo | $316,415 | $161 | 71 |
| 101 Leacock Dr | 0.46mi | 3/2.5 (-1) | 1,965 (+2%) | 2mo | $299,990 | $153 | 69 |
| 10 Torwood St | 0.38mi | 3/2.0 (-1) | 1,846 (-4%) | 2mo | $304,582 | $165 | 67 |
| 124 Beechcroft Pl | 0.27mi | 3/2.0 (-1) | 2,100 (+9%) | 1mo | $345,000 | $164 | 65 |
| 121 Roocroft Ct Lot 0099 | 0.14mi | 4/2.5 | 2,164 (+12%) | 13mo | $319,900 | $148 | 62 |
Match score weights: distance 35% · size 25% · config 20% · recency 20%. Top-matched comps best support the ARV.
Projected returns pro-forma
-3.0% appreciation · 4.55% rent growth · sell at horizon
- IRR
- -17.2%
- Equity multiple
- 0.38×
- Total profit
- $-52,932
- Equity at exit
- $45,611
- IRR
- -6.5%
- Equity multiple
- 0.55×
- Total profit
- $-38,141
- Equity at exit
- $26,449
Cash invested: $85,652 (down + closing). Projections, not guarantees.
Landlord ↔ Tenant lean methodology
- Overall (STATE)
- 90 Strongly Landlord-Friendly
- State South Carolina
- 90 Strongly Landlord-Friendly · R+6
- County
- — inherits STATE
- City
- — inherits STATE
ZIP-level market 29644
- Home prices YoY
- -28.6%
- Rents YoY
- 4.5%
- Active inventory
- 484
- Price-to-rent
- 9.8×
Monthly cashflow live
- Estimated rent
- $2,590 medium interval (Pro) →
- Mortgage (P&I)
- −$1,604
- Tax est. 1.5%
- −$382 /mo · $4,588/yr
- Insurance
- −$127
- HOA
- −$50
- Vacancy / Maint / Mgmt
- −$544
- Net cashflow
- $-118
Break-even live
Sensitivity live
| Price | -10% $93 | -5% $-13 | +0% $-118 | +5% $-224 | +10% $-330 |
|---|---|---|---|---|---|
| Rent | -10% $-323 | -5% $-221 | +0% $-118 | +5% $-16 | +10% $86 |
| Rate | -1.0pp $36 | -0.5pp $-40 | base $-118 | +0.5pp $-198 | +1.0pp $-278 |
UW: 25.0% down · 7.5% · 30yr · 1.5% tax · 5.0% vac · 8.0% maint · 8.0% mgmt
Financing live
Cash to close
- Down payment
- $76,475
- Closing costs
- $9,177
- Reserves months
- —
- Total cash needed
- —
Loan-product check · same deal, 3 products live
Conventional
25% down · 7.5% · 30yr
- Down + closing
- —
- Monthly P&I
- —
- Monthly cashflow
- —
- DSCR
- —
- Eligible?
- —
Personal DTI + credit; lowest rate.
DSCR
20% down · 8.5% · 30yr
- Down + closing
- —
- Monthly P&I
- —
- Monthly cashflow
- —
- DSCR
- —
- Eligible?
- —
No personal income docs; deal must DSCR.
Hard money
10% down · 12.0% · 12mo
- Down + closing
- —
- Monthly P&I
- —
- Monthly cashflow
- —
- DSCR
- —
- Eligible?
- —
Short-term bridge; refi at stabilization.
Rent comps 3 comps
| Address | Beds | Baths | Sqft | Rent | $/sqft | DOM | Units | Dist |
|---|---|---|---|---|---|---|---|---|
| 119 Cranford Rd Fountain Inn, SC | 4.0 | 3.0 | 2174 | $2,495 | $1.15 | 21d | 1 | 0.10mi |
| 4 Rockshire Trl Fountain Inn, SC | 3.0 | 2.5 | 1400 | $1,900 | $1.36 | 25d | 1 | 1.09mi |
| 101 Fennec Dr Fountain Inn, SC | 3.0 | 3.0 | 1735 | $2,099 | $1.21 | 5d | 1 | 1.29mi |
HOA detail
- Monthly dues
- $50 · $600/yr
Listing history 16 events
-
2026-06-22days on market $305,900 Active 26 DOM
-
2026-06-18days on market $305,900 Active 23 DOM
-
2026-06-17days on market $305,900 Active 22 DOM
-
2026-06-16days on market $305,900 Active 21 DOM
-
2026-06-15days on market $305,900 Active 20 DOM
-
2026-06-13days on market $305,900 Active 18 DOM
-
2026-06-13days on market $305,900 Active 17 DOM
-
2026-06-10days on market $305,900 Active 15 DOM
-
2026-06-09days on market $305,900 Active 14 DOM
-
2026-06-08days on market $305,900 Active 13 DOM
-
2026-06-07days on market $305,900 Active 12 DOM
-
2026-06-03days on market $305,900 Active 8 DOM
-
2026-06-03days on market $305,900 Active 7 DOM
-
2026-06-01days on market $305,900 Active 6 DOM
-
2026-05-31days on market $305,900 Active 5 DOM
-
2026-05-26$305,990 Active
ⓘ Source: listings_history table (triggers on properties + properties_extension) + one-shot
backfill from property_details.listing_events for pre-trigger history.
Climate risk First Street
- Flood 1/10 Low FEMA zone X (unshaded) · 0% chance over 30 yrs
- Wildfire 4/10 Moderate
- Heat 5/10 Major 7 d/yr ≥104°F today · 15 d/yr by 30 yrs out
- Wind 2/10 Low 3% chance of damaging wind over 30 yrs
- Air quality 3/10 Moderate 3 unhealthy d/yr today · 3 by 30 yrs out
Nearby sold comps map
Loading sold comps map…
Walkable amenities ~0.75 mi
Loading nearby amenities…
Taxation est. · year 1
- Rental income
- $31,074
- − Mortgage interest
- −$17,135
- − Property taxes
- −$4,588
- − Insurance
- −$1,530
- − Repairs & maintenance
- −$2,486
- − Management
- −$2,486
- − HOA
- −$600
- − Depreciation
- −$8,899
- Taxable loss
- −$6,650
- Est. tax savings @ 24.0%
- +$1,596
- After-tax cash flow
- $177/yr
For passive investors: Depreciation is non-cash, so a rental often shows a tax loss while cash-flowing — sheltering income. Rental losses are passive: they offset passive income freely, and up to $25,000/yr can offset ordinary (W-2) income if you actively participate and your MAGI is under $100k (phasing out to $0 by $150k); unused losses carry forward. On sale, claimed depreciation is recaptured at up to 25%, and gains may owe capital-gains tax (a 1031 exchange can defer both). Figures are a year-1 estimate at your 24.0% rate — not tax advice; consult a CPA.
Condition & rehab AI · 4 photos
This stunning new home in the Cedar Gap community is move-in ready with excellent condition and a well-maintained exterior and interior. The spacious layout and modern kitchen make it ideal for both everyday living and entertaining guests. The swimming pool and landscaping add to its appeal and value.
Value-add opportunities
- Both Landscaping improvements — Enhanced landscaping can improve curb appeal and attract more potential buyers or renters.
- Both Swimming pool maintenance — A well-maintained pool can be a significant selling point for both resale and rental properties.
Renovation cost estimate screening
Value-add ROI direction
- Both Landscaping improvements — Enhanced landscaping can improve curb appeal and attract more potential buyers or renters. ↑
- Both Swimming pool maintenance — A well-maintained pool can be a significant selling point for both resale and rental properties. ↑
ⓘ Cost ranges are severity-bucket heuristics (US national rule-of-thumb). Get contractor quotes + a written scope before underwriting a rehab budget.
Schools (NCES district)
- District
- Greenville 01
- NCES district ID
- 4502310
- Math proficiency
- 44% ▼ -10.00%
- Reading proficiency
- 54% ▼ -2.00%
- Median HH income
- $49,596
- Composite
- 41.88/100
- National rank
- #3370
- State rank
- #10 of 80 in SC
Livability — Fountain Inn
- Score
- 82/100
- State rank
- #4
- US rank
- #1162
Category grades
Schools grade is shown separately in the Schools card above.
Census & demographics
- Census place
- Fountain Inn, SC
- County
- Greenville County · 573,815 people
- City population
- 22,907
- Metro
- Greenville-Anderson, SC
- Population (ZIP)
- 22,907
- Household income
- $70,301
- Rent vs Own
- Severe rent burden
- 475.0
Population outlook (Greenville County) Hauer SSP2
- Today (2025)
- 574,580 people
- By 2030
- 615,615 · +7.1%
- By 2040
- 695,373 · +21.0%
- By 2050
- 769,367 · +33.9%
- By 2075
- 933,296 · +62.4%
- By 2100
- 1,029,196 · +79.1%
Race, ethnicity, and origin ACS 2023
- Neighborhood character
- Predominantly White (66%)
- Race & ethnicity
- White 66% Black 18% Two or more races 10% Hispanic / Latino 10%
- Hispanic origin (detail)
- Mexican 3% Puerto Rican 2%
- Common ancestry
- Slovak 3% Romanian 2% Lithuanian 2%
- Foreign-born
- 6% · Canada, Jamaica
- Languages at home
- 89% English-only · Spanish 9% Tagalog/Filipino 1%
Political lean MEDSL · Greenville
- 2024 margin
- Strong R (+22.2) · D 38.0% · R 60.2% · Other 1.8%
- 2008→2024 swing
- +1.7pp toward D · 2008: -23.9pp · 2024: -22.2pp
- All cycles
- 2024: R+22.2 2020: R+18.2 2016: R+24.7 2012: R+27.8 2008: R+23.9
Not yet ingested
- Civics
- —
Market trends
- HPI YoY
- ▼ -100.45%
- Current HPI
- 250.5271
- Rent YoY
- ▲ 4.55%
- Metro
- Greenville-Anderson, SC
- State GDP YoY
- ▲ 4.51%
- F500 in state
- 2
Industry mix (Fortune 500 HQ in SC)
| Industry | F500 HQs | Revenue |
|---|---|---|
| Packaging | 1 | $7B |
|
||
Price history
1 event — show timeline
- 2026-05-26 Listed $305,990 Greater Greenville MLS
Cash-flow waterfall
monthlySold comps — $/sqft
last 12 mo · ≤1 miLoading sold comps…