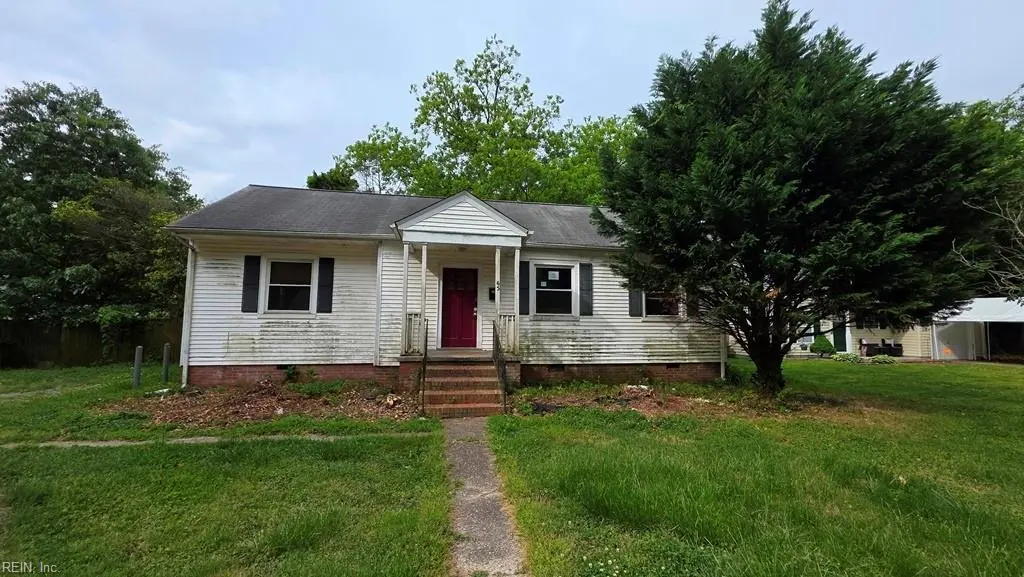
65 Cavalier Rd · Hampton, VA
Flood risk 6/10 · Moderate
- FEMA flood zone
- X (unshaded)
- Chance of flooding over 30 yrs
- 0.54%
- Est. flood insurance / yr
- $473 – $860
Fire risk 1/10 · Minimal
- Est. fire insurance / yr
- $666 – $1,236
Heat risk 9/10 · Severe
- Hot days now (above 104°F)
- 7 days/yr
- Hot days in 30 yrs
- 16 days/yr
Wind risk 8/10 · Major
- Chance of severe wind over 30 yrs
- 80.0%
Air-quality risk 2/10 · Minimal
- Unhealthy air days now
- 1 days/yr
- Unhealthy air days in 30 yrs
- 2 days/yr
Risk factors via First Street. Map © Google.
Why this score? — see what drove the B+ grade
The composite is a weighted blend of 9 inputs, each scored 0–100. Each bar is that input's sub-score; the figure is the points it added to the 100-point composite (weight × sub-score).
- Cash flow +28.8/30.0
- ARV discount +15.0/15.0
- DSCR +10.0/10.0
- 1% rule +8.5/10.0
- Schools +5.5/10.0
- Rent growth +3.9/5.0
- Livability +3.8/5.0
- Condition / age +2.5/5.0
- Appreciation +0.0/10.0
$129,000
🖨 Deal sheet (PDF) 📄 Offer letter ✓ Due diligence
Listing remarks
Located at 65 Cavalier Rd in Hampton, this 1943 ranch-style home offers functional single-level living on a spacious 0.22-acre corner lot. The interior features approximately 1,100 square feet of living space, including 3 bedrooms and 2 full bathrooms. The layout is designed for efficiency, highlighted by a primary suite with a walk-in closet and a mix of hardwood and laminate flooring. Essential appliances are included in the kitchen, and the home is equipped with central cooling and heating for year-round comfort. Outside, the oversized lot provides ample space for gardening or recreation in an established neighborhood. This property is conveniently positioned near Langley Air Force Base,
Key facts
- Walk-in closet
- Primary suite
- Oversized lot
Tags
Property features AI
Finance
- HOA & community: No HOA fees indicated
Exterior
- Parking: Driveway parking
- Utilities: City/County water; City/County sewer; Electric water heater; Electric power (implied by electric appliances)
- Home design: Detached ranch-style home; Single-story
- Construction: Vinyl siding; Asphalt shingle roof; Crawl foundation; Built on a 0.2222-acre lot (approx.), lot dimensions about 121 x 80
- Exterior features: Corner lot; Privacy wood fence; Storage shed
Interior
- Kitchen: Electric range; Microwave; Dishwasher; Refrigerator
- Bedrooms: Bedroom with full bathroom on the first floor
- Flooring: Carpet; Ceramic; Laminate; Wood
- Bathrooms: 2 full bathrooms
- Heating & cooling: Heat pump heating; Central air conditioning
- Interior features: Carpet, ceramic, laminate, and wood flooring
- Laundry & utility: Washer hookup; Dryer hookup; Electric water heater
Neighborhood map
What this means for you Summary
Snapshot
- This is a 3-bed/2.0-bath single-family listed at $129k.
Deal economics
- At list price, monthly cash flow is $433 ($5k/yr) — positive.
- The deal already cash-flows at list — no discount required.
- Meets the 1% rule at list price ($2k rent vs $129k).
- Recommended offer: $127k (1.5% below list) — sets the bar for market timing.
- Cap rate 10.3% vs local median 4.5% in Hampton — top-decile yield for the area; either an underpriced asset or a hidden risk that comps aren't pricing in. Stress-test before assuming the spread holds.
Location & tenants
- Location reads 75/100 on livability (#133 in VA, #4,302 nationally) — a middle-class / working-renter tenant base. Strengths: housing A+, health & safety A+, cost of living A; Watch: crime C-, amenities D+, commute F.
- Hampton City Public School District (urban): math 60% / reading 70% proficiency, ranked #40 of 131 in VA (top 30%) — acceptable for families but not a draw, mixed tenant base, ~2y average lease.
- Zoned schools: Captain John Smith Elementary (math 42% / reading 57%, grade D, #742 of 1,108 statewide, top 70%, 393 students, 82% FRL); Kecoughtan High (math 68% / reading 87%, grade A-, #83 of 319 statewide, top 28%, 1,564 students, 86% FRL) — zoned schools average 84% FRL vs 49% district-wide (35 pts higher); higher-poverty schools than district average — tighter screening recommended.
- Market conditions: Rents rising fast (+5.4%/yr); 232 active listings in the ZIP; 30 comparable units currently listed for rent nearby; rentals at typical pace (median 16d on market — plan ~3-4 weeks tenant-placement turnaround); 68 units permitted in Hampton city in 2024 (0 in 5+ unit buildings).
Forward outlook
- Local home prices are declining (-3.0%/yr); year-one equity from $892 of loan paydown is wiped out by about $4k of value loss. Plan a longer hold.
- Hampton County population projected at -13% by 2050 — secular population decline; favor cash flow + early exit over multi-decade hold.
- At projected returns (-3.0% appreciation + 5.4% rent growth), your $36k cash investment doubles in ~7 years — after that, you're playing with house money.
Negotiation context
- It's been on market 23 days — a 2% lower offer ($127k) is reasonable based on typical stale-listing flexibility.
- 3 sale attempts since 9y ago with the ask held roughly flat each time — persistent listings suggest the price (not the market) is what's stuck; bring a comps-based counter.
Risks & watch-outs
- Watch-outs: built in 1943 — expect roof / HVAC / electrical / plumbing capex.
- Climate carrying-cost: major flood risk; severe wind risk, 80% chance of damaging wind over 30y; extreme-heat days projected 7→16/yr by 2055 (HVAC capex compounding) — expect insurance premiums to compound above CPI over the hold.
Questions for the listing agent
- Built in 1943 — when were the roof, HVAC, electrical panel, plumbing, and water heater last replaced?
- Is there a deadline driving the sale (1031 exchange, divorce, estate, relocation)? That informs how much negotiation room exists.
- Schools are B-rated — typically a magnet for longer-tenancy family renters. What's the average tenant stay here, and is there a school-zone premium baked into asking?
- What's the average days-on-market for RENTAL listings here right now (not sales)? A rising rental-DOM trend means longer vacancies and softer asking-rent achievability than the comps imply.
- What's the recent tenant-quality profile in this submarket — average credit score on applications, eviction rate, late-payment / NSF rate, and stable-employment percentage? A property-management company in the area should have these aggregated.
- How much new for-sale + rental construction is in the pipeline within 1–3 miles? Heavy new supply typically softens prices + rents 12–24 months out; constrained supply supports both.
Investment metrics
- 1% rule
- 1.35% ✓
- Cap rate
- 10.32%
- Cash-on-cash
- 14.39%
- DSCR
- 1.64
- GRM
- 6.2
CMA / ARV
- ARV (median comp)
- $227,431
- List price
- $129,000
- Delta
- -43.28%
- Verdict
- UNDERPRICED
- Comps
- 20 within 1.0 mi
Show comp detail 12 sales within ~0.75 mi
| Address | Dist | Beds/Ba | Sqft | Sold | Price | $/sf | Match |
|---|---|---|---|---|---|---|---|
| 65 Cavalier Rd | 0.00mi | 3/2.0 | 1,070 (0%) | 0mo | $151,500 | $142 | 100 |
| 132 Roland Dr | 0.46mi | 3/1.0 | 1,080 (+1%) | 2mo | $100,000 | $93 | 71 |
| 38 Saint Albans Dr | 0.32mi | 3/1.0 | 1,125 (+5%) | 2mo | $255,000 | $227 | 71 |
| 119 Rosewood Dr | 0.59mi | 3/2.0 | 1,050 (-2%) | 1mo | $275,000 | $262 | 68 |
| 5 Kingslee Ln | 0.54mi | 3/1.5 | 1,100 (+3%) | 1mo | $274,500 | $250 | 67 |
| 40 Crestwood Cir | 0.59mi | 3/1.0 | 1,103 (+3%) | 2mo | $196,000 | $178 | 62 |
| 2 Boeing Ave | 0.63mi | 3/1.0 | 1,047 (-2%) | 2mo | $165,000 | $158 | 61 |
| 105 Glenwood Rd | 0.60mi | 3/2.0 | 1,160 (+8%) | 2mo | $272,000 | $234 | 57 |
| 218 Pine Grove Ave | 0.33mi | 3/1.0 | 909 (-15%) | 0mo | $250,000 | $275 | 55 |
| 215 Courtney Dr | 0.64mi | 3/1.0 | 1,000 (-6%) | 1mo | $160,000 | $160 | 54 |
| 22 Lucas Dr | 0.74mi | 2/1.0 (-1) | 1,032 (-4%) | 3mo | $229,000 | $222 | 48 |
| 9 Lucas Dr | 0.70mi | 2/2.0 (-1) | 950 (-11%) | 2mo | $260,000 | $274 | 42 |
Match score weights: distance 35% · size 25% · config 20% · recency 20%. Top-matched comps best support the ARV.
Projected returns pro-forma
-3.0% appreciation · 5.44% rent growth · sell at horizon
- IRR
- 7.6%
- Equity multiple
- 1.31×
- Total profit
- $11,132
- Equity at exit
- $19,234
- IRR
- 19.0%
- Equity multiple
- 2.78×
- Total profit
- $64,398
- Equity at exit
- $11,154
Cash invested: $36,120 (down + closing). Projections, not guarantees.
Landlord ↔ Tenant lean methodology
- Overall (STATE)
- 55 Moderately Landlord-Leaning
- State Virginia
- 55 Moderately Landlord-Leaning · D+2
- County
- — inherits STATE
- City
- — inherits STATE
ZIP-level market 23669
- Rents YoY
- 5.4%
- Active inventory
- 232
- Price-to-rent
- 6.2×
Monthly cashflow live
- Estimated rent
- $1,746 high interval (Pro) →
- Mortgage (P&I)
- −$676
- Tax from tax record
- −$216 /mo · $2,591/yr
- Insurance
- −$54
- HOA
- −$0
- Vacancy / Maint / Mgmt
- −$367
- Net cashflow
- $433
Break-even live
Sensitivity live
| Price | -10% $506 | -5% $470 | +0% $433 | +5% $397 | +10% $360 |
|---|---|---|---|---|---|
| Rent | -10% $295 | -5% $364 | +0% $433 | +5% $502 | +10% $571 |
| Rate | -1.0pp $498 | -0.5pp $466 | base $433 | +0.5pp $400 | +1.0pp $366 |
UW: 25.0% down · 7.5% · 30yr · 1.5% tax · 5.0% vac · 8.0% maint · 8.0% mgmt
Financing live
Cash to close
- Down payment
- $32,250
- Closing costs
- $3,870
- Reserves months
- —
- Total cash needed
- —
Loan-product check · same deal, 3 products live
Conventional
25% down · 7.5% · 30yr
- Down + closing
- —
- Monthly P&I
- —
- Monthly cashflow
- —
- DSCR
- —
- Eligible?
- —
Personal DTI + credit; lowest rate.
DSCR
20% down · 8.5% · 30yr
- Down + closing
- —
- Monthly P&I
- —
- Monthly cashflow
- —
- DSCR
- —
- Eligible?
- —
No personal income docs; deal must DSCR.
Hard money
10% down · 12.0% · 12mo
- Down + closing
- —
- Monthly P&I
- —
- Monthly cashflow
- —
- DSCR
- —
- Eligible?
- —
Short-term bridge; refi at stabilization.
Rent comps 30 comps
| Address | Beds | Baths | Sqft | Rent | $/sqft | DOM | Units | Dist |
|---|---|---|---|---|---|---|---|---|
| 450 Cedar Dr Hampton, VA | 3.0 | 1.0 | 912 | $1,500 | $1.64 | 12d | 1 | 0.10mi |
| 109 Peachtree Ln Hampton, VA | 3.0 | 2.0 | 984 | $1,795 | $1.82 | 15d | 1 | 0.10mi |
| 24 Cavalier Rd Hampton, VA | 3.0 | 2.0 | 1014 | $1,850 | $1.82 | 4d | 1 | 0.21mi |
| 212 Pine Grove Ave Hampton, VA | 2.0 | 1.0 | 720 | $1,500 | $2.08 | 24d | 1 | 0.32mi |
| 28 Monroe Dr Hampton, VA | 3.0 | 1.0 | 1110 | $1,600 | $1.44 | 44d | 1 | 0.40mi |
| 105 Roland Dr Hampton, VA | 2.0 | 1.0 | 750 | $1,250 | $1.67 | 15d | 1 | 0.43mi |
| 13 Beverly St Hampton, VA | 3.0 | 1.0 | 1050 | $1,800 | $1.71 | 5d | 1 | 0.60mi |
| 13 W Lamington Rd Hampton, VA | 3.0 | 1.5 | 1415 | $2,050 | $1.45 | 44d | 1 | 0.60mi |
| 232 W Gilbert St Hampton, VA | 1.0–2.0 | 1.0 | 767 | $1,371 | $1.79 | 2d | 1 | 0.61mi |
| 19 Bernard Ave Hampton, VA | 2.0 | 1.0 | 906 | $995 | $1.10 | 22d | 1 | 0.72mi |
| 12 Clemwood Pkwy Hampton, VA | 3.0 | 2.0 | 1200 | $1,745 | $1.45 | 24d | 1 | 0.74mi |
| 323 Roane Dr Hampton, VA | 3.0 | 1.0 | 974 | $1,495 | $1.53 | 4d | 1 | 0.76mi |
| 17 S Gawain Way Hampton, VA | 3.0 | 1.5 | 1460 | $1,895 | $1.30 | 3d | 1 | 0.76mi |
| 31 Saxony Pl Hampton, VA | 3.0 | 2.5 | 1315 | $1,645 | $1.25 | 18d | 1 | 0.81mi |
| 8 Rip Rap Rd Hampton, VA | 2.0 | 1.0 | 1000 | $1,200 | $1.20 | 22d | 1 | 0.86mi |
| 1563 N King St Hampton, VA | 2.0 | 2.0 | 1087 | $1,612 | $1.48 | 24d | 2 | 0.89mi |
| 1568 N King St Hampton, VA | 1.0–2.0 | 1.0 | 634 | $1,425 | $2.25 | 2d | 17 | 0.90mi |
| 1105 Easterly Ave Hampton, VA | 3.0 | 1.5 | 1204 | $1,800 | $1.50 | 15d | 1 | 0.91mi |
| 1563 N King St Unit 105 Hampton, VA | 2.0 | 2.0 | 1087 | $1,675 | $1.54 | 44d | 1 | 0.91mi |
| 212 Dockside Dr Unit B Hampton, VA | 2.0 | 2.0 | 1253 | $1,795 | $1.43 | 44d | 1 | 0.97mi |
| 102 Tyburn Ct Hampton, VA | 3.0 | 2.5 | 1500 | $2,000 | $1.33 | 13d | 1 | 0.98mi |
| 100 Spanish Trl Hampton, VA | 1.0–2.0 | 1.0–1.5 | 812 | $1,450 | $1.79 | 2d | 12 | 1.04mi |
| 1711 N King St Unit 18 Hampton, VA | 2.0 | 1.0 | 815 | $1,425 | $1.75 | 44d | 1 | 1.04mi |
| 132 Tide Mill Ln Hampton, VA | 2.0 | 1.5 | 1000 | $1,550 | $1.55 | 2d | 1 | 1.34mi |
| 1115 E Pembroke Ave Hampton, VA | 2.0 | 1.0 | 850 | $1,275 | $1.50 | 2d | 1 | 1.35mi |
| 19 Magnolia Pl Hampton, VA | 3.0 | 1.5 | 1405 | $2,100 | $1.49 | 15d | 1 | 1.36mi |
| 1802 Moger Dr Hampton, VA | 3.0 | 1.0 | 900 | $1,700 | $1.89 | 13d | 1 | 1.37mi |
| 2001 Grimes Rd Hampton, VA | 4.0 | 2.0 | 1430 | $2,100 | $1.47 | 3d | 1 | 1.41mi |
| 305 Old Point Ave Hampton, VA | 3.0 | 1.0 | 1186 | $1,750 | $1.48 | 44d | 1 | 1.46mi |
| 234 Washington St Hampton, VA | 2.0 | 1.0 | 1111 | $2,000 | $1.80 | 11d | 1 | 1.49mi |
Listing history 11 events
-
2026-05-11historical Active Under Contract 959-char remark
-
2026-05-04$129,000 Active 959-char remark
-
2018-03-05soldstatus $140,000
-
2018-02-19status Under Contract
-
2018-01-05price $140,000
-
2017-12-09$145,000 Active
-
2017-12-08historical
-
2017-10-27price $146,900
-
2017-10-05price $147,500
-
2017-09-10$150,000 Active
-
2007-08-21soldstatus $170,000
ⓘ Source: listings_history table (triggers on properties + properties_extension) + one-shot
backfill from property_details.listing_events for pre-trigger history.
Tax reassessment forecast VA · Resets to sale price
- Current annual tax
- $2,591 · $216/mo
- Projected year-2 tax
- $2,591 · $216/mo
- Expected delta
- $0/yr ($0/mo · 0.0%)
ⓘ Screening estimate from a state-policy table — verify with the county assessor before closing.
Climate risk First Street
- Flood 6/10 Major FEMA zone X (unshaded) · 54% chance over 30 yrs
- Wildfire 1/10 Low
- Heat 9/10 Extreme 7 d/yr ≥104°F today · 16 d/yr by 30 yrs out
- Wind 8/10 Severe 80% chance of damaging wind over 30 yrs
- Air quality 2/10 Low 1 unhealthy d/yr today · 2 by 30 yrs out
Nearby sold comps map
Loading sold comps map…
Walkable amenities ~0.75 mi
Loading nearby amenities…
Taxation est. · year 1
- Rental income
- $20,951
- − Mortgage interest
- −$7,226
- − Property taxes
- −$2,591
- − Insurance
- −$645
- − Repairs & maintenance
- −$1,676
- − Management
- −$1,676
- − Depreciation
- −$3,753
- Taxable income
- $3,384
- Est. tax owed @ 24.0%
- −$812
- After-tax cash flow
- $4,385/yr
For passive investors: Depreciation is non-cash, so a rental often shows a tax loss while cash-flowing — sheltering income. Rental losses are passive: they offset passive income freely, and up to $25,000/yr can offset ordinary (W-2) income if you actively participate and your MAGI is under $100k (phasing out to $0 by $150k); unused losses carry forward. On sale, claimed depreciation is recaptured at up to 25%, and gains may owe capital-gains tax (a 1031 exchange can defer both). Figures are a year-1 estimate at your 24.0% rate — not tax advice; consult a CPA.
Schools (NCES district)
- District
- Hampton City Public School District
- NCES district ID
- 5101800
- Math proficiency
- 60% ▼ -21.00%
- Reading proficiency
- 70% ▼ -4.00%
- Median HH income
- $50,089
- Composite
- 55.19/100
- National rank
- #1272
- State rank
- #40 of 131 in VA
Livability — Hampton
- Score
- 75/100
- State rank
- #133
- US rank
- #4302
Category grades
Schools grade is shown separately in the Schools card above.
Census & demographics
- Census place
- Hampton, VA
- County
- Hampton City · 132,421 people
- City population
- 132,421
- Metro
- Virginia Beach-Norfolk-Newport News, VA-NC
- Population (ZIP)
- 39,884
- Household income
- $71,222
- Rent vs Own
- Severe rent burden
- 2130.0
Population outlook (Hampton County) Hauer SSP2
- Today (2025)
- 134,055 people
- By 2030
- 131,753 · -1.7%
- By 2040
- 125,017 · -6.7%
- By 2050
- 116,825 · -12.9%
- By 2075
- 97,033 · -27.6%
- By 2100
- 76,188 · -43.2%
Race, ethnicity, and origin ACS 2023
- Neighborhood character
- Diverse neighborhood (Simpson 0.63)
- Race & ethnicity
- Black 46% White 39% Two or more races 9% Hispanic / Latino 6% Asian 2%
- Hispanic origin (detail)
- Mexican 1% Puerto Rican 2%
- Common ancestry
- Slovak 2% Italian 1% Romanian 1%
- Foreign-born
- 4% · Canada
- Languages at home
- 95% English-only · Spanish 3% Other Asian/Pacific 1%
Political lean MEDSL · Hampton
- 2024 margin
- Solid D (+39.9) · D 69.2% · R 29.4% · Other 1.4%
- 2008→2024 swing
- +1.0pp no change · 2008: 38.9pp · 2024: 39.9pp
- All cycles
- 2024: D+39.9 2020: D+42.2 2016: D+37.8 2012: D+45.4 2008: D+38.9
Not yet ingested
- Civics
- —
Market trends
- HPI YoY
- ▼ -150.40%
- Current HPI
- 276.4636
- Rent YoY
- ▲ 5.44%
- Metro
- Virginia Beach-Norfolk-Newport News, VA-NC
- State GDP YoY
- ▲ 2.40%
- F500 in state
- 50
Industry mix (Fortune 500 HQ in VA)
| Industry | F500 HQs | Revenue |
|---|---|---|
| Aerospace / Defense | 4 | $236B |
|
||
| Technology / Defense | 3 | $32B |
|
||
| Financial Services | 2 | $176B |
|
||
| Utilities | 2 | $27B |
|
||
| Insurance | 2 | $25B |
|
||
| Technology | 2 | $15B |
|
||
Price history
-10.9% since first listed13 events — show timeline
- 2026-06-08 Sold (MLS) $151,500 REINMLS
- 2026-05-27 Pending — REINMLS
- 2026-05-11 Contingent — REINMLS
- 2026-05-04 Listed $129,000 REINMLS
- 2018-03-05 Sold (Public Records) $140,000 Public Records
- 2018-02-19 Pending — REINMLS
- 2018-01-05 Price Changed $140,000 REINMLS
- 2017-12-09 Listed $145,000 REINMLS
- 2017-12-08 Listing Removed — REINMLS
- 2017-10-27 Price Changed $146,900 REINMLS
- 2017-10-05 Price Changed $147,500 REINMLS
- 2017-09-10 Listed $150,000 REINMLS
- 2007-08-21 Sold (Public Records) $170,000 Public Records
Property tax history
+9.4%/yrLatest (2025): $2,591 · +3.8% YoY. Source: county tax records.
Cash-flow waterfall
monthlySold comps — $/sqft
last 12 mo · ≤1 miLoading sold comps…