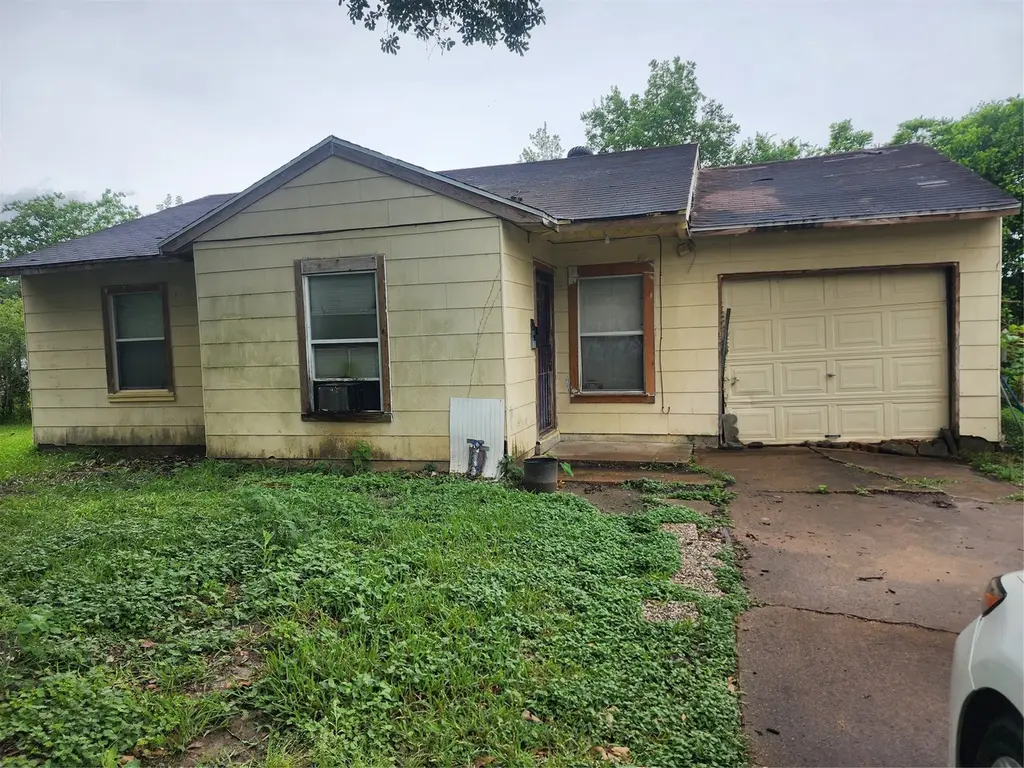
6428 Sherwood Dr · Houston, TX
Flood risk 6/10 · Moderate
- FEMA flood zone
- X (unshaded)
- Chance of flooding over 30 yrs
- 0.68%
- Est. flood insurance / yr
- $507 – $1,088
Fire risk 1/10 · Minimal
- Est. fire insurance / yr
- $1,222 – $2,270
Heat risk 9/10 · Severe
- Hot days now (above 109°F)
- 7 days/yr
- Hot days in 30 yrs
- 24 days/yr
Wind risk 9/10 · Severe
- Chance of severe wind over 30 yrs
- 99.0%
Air-quality risk 2/10 · Minimal
- Unhealthy air days now
- 2 days/yr
- Unhealthy air days in 30 yrs
- 2 days/yr
Risk factors via First Street. Map © Google.
Why this score? — see what drove the B grade
The composite is a weighted blend of 9 inputs, each scored 0–100. Each bar is that input's sub-score; the figure is the points it added to the 100-point composite (weight × sub-score).
- Cash flow +29.3/30.0
- ARV discount +15.0/15.0
- DSCR +10.0/10.0
- 1% rule +8.5/10.0
- Livability +3.7/5.0
- Rent growth +3.0/5.0
- Schools +2.7/10.0
- Condition / age +2.5/5.0
- Appreciation +0.0/10.0
$120,000
🖨 Deal sheet (PDF) 📄 Offer letter ✓ Due diligence
Listing remarks
GREAT VALUE FOR THE LAND AND THE AREA. Calling all investors!!! Motivated seller!
Key facts
- 5,998 sq ft lot
- Built 1952
- Listed 27 days
Property features AI
Exterior
- Utilities: Public water
- Home design: Residential property; Built in 1952; Single-story (entry level: first floor)
- Construction: Wood siding exterior; Composition roof; Slab foundation
- Exterior features: Subdivision lot
Interior
- Bedrooms: Three bedrooms on the first floor (approx. 13 x 13, 13 x 12, and 14 x 14)
- Bathrooms: 1 full bathroom
- Heating & cooling: Central heating (electric); Window unit cooling
- Interior features: 3 total rooms; Seller disclosure provided
Neighborhood map
What this means for you Summary
Snapshot
- This is a 3-bed/1.0-bath single-family listed at $120k.
Deal economics
- At list price, monthly cash flow is $423 ($5k/yr) — positive.
- The deal already cash-flows at list — no discount required.
- Meets the 1% rule at list price ($2k rent vs $120k).
- Recommended offer: $118k (1.5% below list) — sets the bar for market timing.
- Cap rate 10.5% vs local median 3.2% in Houston — top-decile yield for the area; either an underpriced asset or a hidden risk that comps aren't pricing in. Stress-test before assuming the spread holds.
Location & tenants
- Location reads 74/100 on livability (#184 in TX, #4,771 nationally) — a middle-class / working-renter tenant base. Strengths: amenities A+, cost of living A+, housing A+; Watch: crime F.
- Houston ISD (urban): math 27% / reading 35% proficiency, ranked #593 of 826 in TX (top 72%) — families likely to look elsewhere, expect single-tenant / working-renter base with shorter leases; 71% free/reduced lunch — lower-income household profile, screen leases tightly.
- Zoned schools: Cullen Middle (math 6% / reading 14%, grade F, #1,641 of 1,662 statewide, top 99%, 324 students, 100% FRL); Yates H S (math 12% / reading 23%, grade F, #1,451 of 1,632 statewide, top 89%, 851 students, 96% FRL) — zoned schools average 98% FRL vs 71% district-wide (27 pts higher); higher-poverty schools than district average — tighter screening recommended.
- Zoned-school proficiency averages 14% at this address vs 31% district-wide (-17 pts) — the specific schools serving this property underperform the Houston ISD average; the district grade overstates school quality for this exact location.
- Market conditions: Rents rising (+2.2%/yr); 467 active listings in the ZIP; 40 comparable units currently listed for rent nearby; rentals at typical pace (median 17d on market — plan ~3-4 weeks tenant-placement turnaround); 29,883 units permitted in Harris County in 2024 (8,621 in 5+ unit buildings).
- This rent runs 43% of the median local income ($46k/yr) — at the standard rent-burdened threshold; future hikes will face affordability resistance.
Forward outlook
- Local home prices are declining (-3.0%/yr); year-one equity from $830 of loan paydown is wiped out by about $4k of value loss. Plan a longer hold.
- Harris County population projected at +47% by 2050 — long-run rental-demand tailwind backs the buy-and-hold thesis.
- At projected returns (-3.0% appreciation + 2.2% rent growth), your $34k cash investment doubles in ~9 years — after that, you're playing with house money.
Negotiation context
- It's been on market 27 days — a 2% lower offer ($118k) is reasonable based on typical stale-listing flexibility.
Risks & watch-outs
- Watch-outs: built in 1952 — expect roof / HVAC / electrical / plumbing capex.
- Climate carrying-cost: major flood risk; severe wind risk, 99% chance of damaging wind over 30y; extreme-heat days projected 7→24/yr by 2055 (HVAC capex compounding) — expect insurance premiums to compound above CPI over the hold.
Questions for the listing agent
- Built in 1952 — when were the roof, HVAC, electrical panel, plumbing, and water heater last replaced?
- Is there a deadline driving the sale (1031 exchange, divorce, estate, relocation)? That informs how much negotiation room exists.
- Schools are D-rated, which usually means shorter tenancies and higher turnover. Who's the typical renter profile here, and what's been the actual vacancy rate?
- Crime grade is F in this area — have there been break-ins, vandalism, or insurance claims at this property in the last 3 years? What carrier currently insures it and at what premium?
- What's the average days-on-market for RENTAL listings here right now (not sales)? A rising rental-DOM trend means longer vacancies and softer asking-rent achievability than the comps imply.
- What's the recent tenant-quality profile in this submarket — average credit score on applications, eviction rate, late-payment / NSF rate, and stable-employment percentage? A property-management company in the area should have these aggregated.
- How much new for-sale + rental construction is in the pipeline within 1–3 miles? Heavy new supply typically softens prices + rents 12–24 months out; constrained supply supports both.
Investment metrics
- 1% rule
- 1.35% ✓
- Cap rate
- 10.52%
- Cash-on-cash
- 15.11%
- DSCR
- 1.67
- GRM
- 6.2
CMA / ARV
- ARV (on-the-fly)
- $172,568
- Comps found
- 12
Show comp detail 12 sales within ~0.75 mi
| Address | Dist | Beds/Ba | Sqft | Sold | Price | $/sf | Match |
|---|---|---|---|---|---|---|---|
| 6103 Sherwood Dr | 0.33mi | 3/1.0 | 1,056 (-9%) | 1mo | $115,000 | $109 | 68 |
| 6719 Goforth St | 0.39mi | 3/1.0 | 1,075 (-8%) | 3mo | $130,000 | $121 | 66 |
| 6320 Paris St | 0.58mi | 3/2.0 | 1,089 (-7%) | 0mo | $230,000 | $211 | 58 |
| 6427 Paris St | 0.59mi | 3/2.0 | 1,089 (-7%) | 0mo | $205,000 | $188 | 57 |
| 3731 Alberta St | 0.30mi | 3/1.0 | 1,002 (-14%) | 7mo | $110,000 | $110 | 57 |
| 3523 Tampa St | 0.72mi | 2/1.0 (-1) | 1,149 (-2%) | 6mo | $169,990 | $148 | 54 |
| 3631 Wyoming St | 0.51mi | 4/2.0 (+1) | 1,090 (-6%) | 5mo | $265,000 | $243 | 52 |
| 4521 Kingsbury St | 0.66mi | 3/2.0 | 1,100 (-6%) | 7mo | $214,900 | $195 | 50 |
| 7121 England St | 0.68mi | 3/1.0 | 1,296 (+11%) | 1mo | $139,900 | $108 | 49 |
| 4523 Keystone St | 0.64mi | 3/2.0 | 1,073 (-8%) | 4mo | $195,000 | $182 | 49 |
| 7129 Foster St | 0.75mi | 2/1.0 (-1) | 1,107 (-5%) | 5mo | $120,000 | $108 | 48 |
| 4526 Kingsbury St St | 0.67mi | 3/1.0 | 1,049 (-10%) | 9mo | $119,000 | $113 | 45 |
Match score weights: distance 35% · size 25% · config 20% · recency 20%. Top-matched comps best support the ARV.
Projected returns pro-forma
-3.0% appreciation · 2.17% rent growth · sell at horizon
- IRR
- 4.8%
- Equity multiple
- 1.18×
- Total profit
- $6,200
- Equity at exit
- $17,892
- IRR
- 13.5%
- Equity multiple
- 2.04×
- Total profit
- $34,844
- Equity at exit
- $10,375
Cash invested: $33,600 (down + closing). Projections, not guarantees.
Landlord ↔ Tenant lean methodology
- Overall (STATE)
- 87 Strongly Landlord-Friendly
- State Texas
- 87 Strongly Landlord-Friendly · R+5
- County
- — inherits STATE
- City
- — inherits STATE
ZIP-level market 77021
- Home prices YoY
- -23.6%
- Rents YoY
- 2.2%
- Active inventory
- 467
- Price-to-rent
- 6.2×
Monthly cashflow live
- Estimated rent
- $1,625 high interval (Pro) →
- Mortgage (P&I)
- −$629
- Tax from tax record
- −$181 /mo · $2,174/yr
- Insurance
- −$50
- HOA
- −$0
- Vacancy / Maint / Mgmt
- −$341
- Net cashflow
- $423
Break-even live
Sensitivity live
| Price | -10% $491 | -5% $457 | +0% $423 | +5% $389 | +10% $355 |
|---|---|---|---|---|---|
| Rent | -10% $295 | -5% $359 | +0% $423 | +5% $487 | +10% $551 |
| Rate | -1.0pp $484 | -0.5pp $454 | base $423 | +0.5pp $392 | +1.0pp $360 |
UW: 25.0% down · 7.5% · 30yr · 1.5% tax · 5.0% vac · 8.0% maint · 8.0% mgmt
Financing live
Cash to close
- Down payment
- $30,000
- Closing costs
- $3,600
- Reserves months
- —
- Total cash needed
- —
Loan-product check · same deal, 3 products live
Conventional
25% down · 7.5% · 30yr
- Down + closing
- —
- Monthly P&I
- —
- Monthly cashflow
- —
- DSCR
- —
- Eligible?
- —
Personal DTI + credit; lowest rate.
DSCR
20% down · 8.5% · 30yr
- Down + closing
- —
- Monthly P&I
- —
- Monthly cashflow
- —
- DSCR
- —
- Eligible?
- —
No personal income docs; deal must DSCR.
Hard money
10% down · 12.0% · 12mo
- Down + closing
- —
- Monthly P&I
- —
- Monthly cashflow
- —
- DSCR
- —
- Eligible?
- —
Short-term bridge; refi at stabilization.
Rent comps 40 comps
| Address | Beds | Baths | Sqft | Rent | $/sqft | DOM | Units | Dist |
|---|---|---|---|---|---|---|---|---|
| 7032 Conley St Houston, TX | 3.0 | 2.0 | 1220 | $2,850 | $2.34 | 44d | 1 | 0.58mi |
| 5813 England St Unit A Houston, TX | 3.0 | 2.5 | 1473 | $2,195 | $1.49 | 4d | 1 | 0.58mi |
| 3603 Alice St Houston, TX | 2.0 | 1.0 | 850 | $1,000 | $1.18 | 5d | 1 | 0.60mi |
| 3603 Alice St Unit 15 Houston, TX | 2.0 | 1.0 | 850 | $999 | $1.18 | 8d | 1 | 0.62mi |
| 3560 Dixie Dr Unit 2162 Houston, TX | 2.0 | 2.0 | 1322 | $1,410 | $1.07 | 5d | 1 | 0.62mi |
| 3560 Dixie Dr Apt 422 Houston, TX | 2.0 | 2.0 | 1322 | $1,410 | $1.07 | 8d | 1 | 0.62mi |
| 3560 Dixie Dr Unit 3617 Houston, TX | 2.0 | 2.0 | 1322 | $1,435 | $1.09 | 44d | 1 | 0.62mi |
| 3560 Dixie Dr Unit 2165 Houston, TX | 2.0 | 2.0 | 1322 | $1,402 | $1.06 | 3d | 1 | 0.62mi |
| 3560 Dixie Dr Unit 3597 Houston, TX | 2.0 | 2.0 | 1322 | $1,434 | $1.08 | 11d | 1 | 0.62mi |
| 3644 Griggs Rd Unit 1047940P Houston, TX | 3.0 | 2.5 | 1399 | $2,161 | $1.54 | 2d | 1 | 0.68mi |
| 4007 Corder St Houston, TX | 2.0 | 1.0 | 814 | $885 | $1.09 | 24d | 1 | 0.71mi |
| 3426 Tampa St Unit 4272026 Houston, TX | 2.0 | 1.5 | 1046 | $1,500 | $1.43 | 44d | 1 | 0.79mi |
| 6532 Weston St Unit A Houston, TX | 3.0 | 3.0 | 1484 | $2,200 | $1.48 | 18d | 1 | 0.82mi |
| 6528 Weston St Unit A Houston, TX | 3.0 | 3.0 | 1484 | $2,200 | $1.48 | 44d | 1 | 0.83mi |
| 5924 Schroeder Rd Houston, TX | 2.0 | 1.0 | 900 | $895 | $0.99 | 44d | 1 | 1.04mi |
| 5924 Schroeder Rd Houston, TX | 2.0 | 1.0 | 900 | $895 | $0.99 | 22d | 1 | 1.04mi |
| 5918 Schroeder Rd Houston, TX | 1.0–2.0 | 1.0 | 850 | $1,000 | $1.18 | 44d | 1 | 1.05mi |
| 3360 Alice St Unit 3174 Houston, TX | 3.0 | 2.0 | 1154 | $1,129 | $0.98 | 3d | 1 | 1.06mi |
| 3360 Alice St Unit 3387 Houston, TX | 2.0 | 2.0 | 968 | $1,315 | $1.36 | 3d | 1 | 1.06mi |
| 3360 Alice St Unit 510 Houston, TX | 3.0 | 2.0 | 1154 | $1,172 | $1.02 | 12d | 1 | 1.06mi |
| 3360 Alice St Unit 2174 Houston, TX | 2.0 | 2.0 | 945 | $966 | $1.02 | 16d | 1 | 1.06mi |
| 3360 Alice St Unit 2292 Houston, TX | 2.0 | 2.0 | 945 | $998 | $1.06 | 44d | 1 | 1.06mi |
| 3360 Alice St Unit 2162 Houston, TX | 2.0 | 2.0 | 968 | $1,323 | $1.37 | 8d | 1 | 1.06mi |
| 3360 Alice St Unit 2174 Houston, TX | 2.0 | 2.0 | 945 | $991 | $1.05 | 14d | 1 | 1.06mi |
| 3360 Alice St Unit 3047 Houston, TX | 3.0 | 2.0 | 1154 | $1,172 | $1.02 | 11d | 1 | 1.07mi |
| 3360 Alice St Unit 2047 Houston, TX | 2.0 | 2.0 | 968 | $1,347 | $1.39 | 3d | 1 | 1.07mi |
| 3716 Southmore Blvd Houston, TX | 2.0 | 1.0 | 850 | $1,000 | $1.18 | 44d | 1 | 1.09mi |
| 3620 Southmore Blvd Houston, TX | 2.0 | 1.0 | 780 | $1,100 | $1.41 | 14d | 1 | 1.14mi |
| 5123 Dewberry St Houston, TX | 4.0 | 2.0 | 1391 | $2,400 | $1.73 | 44d | 1 | 1.21mi |
| 4722 Old Spanish Trl Unit B301 Houston, TX | 2.0 | 2.0 | 1027 | $1,695 | $1.65 | 44d | 1 | 1.21mi |
| 1600 Jester St Houston, TX | 1.0–2.0 | 1.0 | 707 | $1,395 | $1.97 | 2d | 4 | 1.22mi |
| 4942 Bataan Rd Unit 77033 Houston, TX | 4.0 | 2.0 | 1350 | $1,800 | $1.33 | 44d | 1 | 1.24mi |
| 7110 Ardmore St Houston, TX | 2.0 | 1.0–2.0 | 831 | $2,354 | $2.83 | 3d | 19 | 1.28mi |
| 7812 Tierwester St Houston, TX | 2.0 | 1.0 | 800 | $950 | $1.19 | 16d | 2 | 1.30mi |
| 5116 Griggs Rd Houston, TX | 3.0 | 2.0 | 1131 | $1,316 | $1.16 | 44d | 1 | 1.30mi |
| 5154 Griggs Rd Unit CAVE Houston, TX | 2.0 | 2.0 | 1322 | $1,420 | $1.07 | 3d | 1 | 1.35mi |
| 4530 Mayflower St Houston, TX | 3.0 | 2.0 | 1302 | $1,800 | $1.38 | 44d | 1 | 1.35mi |
| 7373 Ardmore St Houston, TX | 1.0–3.0 | 1.0–2.0 | 1095 | $1,887 | $1.72 | 5d | 24 | 1.36mi |
| 5506 Sampson St Houston, TX | 3.0 | 3.0 | 1287 | $920 | $0.71 | 24d | 1 | 1.38mi |
| 5506 Sampson St Houston, TX | 2.0 | 2.0 | 886 | $970 | $1.09 | 44d | 1 | 1.38mi |
Listing history 16 events
-
2026-06-18days on market $120,000 Active 27 DOM
-
2026-06-17days on market $120,000 Active 26 DOM
-
2026-06-16days on market $120,000 Active 25 DOM
-
2026-06-15days on market $120,000 Active 24 DOM
-
2026-06-13remarks 82-char remark
-
2026-06-13pricedays on market $120,000 Active 22 DOM
-
2026-06-09days on market $115,000 Active 18 DOM
-
2026-06-08days on market $115,000 Active 17 DOM
-
2026-06-07days on market $115,000 Active 16 DOM
-
2026-06-04days on market $115,000 Active 13 DOM
-
2026-06-02days on market $115,000 Active 11 DOM
-
2026-06-01days on market $115,000 Active 10 DOM
-
2026-05-31days on market $115,000 Active 9 DOM
-
2026-05-22$115,000 Active
-
2003-10-02soldstatus
-
1988-01-02soldstatus
ⓘ Source: listings_history table (triggers on properties + properties_extension) + one-shot
backfill from property_details.listing_events for pre-trigger history.
Tax reassessment forecast TX · Resets to sale price
- Current annual tax
- $2,174 · $181/mo
- Projected year-2 tax
- $2,196 · $183/mo
- Expected delta
- +$22/yr (+$2/mo · 1.0%)
ⓘ Screening estimate from a state-policy table — verify with the county assessor before closing.
Climate risk First Street
- Flood 6/10 Major FEMA zone X (unshaded) · 68% chance over 30 yrs
- Wildfire 1/10 Low
- Heat 9/10 Extreme 7 d/yr ≥109°F today · 24 d/yr by 30 yrs out
- Wind 9/10 Extreme 99% chance of damaging wind over 30 yrs
- Air quality 2/10 Low 2 unhealthy d/yr today · 2 by 30 yrs out
Nearby sold comps map
Loading sold comps map…
Walkable amenities ~0.75 mi
Loading nearby amenities…
Taxation est. · year 1
- Rental income
- $19,497
- − Mortgage interest
- −$6,722
- − Property taxes
- −$2,174
- − Insurance
- −$600
- − Repairs & maintenance
- −$1,560
- − Management
- −$1,560
- − Depreciation
- −$3,491
- Taxable income
- $3,391
- Est. tax owed @ 24.0%
- −$814
- After-tax cash flow
- $4,263/yr
For passive investors: Depreciation is non-cash, so a rental often shows a tax loss while cash-flowing — sheltering income. Rental losses are passive: they offset passive income freely, and up to $25,000/yr can offset ordinary (W-2) income if you actively participate and your MAGI is under $100k (phasing out to $0 by $150k); unused losses carry forward. On sale, claimed depreciation is recaptured at up to 25%, and gains may owe capital-gains tax (a 1031 exchange can defer both). Figures are a year-1 estimate at your 24.0% rate — not tax advice; consult a CPA.
Schools (NCES district)
- District
- Houston ISD
- NCES district ID
- 4823640
- Math proficiency
- 27% ▼ -18.00%
- Reading proficiency
- 35% ▼ -6.00%
- Median HH income
- $46,054
- Composite
- 26.63/100
- National rank
- #7173
- State rank
- #593 of 826 in TX
Livability — Houston
- Score
- 74/100
- State rank
- #184
- US rank
- #4771
Category grades
Schools grade is shown separately in the Schools card above.
Census & demographics
- Census place
- Houston, TX
- County
- Harris County · 4,702,590 people
- City population
- 3,226,434
- Metro
- Houston-The Woodlands-Sugar Land, TX
- Population (ZIP)
- 26,153
- Household income
- $45,574
- Rent vs Own
- Severe rent burden
- 2532.0
Population outlook (Harris County) Hauer SSP2
- Today (2025)
- 5,571,493 people
- By 2030
- 6,089,821 · +9.3%
- By 2040
- 7,142,806 · +28.2%
- By 2050
- 8,185,864 · +46.9%
- By 2075
- 10,574,329 · +89.8%
- By 2100
- 12,109,958 · +117.4%
Race, ethnicity, and origin ACS 2023
- Neighborhood character
- Diverse neighborhood (Simpson 0.55)
- Race & ethnicity
- Black 62% Hispanic / Latino 22% Two or more races 12% White 10% Asian 2%
- Hispanic origin (detail)
- Mexican 15%
- Common ancestry
- Italian 1% Romanian 1% Lithuanian 1%
- Foreign-born
- 11% · Canada
- Languages at home
- 77% English-only · Spanish 19% French/Haitian/Cajun 1% Other Indo-European 1%
Political lean MEDSL · Harris
- 2024 margin
- Lean D (+5.5) · D 52.0% · R 46.4% · Other 1.6%
- 2008→2024 swing
- +3.9pp toward D · 2008: 1.6pp · 2024: 5.5pp
- All cycles
- 2024: D+5.5 2020: D+13.3 2016: D+12.4 2012: D+0.1 2008: D+1.6
Not yet ingested
- Civics
- —
Market trends
- HPI YoY
- ▼ -71.22%
- Current HPI
- 230.2869
- Rent YoY
- ▲ 2.17%
- Metro
- Houston-The Woodlands-Sugar Land, TX
- State GDP YoY
- ▲ 3.95%
- F500 in state
- 110
Industry mix (Fortune 500 HQ in TX)
| Industry | F500 HQs | Revenue |
|---|---|---|
| Energy | 16 | $1,198B |
|
||
| Technology | 5 | $198B |
|
||
| Engineering / Construction | 4 | $72B |
|
||
| Energy Services | 3 | $60B |
|
||
| Utilities | 3 | $41B |
|
||
| Healthcare | 2 | $330B |
|
||
Price history
3 events — show timeline
- 2026-05-22 Listed $115,000 HARMLS
- 2003-10-02 Sold (Public Records) — Public Records
- 1988-01-02 Sold (Public Records) — Public Records
Property tax history
+5.7%/yrLatest (2025): $2,174 · +11.7% YoY. Source: county tax records.
Cash-flow waterfall
monthlySold comps — $/sqft
last 12 mo · ≤1 miLoading sold comps…