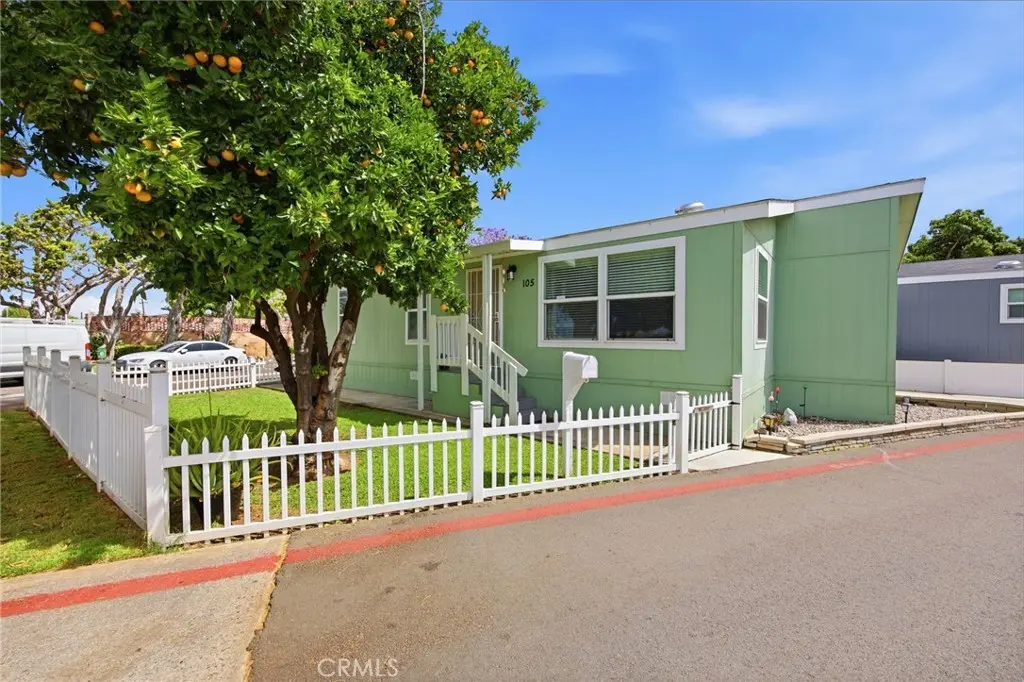
105 E Balboa #148 · Tustin, CA
Flood risk 1/10 · Minimal
- FEMA flood zone
- X (unshaded)
- Chance of flooding over 30 yrs
- 0.0%
- Est. flood insurance / yr
- $507 – $1,088
Fire risk 1/10 · Minimal
- Est. fire insurance / yr
- $659 – $1,223
Heat risk 5/10 · Moderate
- Hot days now (above 92°F)
- 7 days/yr
- Hot days in 30 yrs
- 20 days/yr
Wind risk 1/10 · Minimal
- Chance of severe wind over 30 yrs
- —
Air-quality risk 4/10 · Minor
- Unhealthy air days now
- 3 days/yr
- Unhealthy air days in 30 yrs
- 5 days/yr
Risk factors via First Street. Map © Google.
Why this score? — see what drove the C+ grade
The composite is a weighted blend of 9 inputs, each scored 0–100. Each bar is that input's sub-score; the figure is the points it added to the 100-point composite (weight × sub-score).
- Cash flow +27.5/30.0
- DSCR +9.7/10.0
- 1% rule +7.5/10.0
- Schools +5.0/10.0
- Condition / age +4.0/5.0
- Livability +3.6/5.0
- Rent growth +3.5/5.0
- ARV discount +0.0/15.0
- Appreciation +0.0/10.0
$243,500
🖨 Deal sheet 📄 Offer letter ✓ Due diligence
Listing remarks MLS
Welcome to Tustin Village, this Manufactured House blt 2022, has Laminate Flooring in the Kitchen, Bathrooms and Laundry Room. The 3 Bedrooms have Carpet. This unit offers a open concept floor plan, it is bright and in move in condition. It is on Prime Location near the Community Pool and Clubhouse. Make this a must see, will not disappoint. Corner lot with small front yard and very spacious carport. Close to the 55 and the 5 Freeways, Santa Ana Zoo, 5 Minutes from Old Town Tustin and 10 minutes from Downtown Santa Ana.
Key facts
- Community pool
- Built 2022
- Listed 58 days
Neighborhood map
What this means for you Summary
Snapshot
- This is a 3-bed/2.0-bath manufactured listed at $244k. Condition is rated good.
Deal economics
- At list price, monthly cash flow is $722 ($9k/yr) — positive.
- The deal already cash-flows at list — no discount required.
- Meets the 1% rule at list price ($3k rent vs $244k).
- Recommended offer: $236k (3.0% below list) — sets the bar for market timing.
- Cap rate 9.8% vs local median 1.9% in Tustin — top-decile yield for the area; either an underpriced asset or a hidden risk that comps aren't pricing in. Stress-test before assuming the spread holds.
Location & tenants
- Location reads 71/100 on livability (#215 in CA) — a middle-class / working-renter tenant base. Strengths: employment A+, commute B; Watch: health & safety D+, cost of living F.
- Tustin Unified (urban): math 46% / reading 65% proficiency, ranked #91 of 517 in CA (top 18%) — acceptable for families but not a draw, mixed tenant base, ~2y average lease.
- Market conditions: Rents rising fast (+4.1%/yr); 70 active listings in the ZIP; 40 comparable units currently listed for rent nearby; rentals at typical pace (median 22d on market — plan ~3-4 weeks tenant-placement turnaround); solid renter incomes; 6,974 units permitted in Orange County in 2024 (3,839 in 5+ unit buildings).
- This rent runs 36% of the median local income ($101k/yr) — at the standard rent-burdened threshold; future hikes will face affordability resistance.
Forward outlook
- Local home prices are declining (-3.0%/yr); year-one equity from $2k of loan paydown is wiped out by about $7k of value loss. Plan a longer hold.
- Orange County population projected at +14% by 2050 — modest demand growth; plan on rents tracking national, not racing it.
- At projected returns (-3.0% appreciation + 4.1% rent growth), your $68k cash investment doubles in ~9 years — after that, you're playing with house money.
Negotiation context
- It's been on market 58 days — a 3% lower offer ($236k) is reasonable based on typical stale-listing flexibility.
Risks & watch-outs
- Climate carrying-cost: extreme-heat days projected 7→20/yr by 2055 (HVAC capex compounding) — expect insurance premiums to compound above CPI over the hold.
Questions for the listing agent
- It's been on market 58 days. Have you received any prior offers? Is the seller open to a 3% concession, seller financing, or rate buy-down credit?
- Is there a deadline driving the sale (1031 exchange, divorce, estate, relocation)? That informs how much negotiation room exists.
- What's the average days-on-market for RENTAL listings here right now (not sales)? A rising rental-DOM trend means longer vacancies and softer asking-rent achievability than the comps imply.
- What's the recent tenant-quality profile in this submarket — average credit score on applications, eviction rate, late-payment / NSF rate, and stable-employment percentage? A property-management company in the area should have these aggregated.
- How much new for-sale + rental construction is in the pipeline within 1–3 miles? Heavy new supply typically softens prices + rents 12–24 months out; constrained supply supports both.
Investment metrics
- 1% rule
- 1.25% ✓
- Cap rate
- 9.85%
- Cash-on-cash
- 12.70%
- DSCR
- 1.57
- GRM
- 6.7
CMA / ARV
- ARV (median comp)
- $206,894
- List price
- $243,500
- Delta
- 17.69%
- Verdict
- OVERPRICED
- Comps
- 9 within 1.0 mi
Show comp detail 7 sales within ~0.75 mi
| Address | Dist | Beds/Ba | Sqft | Sold | Price | $/sf | Match |
|---|---|---|---|---|---|---|---|
| 121 S Portola Ln | 0.05mi | 3/2.0 | 1,120 (+2%) | 12mo | $129,900 | $116 | 84 |
| 128 E Balboa Ln | 0.03mi | 3/2.0 | 1,144 (+4%) | 12mo | $210,000 | $184 | 81 |
| 123 S Colombo Ln #78 | 0.06mi | 2/2.0 (-1) | 1,081 (-2%) | 10mo | $146,000 | $135 | 81 |
| 138 E Balboa Ln #138 | 0.06mi | 2/2.0 (-1) | 1,080 (-2%) | 16mo | $117,500 | $109 | 76 |
| 130 Serra Ln #130 | 0.10mi | 3/2.0 | 1,054 (-4%) | 17mo | $217,500 | $206 | 75 |
| 108 E Balboa Ln | 0.05mi | 3/2.0 | 1,200 (+9%) | 17mo | $212,000 | $177 | 68 |
| 1500 Warren St #155 | 0.70mi | 3/2.0 | 1,200 (+9%) | 17mo | $215,000 | $179 | 37 |
Match score weights: distance 35% · size 25% · config 20% · recency 20%. Top-matched comps best support the ARV.
Projected returns pro-forma
-3.0% appreciation · 4.12% rent growth · sell at horizon
- IRR
- 3.8%
- Equity multiple
- 1.15×
- Total profit
- $10,026
- Equity at exit
- $36,307
- IRR
- 14.3%
- Equity multiple
- 2.21×
- Total profit
- $82,669
- Equity at exit
- $21,053
Cash invested: $68,180 (down + closing). Projections, not guarantees.
Landlord ↔ Tenant lean methodology
- Overall (STATE)
- 18 Strongly Tenant-Friendly
- State California
- 18 Strongly Tenant-Friendly · D+13
- County
- — inherits STATE
- City
- — inherits STATE
ZIP-level market 92780
- Rents YoY
- 4.1%
- Active inventory
- 70
- Price-to-rent
- 6.7×
Monthly cashflow live
- Estimated rent
- $3,044 high interval (Pro) →
- Mortgage (P&I)
- −$1,277
- Tax est. 1.5%
- −$304 /mo · $3,652/yr
- Insurance
- −$101
- HOA
- −$0
- Vacancy / Maint / Mgmt
- −$639
- Net cashflow
- $722
Break-even live
UW: 25.0% down · 7.5% · 30yr · 1.5% tax · 5.0% vac · 8.0% maint · 8.0% mgmt
Financing live
Cash to close
- Down payment
- $60,875
- Closing costs
- $7,305
- Reserves months
- —
- Total cash needed
- —
Loan-product check · same deal, 3 products live
Conventional
25% down · 7.5% · 30yr
- Down + closing
- —
- Monthly P&I
- —
- Monthly cashflow
- —
- DSCR
- —
- Eligible?
- —
Personal DTI + credit; lowest rate.
DSCR
20% down · 8.5% · 30yr
- Down + closing
- —
- Monthly P&I
- —
- Monthly cashflow
- —
- DSCR
- —
- Eligible?
- —
No personal income docs; deal must DSCR.
Hard money
10% down · 12.0% · 12mo
- Down + closing
- —
- Monthly P&I
- —
- Monthly cashflow
- —
- DSCR
- —
- Eligible?
- —
Short-term bridge; refi at stabilization.
Rent comps 40 comps
| Address | Beds | Baths | Sqft | Rent | $/sqft | DOM | Units | Dist |
|---|---|---|---|---|---|---|---|---|
| 16586 Montego Way Tustin, CA | 3.0 | 2.0 | 1188 | $3,900 | $3.28 | 43d | 1 | 0.10mi |
| 15513 Williams St Unit Q013 Tustin, CA | 2.0 | 1.0 | 910 | $2,525 | $2.77 | 15d | 1 | 0.13mi |
| 15512 Williams St Unit A89 Tustin, CA | 2.0 | 2.0 | 1047 | $2,950 | $2.82 | 43d | 1 | 0.15mi |
| 16571 Alliance Ave Tustin, CA | 1.0–2.0 | 1.0 | 865 | $2,100 | $2.43 | 7d | 1 | 0.20mi |
| 16282 E Main St Tustin, CA | 2.0 | 1.5 | 937 | $2,886 | $3.08 | 4d | 4 | 0.29mi |
| 15701 Tustin Village Way Unit A-12 Tustin, CA | 2.0 | 1.0 | 1062 | $2,850 | $2.68 | 24d | 1 | 0.29mi |
| 15701 Tustin Village Way Tustin, CA | 2.0 | 1.0 | 1062 | $2,850 | $2.68 | 15d | 1 | 0.29mi |
| 15652 Williams St Tustin, CA | 1.0–2.0 | 1.0 | 862 | $2,750 | $3.19 | 43d | 9 | 0.31mi |
| 15660 Tustin Village Way Tustin, CA | 1.0–2.0 | 1.0 | 875 | $2,695 | $3.08 | 43d | 1 | 0.33mi |
| 15501 Pasadena Ave Tustin, CA | 1.0–2.0 | 1.0–2.0 | 750 | $2,800 | $3.73 | 1d | 12 | 0.33mi |
| 2112 E 1st St Santa Ana, CA | 1.0–4.0 | 1.0–2.0 | 939 | $2,448 | $2.61 | 15d | 1 | 0.35mi |
| 15742 Williams St Tustin, CA | 2.0 | 2.0 | 1100 | $2,798 | $2.54 | 2d | 1 | 0.38mi |
| 15482 Pasadena Ave Tustin, CA | 1.0–2.0 | 1.0–2.0 | 788 | $2,936 | $3.73 | 6d | 6 | 0.45mi |
| 1901 E 1st St Santa Ana, CA | 1.0–2.0 | 1.0–2.5 | 1267 | $4,467 | $3.53 | 2d | 16 | 0.45mi |
| 100 S Zoo Ln Santa Ana, CA | 3.0 | 1.0–2.0 | 957 | $5,526 | $5.77 | 1d | 27 | 0.46mi |
| 17045 Medallion Ave Tustin, CA | 2.0 | 1.5 | 1200 | $3,100 | $2.58 | 43d | 1 | 0.46mi |
| 1001 S Lyon St Unit 12-N Santa Ana, CA | 2.0 | 2.0 | 1020 | $2,800 | $2.75 | 43d | 1 | 0.47mi |
| 1001 S Lyon St Unit 20-N Santa Ana, CA | 2.0 | 2.0 | 1020 | $2,650 | $2.60 | 43d | 1 | 0.47mi |
| 1001 S Lyon St Unit 24-S Santa Ana, CA | 2.0 | 2.0 | 1020 | $2,800 | $2.75 | 18d | 1 | 0.47mi |
| 1001 S Lyon St Unit 8-N Santa Ana, CA | 2.0 | 2.0 | 1020 | $2,850 | $2.79 | 43d | 1 | 0.47mi |
| 340 Pacific St Tustin, CA | 2.0 | 1.0 | 900 | $3,095 | $3.44 | 43d | 1 | 0.48mi |
| 15731 Pasadena Ave Unit 16 Tustin, CA | 2.0 | 1.0 | 1013 | $2,600 | $2.57 | 43d | 1 | 0.49mi |
| 15695 S B St Tustin, CA | 2.0 | 1.0 | 1000 | $2,795 | $2.79 | 43d | 1 | 0.70mi |
| 17200 McFadden Ave Unit 06A Tustin, CA | 2.0 | 1.5 | 1230 | $3,195 | $2.60 | 24d | 1 | 0.70mi |
| 17272 Walnut Ave Tustin, CA | 1.0–2.0 | 1.0 | 750 | $2,785 | $3.71 | 3d | 2 | 0.72mi |
| 15722 S B St Tustin, CA | 2.0 | 2.0 | 1200 | $3,050 | $2.54 | 24d | 1 | 0.72mi |
| 15991 Altadena Dr Unit Domus Villas 16001 C Tustin, CA | 2.0 | 1.0 | 990 | $2,800 | $2.83 | 21d | 1 | 0.73mi |
| 17062 Altadena Dr., 15991 & 16001 Pasadena AVE Tustin, CA | 2.0 | 1.0 | 990 | $2,900 | $2.93 | 15d | 1 | 0.73mi |
| 15991 Bliss Ln Tustin, CA | 2.0 | 1.0 | 990 | $2,900 | $2.93 | 21d | 1 | 0.73mi |
| 16002 Pasadena Ave Unit 16002-C Tustin, CA | 2.0 | 1.0 | 700 | $2,475 | $3.54 | 6d | 1 | 0.76mi |
| 16002 Pasadena Ave Tustin, CA | 2.0 | 1.0 | 700 | $2,475 | $3.54 | 5d | 1 | 0.76mi |
| 559 N Tustin Ave Apt E Santa Ana, CA | 2.0 | 1.0 | 910 | $2,550 | $2.80 | 43d | 1 | 0.79mi |
| 587 N Tustin Ave Unit G Santa Ana, CA | 2.0 | 1.0 | 910 | $2,450 | $2.69 | 43d | 1 | 0.80mi |
| 573 N Tustin Ave Apt H Santa Ana, CA | 2.0 | 1.0 | 910 | $2,500 | $2.75 | 43d | 1 | 0.82mi |
| 14901 Newport Ave Tustin, CA | 2.0 | 1.0–2.0 | 678 | $3,206 | $4.73 | 2d | 8 | 0.82mi |
| 750 N Parkcenter Dr Santa Ana, CA | 1.0–2.0 | 1.0–2.0 | 877 | $3,614 | $4.12 | 6d | 9 | 0.84mi |
| 14300 Newport Ave Tustin, CA | 1.0–2.0 | 1.0–1.5 | 943 | $3,130 | $3.32 | 1d | 11 | 0.86mi |
| 14802 Newport Ave Unit 5A Tustin, CA | 2.0 | 2.0 | 1258 | $3,000 | $2.38 | 2d | 1 | 0.92mi |
| 1120 Sycamore Ave #1 Tustin, CA | 3.0 | 2.0 | 1300 | $3,495 | $2.69 | 24d | 1 | 0.94mi |
| 1192 Mitchell Ave Tustin, CA | 2.0 | 2.0 | 974 | $2,800 | $2.87 | 7d | 1 | 0.98mi |
Listing history 16 events
-
2026-06-18days on market $243,500 Active 58 DOM
-
2026-06-17days on market $243,500 Active 57 DOM
-
2026-06-16days on market $243,500 Active 56 DOM
-
2026-06-15days on market $243,500 Active 55 DOM
-
2026-06-13days on market $243,500 Active 53 DOM
-
2026-06-13days on market $243,500 Active 52 DOM
-
2026-06-09days on market $243,500 Active 49 DOM
-
2026-06-08pricedays on market $243,500 Active 48 DOM
-
2026-06-07days on market $249,900 Active 47 DOM
-
2026-06-04days on market $249,900 Active 44 DOM
-
2026-06-03days on market $249,900 Active 43 DOM
-
2026-06-02days on market $249,900 Active 42 DOM
-
2026-06-01days on market $249,900 Active 41 DOM
-
2026-05-31days on market $249,900 Active 40 DOM
-
2026-04-21$265,000 Active 526-char remark
Show marketing remark (526 chars)
Welcome to Tustin Village, this Manufactured House blt 2022, has Laminate Flooring in the Kitchen, Bathrooms and Laundry Room. The 3 Bedrooms have Carpet. This unit offers a open concept floor plan, it is bright and in move in condition. It is on Prime Location near the Community Pool and Clubhouse. Make this a must see, will not disappoint. Corner lot with small front yard and very spacious carport. Close to the 55 and the 5 Freeways, Santa Ana Zoo, 5 Minutes from Old Town Tustin and 10 minutes from Downtown Santa Ana.
-
2026-04-19historical $265,000 526-char remark
Show marketing remark (526 chars)
Welcome to Tustin Village, this Manufactured House blt 2022, has Laminate Flooring in the Kitchen, Bathrooms and Laundry Room. The 3 Bedrooms have Carpet. This unit offers a open concept floor plan, it is bright and in move in condition. It is on Prime Location near the Community Pool and Clubhouse. Make this a must see, will not disappoint. Corner lot with small front yard and very spacious carport. Close to the 55 and the 5 Freeways, Santa Ana Zoo, 5 Minutes from Old Town Tustin and 10 minutes from Downtown Santa Ana.
ⓘ Source: listings_history table (triggers on properties + properties_extension) + one-shot
backfill from property_details.listing_events for pre-trigger history.
Climate risk First Street
- Flood 1/10 Low FEMA zone X (unshaded) · 0% chance over 30 yrs
- Wildfire 1/10 Low
- Heat 5/10 Major 7 d/yr ≥92°F today · 20 d/yr by 30 yrs out
- Wind 1/10 Low
- Air quality 4/10 Moderate 3 unhealthy d/yr today · 5 by 30 yrs out
Nearby sold comps map
Loading sold comps map…
Walkable amenities ~0.75 mi
Loading nearby amenities…
Taxation est. · year 1
- Rental income
- $36,525
- − Mortgage interest
- −$13,640
- − Property taxes
- −$3,652
- − Insurance
- −$1,218
- − Repairs & maintenance
- −$2,922
- − Management
- −$2,922
- − Depreciation
- −$7,084
- Taxable income
- $5,087
- Est. tax owed @ 24.0%
- −$1,221
- After-tax cash flow
- $7,440/yr
For passive investors: Depreciation is non-cash, so a rental often shows a tax loss while cash-flowing — sheltering income. Rental losses are passive: they offset passive income freely, and up to $25,000/yr can offset ordinary (W-2) income if you actively participate and your MAGI is under $100k (phasing out to $0 by $150k); unused losses carry forward. On sale, claimed depreciation is recaptured at up to 25%, and gains may owe capital-gains tax (a 1031 exchange can defer both). Figures are a year-1 estimate at your 24.0% rate — not tax advice; consult a CPA.
Condition & rehab AI · 12 photos
This move-in condition manufactured home in Tustin Village offers a good condition with a good ROI potential for both resale and rental.
Value-add opportunities
- Both Paint exterior siding — Enhances curb appeal and value
- Both Replace carpet with hardwood flooring — Improves aesthetics and increases value
- Both Install smart home automation — Enhances convenience and adds modern appeal
Renovation cost estimate screening
Value-add ROI direction
- Both Paint exterior siding — Enhances curb appeal and value ↑
- Both Replace carpet with hardwood flooring — Improves aesthetics and increases value ↑
- Both Install smart home automation — Enhances convenience and adds modern appeal ↑
ⓘ Cost ranges are severity-bucket heuristics (US national rule-of-thumb). Get contractor quotes + a written scope before underwriting a rehab budget.
Schools (NCES district)
- District
- Tustin Unified
- NCES district ID
- 0640150
- Math proficiency
- 46% ▼ -6.00%
- Reading proficiency
- 65% ▲ 4.00%
- Median HH income
- $81,864
- Composite
- 50.32/100
- National rank
- #1880
- State rank
- #91 of 517 in CA
Livability — Tustin
- Score
- 71/100
- State rank
- #215
- US rank
- #6806
Category grades
Schools grade is shown separately in the Schools card above.
Census & demographics
- Census place
- Tustin, CA
- County
- Orange County · 3,096,323 people
- City population
- 84,447
- Metro
- Los Angeles-Long Beach-Anaheim, CA
- Population (ZIP)
- 54,374
- Household income
- $101,017
- Rent vs Own
- Severe rent burden
- 3031.0
Population outlook (Orange County) Hauer SSP2
- Today (2025)
- 3,477,456 people
- By 2030
- 3,613,117 · +3.9%
- By 2040
- 3,835,945 · +10.3%
- By 2050
- 3,968,736 · +14.1%
- By 2075
- 4,097,053 · +17.8%
- By 2100
- 3,903,633 · +12.3%
Race, ethnicity, and origin ACS 2023
- Neighborhood character
- Diverse neighborhood (Simpson 0.64)
- Race & ethnicity
- Hispanic / Latino 52% White 27% Two or more races 16% Asian 14% Black 3%
- Hispanic origin (detail)
- Mexican 43%
- Common ancestry
- Romanian 1% Slovak 1% Italian 1%
- Foreign-born
- 33% · Canada, Vietnam, China
- Languages at home
- 47% English-only · Spanish 40% Other Indo-European 3% Tagalog/Filipino 2%
Political lean MEDSL · Orange
- 2024 margin
- Toss-up / Even · D 49.7% · R 47.1% · Other 3.2%
- 2008→2024 swing
- +5.2pp toward D · 2008: -2.6pp · 2024: 2.6pp
- All cycles
- 2024: D+2.6 2020: D+9.0 2016: D+7.7 2012: R+8.3 2008: R+2.6
Not yet ingested
- Civics
- —
Market trends
- HPI YoY
- ▼ -924.13%
- Current HPI
- 482.9143
- Rent YoY
- ▲ 4.12%
- Metro
- Los Angeles-Long Beach-Anaheim, CA
- State GDP YoY
- ▲ 3.21%
- F500 in state
- 116
Industry mix (Fortune 500 HQ in CA)
| Industry | F500 HQs | Revenue |
|---|---|---|
| Technology | 27 | $1,492B |
|
||
| Financial Services | 3 | $174B |
|
||
| Retail | 3 | $44B |
|
||
| Insurance | 3 | $26B |
|
||
| Media / Entertainment | 2 | $115B |
|
||
| Pharmaceuticals / Biotech | 2 | $62B |
|
||
Price history
+0.0% since first listed2 events — show timeline
- 2026-04-21 Listed $265,000 CRMLS
- 2026-04-19 Coming Soon $265,000 CRMLS
Cash-flow waterfall
monthlySold comps — $/sqft
last 12 mo · ≤1 miLoading sold comps…