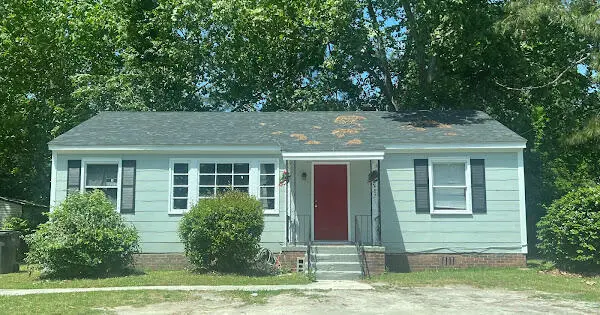
2487 Reese Ave · Augusta-Richmond County consolidated government (balance), GA
Flood risk 6/10 · Moderate
- FEMA flood zone
- AE
- Chance of flooding over 30 yrs
- 0.68%
- Est. flood insurance / yr
- $1,737 – $8,500
Fire risk 2/10 · Minimal
- Est. fire insurance / yr
- $963 – $1,789
Heat risk 7/10 · Major
- Hot days now (above 109°F)
- 7 days/yr
- Hot days in 30 yrs
- 17 days/yr
Wind risk 6/10 · Moderate
- Chance of severe wind over 30 yrs
- 67.0%
Air-quality risk 3/10 · Minor
- Unhealthy air days now
- 3 days/yr
- Unhealthy air days in 30 yrs
- 3 days/yr
Risk factors via First Street. Map © Google.
Why this score? — see what drove the B grade
The composite is a weighted blend of 9 inputs, each scored 0–100. Each bar is that input's sub-score; the figure is the points it added to the 100-point composite (weight × sub-score).
- Cash flow +30.0/30.0
- ARV discount +15.0/15.0
- DSCR +10.0/10.0
- 1% rule +8.5/10.0
- Livability +2.5/5.0
- Condition / age +2.5/5.0
- Rent growth +2.4/5.0
- Schools +1.3/10.0
- Appreciation +0.0/10.0
$84,000
🖨 Deal sheet 📄 Offer letter ✓ Due diligence
Listing remarks
Excellent investment property for a rental. This nice and well kept 2 bedroom 1 bath is ready for its new owner. the home is close to dining and shopping. Schedule your showing today!
Key facts
- 0.25 acre lot
- Built 1951
- Listed 38 days
Property features AI
Exterior
- Utilities: Public water; Public sewer; Cable available
- Home design: Single-family residence; Residential property; Located in the Fleming Heights subdivision
- Construction: Vinyl siding; Composition roof; Crawl space / no basement
- Exterior features: Front porch; Privacy fencing / fenced yard
Interior
- Kitchen: Refrigerator; Range
- Bedrooms: Total of 5 rooms (includes bedrooms and living areas)
- Flooring: Carpet; Ceramic tile
- Bathrooms: 1 full bathroom
- Heating & cooling: Central air conditioning; Electric forced-air heating
- Interior features: Window coverings; Electric water heater
- Laundry & utility: Electric water heater
Neighborhood map
What this means for you Summary
Snapshot
- This is a 2-bed/1.0-bath single-family listed at $84k.
Deal economics
- At list price, monthly cash flow is $-107 ($-1k/yr) — negative.
- To cash-flow at today's rent, offer at most $65k (22.4% below list).
- Meets the 1% rule at list price ($1k rent vs $84k).
- Recommended offer: $65k (22.4% below list) — sets the bar for cash-flow.
- Cap rate 10.9% vs local median 5.3% in Augusta-Richmond County consolidated government (balance) — top-decile yield for the area; either an underpriced asset or a hidden risk that comps aren't pricing in. Stress-test before assuming the spread holds.
Location & tenants
- Location reads: area grade B — affects rentability + tenant quality, not the cash-flow math above.
- Richmond County (urban): math 12% / reading 20% proficiency, ranked #154 of 174 in GA (top 88%) — low school quality limits family demand, transient renter base, plan for 1-2y turnover; 72% free/reduced lunch — lower-income household profile, screen leases tightly.
- Market conditions: Rents soft (-0.2%/yr); 364 active listings in the ZIP; 19 comparable units currently listed for rent nearby; rentals at typical pace (median 24d on market — plan ~3-4 weeks tenant-placement turnaround); 47% of comp listings sitting > 30 days — soft ceiling on asking rent; 561 units permitted in Richmond County in 2024 (0 in 5+ unit buildings).
Forward outlook
- Local home prices are declining (-3.0%/yr); year-one equity from $581 of loan paydown is wiped out by about $3k of value loss. Plan a longer hold.
- Richmond County population projected to shrink 5% by 2050 — rents likely to lag national; underwrite the cash flow, not the appreciation.
Negotiation context
- It's been on market 38 days — a 3% lower offer ($81k) is reasonable based on typical stale-listing flexibility.
- 8 sale attempts since 3y ago with the ask held roughly flat each time — persistent listings suggest the price (not the market) is what's stuck; bring a comps-based counter.
- Current owner paid $67k; 25% above their basis — modest negotiation headroom, anchor on the comps not their cost.
Risks & watch-outs
- Watch-outs: flood insurance adds $427/mo; built in 1951 — expect roof / HVAC / electrical / plumbing capex.
- Climate carrying-cost: in FEMA flood zone AE (mandatory federal flood insurance); major wind risk, 67% chance of damaging wind over 30y; extreme-heat days projected 7→17/yr by 2055 (HVAC capex compounding) — expect insurance premiums to compound above CPI over the hold.
Questions for the listing agent
- What do current leases actually rent for vs. the listed asking? Can we see a recent rent roll and the last 12 months of T-12 income?
- It's been on market 38 days. Have you received any prior offers? Is the seller open to a 22% concession, seller financing, or rate buy-down credit?
- Built in 1951 — when were the roof, HVAC, electrical panel, plumbing, and water heater last replaced?
- What's the actual annual flood-insurance premium (NFIP or private), and is the property in a SFHA with mandatory coverage?
- Is there a deadline driving the sale (1031 exchange, divorce, estate, relocation)? That informs how much negotiation room exists.
- What's the average days-on-market for RENTAL listings here right now (not sales)? A rising rental-DOM trend means longer vacancies and softer asking-rent achievability than the comps imply.
- What's the recent tenant-quality profile in this submarket — average credit score on applications, eviction rate, late-payment / NSF rate, and stable-employment percentage? A property-management company in the area should have these aggregated.
- How much new for-sale + rental construction is in the pipeline within 1–3 miles? Heavy new supply typically softens prices + rents 12–24 months out; constrained supply supports both.
Investment metrics
- 1% rule
- 1.35% ✓
- Cap rate
- 10.86%
- Cash-on-cash
- 16.33%
- DSCR
- 1.73
- GRM
- 6.2
CMA / ARV
- ARV (median comp)
- $116,571
- List price
- $84,000
- Delta
- -27.94%
- Verdict
- UNDERPRICED
- Comps
- 20 within 1.0 mi
Show comp detail 12 sales within ~0.75 mi
| Address | Dist | Beds/Ba | Sqft | Sold | Price | $/sf | Match |
|---|---|---|---|---|---|---|---|
| 2472 Reese Ave | 0.10mi | 3/1.0 (+1) | 1,025 (0%) | 3mo | $89,400 | $87 | 88 |
| 2469 Reese Ave | 0.11mi | 3/1.0 (+1) | 1,025 (0%) | 2mo | $85,000 | $83 | 88 |
| 2520 Reese Ave | 0.21mi | 2/1.0 | 1,073 (+5%) | 5mo | $76,000 | $71 | 79 |
| 1755 Nixon Rd | 0.52mi | 3/1.0 (+1) | 1,008 (-2%) | 5mo | $17,000 | $17 | 64 |
| 2560 Kaufman Dr | 0.60mi | 3/1.0 (+1) | 1,008 (-2%) | 2mo | $60,000 | $60 | 63 |
| 2013 Shark Dr | 0.52mi | 3/1.0 (+1) | 1,059 (+3%) | 3mo | $133,000 | $126 | 62 |
| 2425 Bass Ave | 0.54mi | 3/1.0 (+1) | 1,014 (-1%) | 13mo | $156,000 | $154 | 58 |
| 2521 Hammond Ave | 0.33mi | 2/1.0 | 896 (-13%) | 7mo | $65,000 | $73 | 57 |
| 1907 Virginia Ave | 0.17mi | 3/2.0 (+1) | 1,133 (+10%) | 11mo | $128,900 | $114 | 56 |
| 2564 Ivey Rd | 0.73mi | 3/1.0 (+1) | 968 (-6%) | 6mo | $107,000 | $111 | 47 |
| 2400 Yates Dr | 0.55mi | 3/1.0 (+1) | 888 (-13%) | 8mo | $38,000 | $43 | 40 |
| 2413 Yates Dr | 0.65mi | 3/1.0 (+1) | 888 (-13%) | 6mo | $112,300 | $126 | 37 |
Match score weights: distance 35% · size 25% · config 20% · recency 20%. Top-matched comps best support the ARV.
Projected returns pro-forma
-3.0% appreciation · 0.0% rent growth · sell at horizon
- IRR
- -31.7%
- Equity multiple
- 0.00×
- Total profit
- $-23,448
- Equity at exit
- $12,525
- IRR
- -82.2%
- Equity multiple
- -0.74×
- Total profit
- $-40,888
- Equity at exit
- $7,263
Cash invested: $23,520 (down + closing). Projections, not guarantees.
Landlord ↔ Tenant lean methodology
- Overall (STATE)
- 90 Strongly Landlord-Friendly
- State Georgia
- 90 Strongly Landlord-Friendly · R+3
- County
- — inherits STATE
- City
- — inherits STATE
ZIP-level market 30906
- Home prices YoY
- -21.6%
- Rents YoY
- -0.2%
- Active inventory
- 364
- Price-to-rent
- 6.2×
Monthly cashflow live
- Estimated rent
- $1,135 high interval (Pro) →
- Mortgage (P&I)
- −$441
- Tax from tax record
- −$101 /mo · $1,215/yr
- Insurance
- −$35
- Flood insurance flood zone
- −$427 /mo · $5,118/yr
- HOA
- −$0
- Vacancy / Maint / Mgmt
- −$238
- Net cashflow
- $-107
Break-even live
UW: 25.0% down · 7.5% · 30yr · 1.5% tax · 5.0% vac · 8.0% maint · 8.0% mgmt
Financing live
Cash to close
- Down payment
- $21,000
- Closing costs
- $2,520
- Reserves months
- —
- Total cash needed
- —
Loan-product check · same deal, 3 products live
Conventional
25% down · 7.5% · 30yr
- Down + closing
- —
- Monthly P&I
- —
- Monthly cashflow
- —
- DSCR
- —
- Eligible?
- —
Personal DTI + credit; lowest rate.
DSCR
20% down · 8.5% · 30yr
- Down + closing
- —
- Monthly P&I
- —
- Monthly cashflow
- —
- DSCR
- —
- Eligible?
- —
No personal income docs; deal must DSCR.
Hard money
10% down · 12.0% · 12mo
- Down + closing
- —
- Monthly P&I
- —
- Monthly cashflow
- —
- DSCR
- —
- Eligible?
- —
Short-term bridge; refi at stabilization.
Rent comps 19 comps
| Address | Beds | Baths | Sqft | Rent | $/sqft | DOM | Units | Dist |
|---|---|---|---|---|---|---|---|---|
| 2235 Woodward Ave Augusta, GA | 2.0 | 1.0 | 773 | $895 | $1.16 | 44d | 1 | 0.34mi |
| 2401 Norfolk St Augusta, GA | 2.0 | 1.0 | 991 | $949 | $0.96 | 43d | 1 | 0.40mi |
| 2020 Garr Dr Augusta, GA | 3.0 | 1.0 | 1100 | $1,200 | $1.09 | 14d | 1 | 0.55mi |
| 2205 Southgate Dr Augusta, GA | 1.0–2.0 | 1.0–1.5 | 770 | $1,099 | $1.43 | 14d | 7 | 0.73mi |
| 2119 Lumpkin Rd Augusta, GA | 2.0 | 1.0–1.5 | 974 | $912 | $0.94 | 21d | 6 | 0.96mi |
| 1822 Catalina Dr Augusta, GA | 3.0 | 1.0 | 888 | $1,350 | $1.52 | 23d | 1 | 0.97mi |
| 1822 Catalina Dr Augusta, GA | 3.0 | 1.0 | 888 | $1,350 | $1.52 | 43d | 1 | 0.97mi |
| 2932 Abelia Dr Augusta, GA | 3.0 | 1.0 | 888 | $1,100 | $1.24 | 43d | 1 | 1.04mi |
| 1940 Haynie Dr Unit 2 Augusta, GA | 1.0 | 1.0 | 840 | $850 | $1.01 | 23d | 1 | 1.13mi |
| 1940 Haynie Dr Unit Main Augusta, GA | 3.0 | 1.5 | 840 | $1,500 | $1.79 | 23d | 1 | 1.13mi |
| 1940 Haynie Dr Unit Main Augusta, GA | 3.0 | 1.5 | 840 | $1,500 | $1.79 | 43d | 1 | 1.13mi |
| 1914 1/2 Kratha Dr Augusta, GA | 2.0 | 1.0 | 1400 | $995 | $0.71 | 14d | 1 | 1.18mi |
| 526 Richmond Hill Rd W Augusta, GA | 1.0 | 1.0 | 770 | $810 | $1.05 | 14d | 1 | 1.22mi |
| 2230 Hollis Rd Augusta, GA | 2.0 | 1.0 | 1000 | $975 | $0.97 | 43d | 1 | 1.27mi |
| 3211 Kevin Dr Augusta, GA | 3.0 | 1.5 | 1005 | $1,275 | $1.27 | 43d | 1 | 1.32mi |
| 3211 Kevin Dr Augusta, GA | 3.0 | 1.5 | 1005 | $1,275 | $1.27 | 23d | 1 | 1.32mi |
| 2910 Richmond Hill Rd Augusta, GA | 2.0 | 1.0 | 1000 | $900 | $0.90 | 43d | 3 | 1.35mi |
| 2810 Thomas Ln Augusta, GA | 2.0 | 2.0 | 1030 | $975 | $0.95 | 43d | 6 | 1.49mi |
| 2125 Kennedy Dr Augusta, GA | 2.0 | 1.0 | 750 | $795 | $1.06 | 14d | 1 | 1.49mi |
Listing history 32 events
-
2026-06-18days on market $84,000 Active 38 DOM
-
2026-06-17days on market $84,000 Active 37 DOM
-
2026-06-16days on market $84,000 Active 36 DOM
-
2026-06-15days on market $84,000 Active 35 DOM
-
2026-06-14days on market $84,000 Active 33 DOM
-
2026-06-10days on market $84,000 Active 30 DOM
-
2026-06-09days on market $84,000 Active 29 DOM
-
2026-06-08days on market $84,000 Active 28 DOM
-
2026-06-07days on market $84,000 Active 27 DOM
-
2026-06-03days on market $84,000 Active 23 DOM
-
2026-06-02days on market $84,000 Active 22 DOM
-
2026-06-01days on market $84,000 Active 21 DOM
-
2026-05-31days on market $84,000 Active 20 DOM
-
2026-05-30days on market $84,000 Active 19 DOM
-
2026-05-11historical
-
2026-01-19price $84,000
-
2025-10-06$89,000 Active
-
2025-10-06$84,000 Active 183-char remark
-
2025-05-07historical
-
2025-05-07historical
-
2025-04-25$104,900
-
2025-04-25$104,900
-
2024-07-26historical
-
2024-07-26historical
-
2024-04-09$104,900
-
2024-04-09$104,900
-
2023-05-16historical
-
2023-05-16historical
-
2023-05-10$104,900
-
2023-05-10$104,900
-
2022-09-27soldstatus $67,000
-
2021-08-06soldstatus $37,000
ⓘ Source: listings_history table (triggers on properties + properties_extension) + one-shot
backfill from property_details.listing_events for pre-trigger history.
Tax reassessment forecast GA · Resets to sale price
- Current annual tax
- $1,215 · $101/mo
- Projected year-2 tax
- $1,215 · $101/mo
- Expected delta
- $0/yr ($0/mo · 0.0%)
ⓘ Screening estimate from a state-policy table — verify with the county assessor before closing.
Climate risk First Street
- Flood 6/10 Major FEMA zone AE · 68% chance over 30 yrs
- Wildfire 2/10 Low
- Heat 7/10 Severe 7 d/yr ≥109°F today · 17 d/yr by 30 yrs out
- Wind 6/10 Major 67% chance of damaging wind over 30 yrs
- Air quality 3/10 Moderate 3 unhealthy d/yr today · 3 by 30 yrs out
Nearby sold comps map
Loading sold comps map…
Walkable amenities ~0.75 mi
Loading nearby amenities…
Taxation est. · year 1
- Rental income
- $13,621
- − Mortgage interest
- −$4,705
- − Property taxes
- −$1,215
- − Insurance
- −$5,538
- − Repairs & maintenance
- −$1,090
- − Management
- −$1,090
- − Depreciation
- −$2,444
- Taxable loss
- −$2,461
- Est. tax savings @ 24.0%
- +$591
- After-tax cash flow
- $-688/yr
For passive investors: Depreciation is non-cash, so a rental often shows a tax loss while cash-flowing — sheltering income. Rental losses are passive: they offset passive income freely, and up to $25,000/yr can offset ordinary (W-2) income if you actively participate and your MAGI is under $100k (phasing out to $0 by $150k); unused losses carry forward. On sale, claimed depreciation is recaptured at up to 25%, and gains may owe capital-gains tax (a 1031 exchange can defer both). Figures are a year-1 estimate at your 24.0% rate — not tax advice; consult a CPA.
Schools (NCES district)
- District
- Richmond County
- NCES district ID
- 1304380
- Math proficiency
- 12% ▼ -9.00%
- Reading proficiency
- 20% ▼ -6.00%
- Median HH income
- $38,069
- Composite
- 13.43/100
- National rank
- #9524
- State rank
- #154 of 174 in GA
Livability — Augusta-Richmond County consolidated government (balance)
No livability data for this city. (Only ~50 U.S. cities are tracked.)
Census & demographics
- Census place
- Augusta-Richmond County consolidated government (balance), GA
- County
- Richmond County · 190,917 people
- City population
- 154,035
- Metro
- Augusta-Richmond County, GA-SC
- Population (ZIP)
- 60,423
- Household income
- $45,999
- Rent vs Own
- Severe rent burden
- 3363.0
Population outlook (Richmond County) Hauer SSP2
- Today (2025)
- 200,753 people
- By 2030
- 200,232 · -0.3%
- By 2040
- 196,813 · -2.0%
- By 2050
- 190,347 · -5.2%
- By 2075
- 172,496 · -14.1%
- By 2100
- 146,284 · -27.1%
Race, ethnicity, and origin ACS 2023
- Neighborhood character
- Majority Black (64%)
- Race & ethnicity
- Black 64% White 27% Two or more races 5% Hispanic / Latino 5%
- Common ancestry
- Lithuanian 1%
- Foreign-born
- 2% · Canada
- Languages at home
- 95% English-only · Spanish 3% German/W. Germanic 1%
Political lean MEDSL · Richmond
- 2024 margin
- Solid D (+36.1) · D 67.8% · R 31.7%
- 2008→2024 swing
- +4.3pp toward D · 2008: 31.8pp · 2024: 36.1pp
- All cycles
- 2024: D+36.1 2020: D+37.2 2016: D+32.4 2012: D+33.8 2008: D+31.8
Not yet ingested
- Civics
- —
Market trends
- HPI YoY
- ▼ -58.99%
- Current HPI
- 213.5733
- Rent YoY
- ▼ -0.25%
- Metro
- Augusta-Richmond County, GA-SC
- State GDP YoY
- ▲ 2.66%
- F500 in state
- 28
Industry mix (Fortune 500 HQ in GA)
| Industry | F500 HQs | Revenue |
|---|---|---|
| Paper / Packaging | 2 | $29B |
|
||
| Retail | 1 | $160B |
|
||
| Transportation / Logistics | 1 | $91B |
|
||
| Airlines | 1 | $62B |
|
||
| Consumer Goods | 1 | $47B |
|
||
| Utilities | 1 | $25B |
|
||
Price history
+127.0% since first listed18 events — show timeline
- 2026-05-11 Listing Removed — Hive MLS
- 2026-01-19 Price Changed $84,000 Hive MLS
- 2025-10-06 Listed $84,000 Hive MLS
- 2025-10-06 Listed $89,000 Hive MLS
- 2025-05-07 Listing Removed — Hive MLS
- 2025-05-07 Listing Removed — Hive MLS
- 2025-04-25 Listed $104,900 Hive MLS
- 2025-04-25 Listed $104,900 Hive MLS
- 2024-07-26 Listing Removed — Hive MLS
- 2024-07-26 Listing Removed — Hive MLS
- 2024-04-09 Listed $104,900 Hive MLS
- 2024-04-09 Listed $104,900 Hive MLS
- 2023-05-16 Listing Removed — Hive MLS
- 2023-05-16 Listing Removed — Hive MLS
- 2023-05-10 Listed $104,900 Hive MLS
- 2023-05-10 Listed $104,900 Hive MLS
- 2022-09-27 Sold (Public Records) $67,000 Public Records
- 2021-08-06 Sold (Public Records) $37,000 Public Records
Property tax history
+3.9%/yrLatest (2025): $1,215 · +1.5% YoY. Source: county tax records.
Cash-flow waterfall
monthlySold comps — $/sqft
last 12 mo · ≤1 miLoading sold comps…