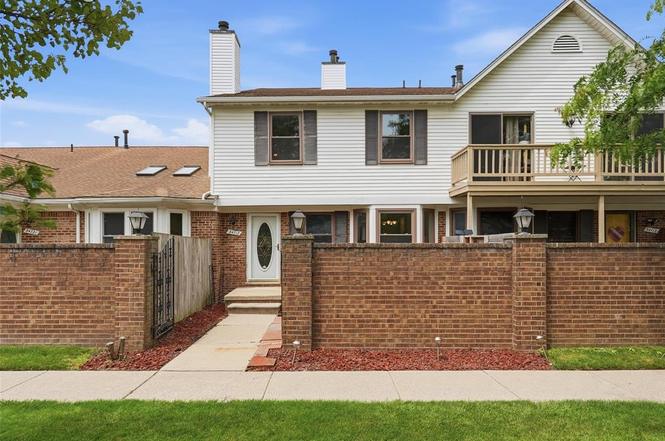
34717 E Wilma Ct · New Baltimore, MI
Flood risk 1/10 · Minimal
- FEMA flood zone
- X (unshaded)
- Chance of flooding over 30 yrs
- 0.0%
- Est. flood insurance / yr
- $473 – $860
Fire risk 1/10 · Minimal
- Est. fire insurance / yr
- $784 – $1,456
Heat risk 3/10 · Minor
- Hot days now (above 96°F)
- 7 days/yr
- Hot days in 30 yrs
- 15 days/yr
Wind risk 1/10 · Minimal
- Chance of severe wind over 30 yrs
- —
Air-quality risk 4/10 · Minor
- Unhealthy air days now
- 4 days/yr
- Unhealthy air days in 30 yrs
- 5 days/yr
Risk factors via First Street. Map © Google.
Why this score? — see what drove the D+ grade
The composite is a weighted blend of 9 inputs, each scored 0–100. Each bar is that input's sub-score; the figure is the points it added to the 100-point composite (weight × sub-score).
- Cash flow +16.9/30.0
- ARV discount +7.5/15.0
- 1% rule +6.5/10.0
- DSCR +5.2/10.0
- Schools +4.4/10.0
- Livability +4.2/5.0
- Rent growth +2.5/5.0
- Condition / age +2.5/5.0
- Appreciation +0.0/10.0
$160,000
🖨 Deal sheet (PDF) 📄 Offer letter ✓ Due diligence
Listing remarks MLS
HUD home. Sold 'AS IS' by Elec Bid only. For Prop. conditions, Forms, Discl, Avail & Owner Occupant Incentives see Website in Agent Remarks * . FHA Case #261-819113. Insured w Escrow repairs $550. Bids due by 08-11-09 11:59 PM or daily until sold. MCB makes no warranty as to current or future existence of mold in this property and is not liable for the potentially harmful effects thereof. HOA dues are $136 per month.
Key facts
- Close to water
- Private patio
- $245 HOA
Tags
Property features AI
Finance
- Other: Pets allowed with restrictions (number and size limits may apply)
- HOA & community: Monthly association fee of $245; Association covers lawn maintenance, snow removal, trash removal, and exterior maintenance
Exterior
- Parking: Attached 1-car garage
- Utilities: Public water; Natural gas service; Gas water heater; Public sewer (implied by typical condo utilities)
- Home design: Condominium; 2-story structure; Built in 1988; Basement present (partially finished)
- Construction: Brick construction; Basement foundation
- Exterior features: Brick exterior; Patio and porch; Paved street access
Interior
- Kitchen: Kitchen on entry level with ceramic flooring, about 8 x 14; Appliances: Dishwasher, Microwave, Range/Oven, Refrigerator
- Bedrooms: Bedroom 1 (second level) — carpeted, about 11 x 15; Bedroom 2 (second level) — carpeted, about 8 x 12
- Flooring: Ceramic flooring in kitchen, dining room, and bathrooms; Carpet in living room and bedrooms; Concrete flooring in laundry room
- Bathrooms: One full bathroom (second level) with ceramic flooring, approximately 8 x 4; One lavatory (entry level) with ceramic flooring, approximately 5 x 2
- Heating & cooling: Forced air heating (natural gas); Central air conditioning; Ceiling fans
- Interior features: Gas fireplace in the living room; Partially finished basement
- Laundry & utility: Laundry room in basement (about 10 x 12) with concrete floor; Washer and Dryer included; Gas water heater
Neighborhood map
What this means for you Summary
Snapshot
- This is a 2-bed/1.5-bath condo listed at $160k.
Deal economics
- At list price, monthly cash flow is $105 ($1k/yr) — positive.
- The deal already cash-flows at list — no discount required.
- Meets the 1% rule at list price ($2k rent vs $160k).
- Cap rate 7.1% vs local median 2.5% in New Baltimore — top-decile yield for the area; either an underpriced asset or a hidden risk that comps aren't pricing in. Stress-test before assuming the spread holds.
Location & tenants
- Location reads 85/100 on livability (#30 in MI, #597 nationally) — a professional / high-income tenant draw. Strengths: crime A+, employment A+, cost of living A+; Watch: health & safety D+, amenities F.
- Anchor Bay School District (suburban): math 44% / reading 54% proficiency, ranked #91 of 540 in MI (top 17%) — families likely to look elsewhere, expect single-tenant / working-renter base with shorter leases; only 20% free/reduced lunch — higher-income household profile.
- Market conditions: 237 active listings in the ZIP; 4 comparable units currently listed for rent nearby; rentals lingering (median 45d on market — plan ~5-8 weeks vacancy on turnover, expect pricing pressure); 50% of comp listings sitting > 30 days — soft ceiling on asking rent; solid renter incomes; 1,321 units permitted in Macomb County in 2024 (86 in 5+ unit buildings).
Forward outlook
- Local home prices are declining (-3.0%/yr); year-one equity from $1k of loan paydown is wiped out by about $5k of value loss. Plan a longer hold.
- Macomb County population projected at +9% by 2050 — modest demand growth; plan on rents tracking national, not racing it.
Negotiation context
- Only 2 days on market — expect competitive offers; lowballing is unlikely to land.
- 12 sale attempts since 32y ago; this cycle's ask is 700% above the opening price — seller raised mid-cycle; expect resistance to lowballs.
- Current owner paid $37k; list at $160k implies a 332% gain — meaningful room to come down on a strong offer.
Questions for the listing agent
- What does the HOA fee cover, when was the last increase, and are there any pending special assessments or reserve-fund shortfalls?
- Any open or pending special assessments — roof, HVAC, plumbing, elevator, façade? What's the per-unit balance and payoff schedule, and is the seller paying it off at close or rolling it to the buyer?
- Is there a deadline driving the sale (1031 exchange, divorce, estate, relocation)? That informs how much negotiation room exists.
- Schools are B-rated — typically a magnet for longer-tenancy family renters. What's the average tenant stay here, and is there a school-zone premium baked into asking?
- The area grade is low — what's the realistic commute time and amenity access for the typical tenant pool here? Any planned neighborhood developments (good or bad) we should know about?
- What's the average days-on-market for RENTAL listings here right now (not sales)? A rising rental-DOM trend means longer vacancies and softer asking-rent achievability than the comps imply.
- What's the recent tenant-quality profile in this submarket — average credit score on applications, eviction rate, late-payment / NSF rate, and stable-employment percentage? A property-management company in the area should have these aggregated.
- How much new apartment / multifamily construction is in the pipeline within 1–3 miles? Heavy new supply (>2% of stock underway) typically softens rents 12–24 months out; light construction supports rent growth.
Investment metrics
- 1% rule
- 1.15% ✓
- Cap rate
- 7.08%
- Cash-on-cash
- 2.80%
- DSCR
- 1.12
- GRM
- 7.2
CMA / ARV
No comps found within radius.
Projected returns pro-forma
-3.0% appreciation · 3.0% rent growth · sell at horizon
- IRR
- -11.7%
- Equity multiple
- 0.57×
- Total profit
- $-19,089
- Equity at exit
- $23,857
- IRR
- -2.4%
- Equity multiple
- 0.84×
- Total profit
- $-7,322
- Equity at exit
- $13,834
Cash invested: $44,800 (down + closing). Projections, not guarantees.
Landlord ↔ Tenant lean methodology
- Overall (STATE)
- 62 Landlord-Friendly
- State Michigan
- 62 Landlord-Friendly · EVEN
- County
- — inherits STATE
- City
- — inherits STATE
ZIP-level market 48047
- Active inventory
- 237
- Price-to-rent
- 7.2×
Monthly cashflow live
- Estimated rent
- $1,842 medium interval (Pro) →
- Mortgage (P&I)
- −$839
- Tax est. 1.5%
- −$200 /mo · $2,400/yr
- Insurance
- −$67
- HOA
- −$245
- Vacancy / Maint / Mgmt
- −$387
- Net cashflow
- $105
Break-even live
Sensitivity live
| Price | -10% $215 | -5% $160 | +0% $105 | +5% $49 | +10% $-6 |
|---|---|---|---|---|---|
| Rent | -10% $-41 | -5% $32 | +0% $105 | +5% $177 | +10% $250 |
| Rate | -1.0pp $185 | -0.5pp $145 | base $105 | +0.5pp $63 | +1.0pp $21 |
UW: 25.0% down · 7.5% · 30yr · 1.5% tax · 5.0% vac · 8.0% maint · 8.0% mgmt
Financing live
Cash to close
- Down payment
- $40,000
- Closing costs
- $4,800
- Reserves months
- —
- Total cash needed
- —
Loan-product check · same deal, 3 products live
Conventional
25% down · 7.5% · 30yr
- Down + closing
- —
- Monthly P&I
- —
- Monthly cashflow
- —
- DSCR
- —
- Eligible?
- —
Personal DTI + credit; lowest rate.
DSCR
20% down · 8.5% · 30yr
- Down + closing
- —
- Monthly P&I
- —
- Monthly cashflow
- —
- DSCR
- —
- Eligible?
- —
No personal income docs; deal must DSCR.
Hard money
10% down · 12.0% · 12mo
- Down + closing
- —
- Monthly P&I
- —
- Monthly cashflow
- —
- DSCR
- —
- Eligible?
- —
Short-term bridge; refi at stabilization.
Rent comps 4 comps
| Address | Beds | Baths | Sqft | Rent | $/sqft | DOM | Units | Dist |
|---|---|---|---|---|---|---|---|---|
| 32968 Antrim Dr New Baltimore, MI | 2.0 | 2.0 | 1400 | $2,190 | $1.56 | 45d | 1 | 0.86mi |
| 31871 Gabby CT New Baltimore, MI | 2.0 | 2.0 | 1131 | $1,995 | $1.76 | 0d | 5 | 0.90mi |
| 35711 Alfred St Unit 8 New Baltimore, MI | 2.0 | 1.5 | 2000 | $1,600 | $0.80 | 19d | 1 | 0.96mi |
| 33523 Roselawn St New Baltimore, MI | 2.0 | 2.5 | 1700 | $1,995 | $1.17 | 45d | 1 | 1.42mi |
HOA detail condo
- Monthly dues
- $245 · $2,940/yr
- Assessments
- None detected in remarks — confirm with the listing agent.
Listing history 3 events
-
2026-06-21statusdays on market $160,000 Active 2 DOM
-
2026-06-19remarks 575-char remark
-
2026-06-19$160,000 Coming Soon 1 DOM
ⓘ Source: listings_history table (triggers on properties + properties_extension) + one-shot
backfill from property_details.listing_events for pre-trigger history.
Climate risk First Street
- Flood 1/10 Low FEMA zone X (unshaded) · 0% chance over 30 yrs
- Wildfire 1/10 Low
- Heat 3/10 Moderate 7 d/yr ≥96°F today · 15 d/yr by 30 yrs out
- Wind 1/10 Low
- Air quality 4/10 Moderate 4 unhealthy d/yr today · 5 by 30 yrs out
Nearby sold comps map
Loading sold comps map…
Walkable amenities ~0.75 mi
Loading nearby amenities…
Taxation est. · year 1
- Rental income
- $22,106
- − Mortgage interest
- −$8,962
- − Property taxes
- −$2,400
- − Insurance
- −$800
- − Repairs & maintenance
- −$1,768
- − Management
- −$1,768
- − HOA
- −$2,940
- − Depreciation
- −$4,655
- Taxable loss
- −$1,188
- Est. tax savings @ 24.0%
- +$285
- After-tax cash flow
- $1,540/yr
For passive investors: Depreciation is non-cash, so a rental often shows a tax loss while cash-flowing — sheltering income. Rental losses are passive: they offset passive income freely, and up to $25,000/yr can offset ordinary (W-2) income if you actively participate and your MAGI is under $100k (phasing out to $0 by $150k); unused losses carry forward. On sale, claimed depreciation is recaptured at up to 25%, and gains may owe capital-gains tax (a 1031 exchange can defer both). Figures are a year-1 estimate at your 24.0% rate — not tax advice; consult a CPA.
Schools (NCES district)
- District
- Anchor Bay School District
- NCES district ID
- 2602790
- Math proficiency
- 44% ▼ -12.00%
- Reading proficiency
- 54% ▼ -7.00%
- Median HH income
- $70,173
- Composite
- 43.85/100
- National rank
- #2925
- State rank
- #91 of 540 in MI
Livability — New Baltimore
- Score
- 85/100
- State rank
- #30
- US rank
- #597
Category grades
Schools grade is shown separately in the Schools card above.
Census & demographics
- County
- Macomb County · 638,552 people
- Metro
- Detroit-Warren-Dearborn, MI
- Population (ZIP)
- 40,302
- Household income
- $94,890
- Rent vs Own
- Severe rent burden
- 529.0
Population outlook (Macomb County) Hauer SSP2
- Today (2025)
- 925,296 people
- By 2030
- 948,226 · +2.5%
- By 2040
- 983,961 · +6.3%
- By 2050
- 1,010,200 · +9.2%
- By 2075
- 1,076,222 · +16.3%
- By 2100
- 1,077,065 · +16.4%
Race, ethnicity, and origin ACS 2023
- Neighborhood character
- Predominantly White (85%)
- Race & ethnicity
- White 85% Two or more races 6% Black 5% Hispanic / Latino 4% Asian 2%
- Common ancestry
- Romanian 16% Lithuanian 6% Slovak 3%
- Foreign-born
- 3% · Canada
- Languages at home
- 96% English-only · Spanish 1% Other Indo-European 1% Russian/Polish/Slavic 1%
Political lean MEDSL · Macomb
- 2024 margin
- R (+13.7) · D 42.2% · R 55.9% · Other 1.9%
- 2008→2024 swing
- -22.3pp toward R · 2008: 8.6pp · 2024: -13.7pp
- All cycles
- 2024: R+13.7 2020: R+8.1 2016: R+11.6 2012: D+4.0 2008: D+8.6
Not yet ingested
- Civics
- —
Market trends
- HPI YoY
- ▼ -265.06%
- Current HPI
- 216.5914
- Rent YoY
- —
- Metro
- Detroit-Warren-Dearborn, MI
- State GDP YoY
- ▲ 1.37%
- F500 in state
- 28
Industry mix (Fortune 500 HQ in MI)
| Industry | F500 HQs | Revenue |
|---|---|---|
| Automotive Parts | 3 | $48B |
|
||
| Automotive | 2 | $372B |
|
||
| Chemicals | 1 | $45B |
|
||
| Automotive Retail | 1 | $29B |
|
||
| Healthcare / Medical Devices | 1 | $23B |
|
||
| Automotive Technology | 1 | $20B |
|
||
Price history
+139.2% since first listed28 events — show timeline
- 2026-06-18 Coming Soon $160,000 MiRealSource-MiMLS
- 2009-10-16 Sold (MLS) $37,000 MiRealSource-MiMLS
- 2009-10-16 Sold (MLS) $37,000 REALCOMP
- 2009-08-12 Listing Removed — MiRealSource-MiMLS
- 2009-08-07 Listed $20,000 MiRealSource-MiMLS
- 2009-08-07 Listed $20,000 REALCOMP
- 2009-07-27 Listing Removed — REALCOMP
- 2009-07-24 Listing Removed — MiRealSource-MiMLS
- 2009-07-17 Listing Removed — REALCOMP
- 2009-07-17 Listing Removed — MiRealSource-MiMLS
- 2009-07-17 Listed $40,000 MiRealSource-MiMLS
- 2009-07-17 Listed $40,000 REALCOMP
- 2009-04-24 Listing Removed — REALCOMP
- 2009-04-24 Listing Removed — MiRealSource-MiMLS
- 2009-04-24 Listed $40,000 REALCOMP
- 2009-04-24 Listed $40,000 MiRealSource-MiMLS
- 2008-06-06 Listed $48,000 REALCOMP
- 2008-06-06 Listed $48,000 MiRealSource-MiMLS
- 2008-04-01 Listing Removed — REALCOMP
- 2008-03-31 Listing Removed — MiRealSource-MiMLS
- 2008-02-25 Listed $80,000 MiRealSource-MiMLS
- 2008-02-15 Listed $80,000 REALCOMP
- 2001-01-12 Sold (MLS) $105,000 MiRealSource-MiMLS
- 2000-10-30 Listing Removed — MiRealSource-MiMLS
- 2000-07-31 Listed $110,000 MiRealSource-MiMLS
- 1994-09-19 Listing Removed — MiRealSource-MiMLS
- 1994-09-16 Sold (MLS) $66,500 MiRealSource-MiMLS
- 1994-03-30 Listed $66,900 MiRealSource-MiMLS
Cash-flow waterfall
monthlySold comps — $/sqft
last 12 mo · ≤1 miLoading sold comps…