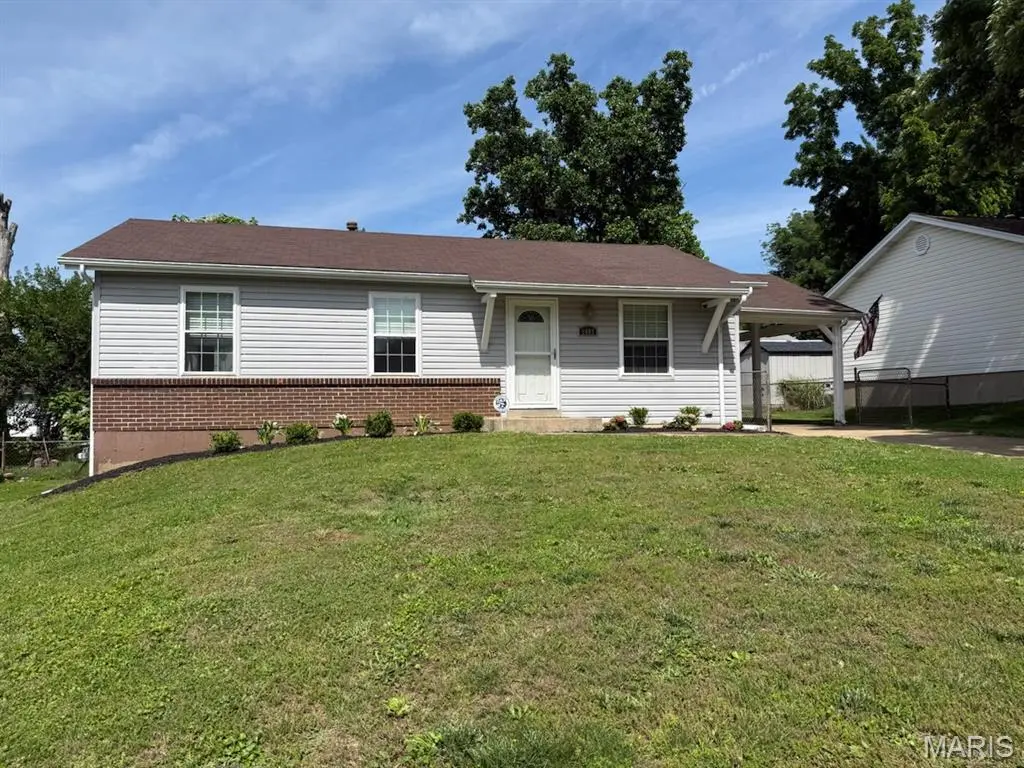
1407 Saint Gregory Ln · St. Peters, MO
Flood risk 1/10 · Minimal
- FEMA flood zone
- X (unshaded)
- Chance of flooding over 30 yrs
- 0.0%
- Est. flood insurance / yr
- $473 – $860
Fire risk 1/10 · Minimal
- Est. fire insurance / yr
- $1,054 – $1,958
Heat risk 5/10 · Moderate
- Hot days now (above 108°F)
- 7 days/yr
- Hot days in 30 yrs
- 20 days/yr
Wind risk 2/10 · Minimal
- Chance of severe wind over 30 yrs
- 1.0%
Air-quality risk 2/10 · Minimal
- Unhealthy air days now
- 2 days/yr
- Unhealthy air days in 30 yrs
- 2 days/yr
Risk factors via First Street. Map © Google.
Why this score? — see what drove the D grade
The composite is a weighted blend of 9 inputs, each scored 0–100. Each bar is that input's sub-score; the figure is the points it added to the 100-point composite (weight × sub-score).
- Cash flow +14.2/30.0
- ARV discount +8.4/15.0
- Schools +5.2/10.0
- DSCR +4.3/10.0
- 1% rule +3.3/10.0
- Rent growth +3.1/5.0
- Livability +2.5/5.0
- Condition / age +2.5/5.0
- Appreciation +0.0/10.0
$260,000
🖨 Deal sheet (PDF) 📄 Offer letter ✓ Due diligence
Listing remarks MLS
Don't miss this home with tons of updates. If you are looking for updates here is the home for you! Walk in to the living room that overlooks a completely remodeled kitchen. Go down the hall and you will find a full bath, and two other bedrooms. At the end of the hall is the master bedroom. The basement is partially finished, and the backyard is fenced. There are new floors throughout the whole main level, in the kitchen there are new floors, new counter-tops, new back-splash, along with a new microwave, dishwasher, and barn door to the pantry. New solid custom doors throughout the main level, and exterior doors. The basement is also newly finished with laminate flooring. Outside there is all new siding and landscaping as well. Refrigerator to stay. Don't miss this home!
Key facts
- 6,337 sq ft lot
- Parking
- Built 1974
Property features AI
Exterior
- Parking: Attached carport (1 space); Driveway
- Utilities: Public water; Public sewer; Electricity connected (Ameren); Natural gas connected
- Home design: Single family residence; One level; Updated/remodeled; Private ownership
- Construction: Frame construction with vinyl siding; Architectural shingle roof; Has full basement
- Exterior features: Back yard
Interior
- Kitchen: Eat-in kitchen; Pantry; Kitchen/dining room combo
- Bedrooms: 3 bedrooms on the main level
- Bathrooms: 1 full bathroom (main level)
- Heating & cooling: Forced air heating; Central air conditioning
- Interior features: Eat-in kitchen; Kitchen/dining room combo; Pantry; Partially finished basement (8 ft+ pour, concrete)
- Laundry & utility: Laundry in basement
Neighborhood map
What this means for you Summary
Snapshot
- This is a 3-bed/1.0-bath single-family listed at $260k.
Deal economics
- At list price, monthly cash flow is $45 ($537/yr) — positive.
- The deal already cash-flows at list — no discount required.
- To meet the 1% rule (rent ≥ 1% of price), the offer needs to be $217k (16.7% below list).
- Recommended offer: $217k (16.7% below list) — sets the bar for 1% rule.
- Cap rate 6.5% vs local median 4.2% in St. Peters — top-decile yield for the area; either an underpriced asset or a hidden risk that comps aren't pricing in. Stress-test before assuming the spread holds.
Location & tenants
- Location reads: area grade D — affects rentability + tenant quality, not the cash-flow math above.
- Francis Howell R-III (suburban): math 53% / reading 63% proficiency, ranked #11 of 324 in MO (top 3%) — acceptable for families but not a draw, mixed tenant base, ~2y average lease; only 15% free/reduced lunch — higher-income household profile.
- Zoned schools: Central Elem. (math 40% / reading 52%, grade D-, #402 of 1,115 statewide, top 36%, 831 students, 32% FRL); Bryan Middle (math 52% / reading 62%, grade B, #33 of 391 statewide, top 9%, 813 students, 15% FRL); Francis Howell Central High (math 36% / reading 74%, grade C, #65 of 521 statewide, top 13%, 1,805 students, 18% FRL).
- Market conditions: Rents rising (+2.5%/yr); 283 active listings in the ZIP; 8 comparable units currently listed for rent nearby; rentals leasing fast (median 10d on market — plan ~1-2 weeks tenant-placement turnaround); high-income renter base; 2,021 units permitted in St. Charles County in 2024 (568 in 5+ unit buildings).
Forward outlook
- Local home prices are declining (-3.0%/yr); year-one equity from $2k of loan paydown is wiped out by about $8k of value loss. Plan a longer hold.
- St. Charles County population projected at +22% by 2050 — long-run rental-demand tailwind backs the buy-and-hold thesis.
Negotiation context
- Only 1 days on market — expect competitive offers; lowballing is unlikely to land.
- Current owner paid $163k; list at $260k implies a 59% gain — meaningful room to come down on a strong offer.
Risks & watch-outs
- Climate carrying-cost: extreme-heat days projected 7→20/yr by 2055 (HVAC capex compounding) — expect insurance premiums to compound above CPI over the hold.
Questions for the listing agent
- Built in 1974 — when were the roof, HVAC, electrical panel, plumbing, and water heater last replaced?
- What does the HOA fee cover, when was the last increase, and are there any pending special assessments or reserve-fund shortfalls?
- Is there a deadline driving the sale (1031 exchange, divorce, estate, relocation)? That informs how much negotiation room exists.
- The area grade is low — what's the realistic commute time and amenity access for the typical tenant pool here? Any planned neighborhood developments (good or bad) we should know about?
- What's the average days-on-market for RENTAL listings here right now (not sales)? A rising rental-DOM trend means longer vacancies and softer asking-rent achievability than the comps imply.
- What's the recent tenant-quality profile in this submarket — average credit score on applications, eviction rate, late-payment / NSF rate, and stable-employment percentage? A property-management company in the area should have these aggregated.
- How much new for-sale + rental construction is in the pipeline within 1–3 miles? Heavy new supply typically softens prices + rents 12–24 months out; constrained supply supports both.
Investment metrics
- 1% rule
- 0.83% ✗
- Cap rate
- 6.50%
- Cash-on-cash
- 0.74%
- DSCR
- 1.03
- GRM
- 10.0
CMA / ARV
- ARV (on-the-fly)
- $265,356
- Comps found
- 12
Show comp detail 12 sales within ~0.75 mi
| Address | Dist | Beds/Ba | Sqft | Sold | Price | $/sf | Match |
|---|---|---|---|---|---|---|---|
| 1454 De Porres Ln | 0.16mi | 3/1.0 | 1,314 (-6%) | 1mo | $220,000 | $167 | 81 |
| 1422 Ramona Ln | 0.09mi | 3/1.0 | 1,264 (-10%) | 1mo | $249,900 | $198 | 78 |
| 1410 De Porres Ln | 0.09mi | 3/2.0 | 1,296 (-8%) | 8mo | $260,000 | $201 | 72 |
| 1332 Ramona Ln | 0.16mi | 2/2.0 (-1) | 1,320 (-6%) | 3mo | $249,900 | $189 | 71 |
| 1405 De Porres Ln | 0.13mi | 3/1.0 | 1,555 (+11%) | 7mo | $235,000 | $151 | 71 |
| 1326 Ramona Ln | 0.19mi | 3/2.0 | 1,555 (+11%) | 5mo | $269,900 | $174 | 65 |
| 4025 Mary Ridge Ln | 0.29mi | 3/1.0 | 1,264 (-10%) | 7mo | $250,000 | $198 | 64 |
| 1260 N Brampton Dr | 0.39mi | 3/3.0 | 1,453 (+4%) | 8mo | $305,000 | $210 | 61 |
| 1427 Caulks Hill Rd | 0.70mi | 3/1.0 | 1,536 (+9%) | 4mo | $270,000 | $176 | 48 |
| 3982 Cambridge Crossing Dr | 0.61mi | 3/2.0 | 1,523 (+8%) | 7mo | $350,000 | $230 | 48 |
| 16 Garden Gate Ct | 0.50mi | 3/2.5 | 1,546 (+10%) | 10mo | $285,000 | $184 | 45 |
| 57 Broken Oak Ct Unit 44A | 0.40mi | 2/2.0 (-1) | 1,580 (+12%) | 9mo | $229,900 | $146 | 44 |
Match score weights: distance 35% · size 25% · config 20% · recency 20%. Top-matched comps best support the ARV.
Projected returns pro-forma
-3.0% appreciation · 2.52% rent growth · sell at horizon
- IRR
- -15.6%
- Equity multiple
- 0.45×
- Total profit
- $-40,369
- Equity at exit
- $38,767
- IRR
- -8.0%
- Equity multiple
- 0.51×
- Total profit
- $-35,906
- Equity at exit
- $22,480
Cash invested: $72,800 (down + closing). Projections, not guarantees.
Landlord ↔ Tenant lean methodology
- Overall (STATE)
- 81 Strongly Landlord-Friendly
- State Missouri
- 81 Strongly Landlord-Friendly · R+10
- County
- — inherits STATE
- City
- — inherits STATE
ZIP-level market 63304
- Rents YoY
- 2.5%
- Active inventory
- 283
- Price-to-rent
- 10.0×
Monthly cashflow live
- Estimated rent
- $2,166 high interval (Pro) →
- Mortgage (P&I)
- −$1,363
- Tax from tax record
- −$187 /mo · $2,250/yr
- Insurance
- −$108
- HOA
- −$7
- Vacancy / Maint / Mgmt
- −$455
- Net cashflow
- $45
Break-even live
Sensitivity live
| Price | -10% $192 | -5% $118 | +0% $45 | +5% $-29 | +10% $-102 |
|---|---|---|---|---|---|
| Rent | -10% $-126 | -5% $-41 | +0% $45 | +5% $130 | +10% $216 |
| Rate | -1.0pp $176 | -0.5pp $111 | base $45 | +0.5pp $-23 | +1.0pp $-91 |
UW: 25.0% down · 7.5% · 30yr · 1.5% tax · 5.0% vac · 8.0% maint · 8.0% mgmt
Financing live
Cash to close
- Down payment
- $65,000
- Closing costs
- $7,800
- Reserves months
- —
- Total cash needed
- —
Loan-product check · same deal, 3 products live
Conventional
25% down · 7.5% · 30yr
- Down + closing
- —
- Monthly P&I
- —
- Monthly cashflow
- —
- DSCR
- —
- Eligible?
- —
Personal DTI + credit; lowest rate.
DSCR
20% down · 8.5% · 30yr
- Down + closing
- —
- Monthly P&I
- —
- Monthly cashflow
- —
- DSCR
- —
- Eligible?
- —
No personal income docs; deal must DSCR.
Hard money
10% down · 12.0% · 12mo
- Down + closing
- —
- Monthly P&I
- —
- Monthly cashflow
- —
- DSCR
- —
- Eligible?
- —
Short-term bridge; refi at stabilization.
Rent comps 8 comps
| Address | Beds | Baths | Sqft | Rent | $/sqft | DOM | Units | Dist |
|---|---|---|---|---|---|---|---|---|
| 1360 Park Ashwood Dr St Charles, MO | 2.0–3.0 | 2.0 | 1038 | $1,725 | $1.66 | 3d | 5 | 0.72mi |
| 3891 Cambridge Crossing Dr Saint Charles, MO | 3.0 | 2.0 | 1509 | $2,396 | $1.59 | 5d | 1 | 0.89mi |
| 1400 Navaho Trl Saint Charles, MO | 4.0 | 2.0 | 1700 | $2,166 | $1.27 | 13d | 1 | 0.98mi |
| 4507 Cambrook Dr Saint Charles, MO | 3.0 | 2.0 | 1279 | $2,300 | $1.80 | 13d | 1 | 1.01mi |
| 1400 Britain Way St Charles, MO | 1.0–2.0 | 1.0 | 762 | $1,484 | $1.95 | 3d | 7 | 1.15mi |
| 145 Sesame Loop Unit 1 St Charles, MO | 3.0 | 2.5 | 1869 | $2,450 | $1.31 | 9d | 1 | 1.21mi |
| 4153 McClay Rd Saint Charles, MO | 3.0 | 2.0 | 1096 | $2,100 | $1.92 | 45d | 1 | 1.22mi |
| 3515 Ridgewood Dr Saint Charles, MO | 3.0 | 2.5 | 1677 | $2,535 | $1.51 | 6d | 1 | 1.25mi |
HOA detail
- Monthly dues
- $7 · $84/yr
- Likely covers
- landscaping
Listing history 12 events
-
2026-05-26historical $260,000
-
2019-11-05soldstatus $163,250
-
2019-10-25soldstatus Closed 781-char remark
Show marketing remark (781 chars)
Don't miss this home with tons of updates. If you are looking for updates here is the home for you! Walk in to the living room that overlooks a completely remodeled kitchen. Go down the hall and you will find a full bath, and two other bedrooms. At the end of the hall is the master bedroom. The basement is partially finished, and the backyard is fenced. There are new floors throughout the whole main level, in the kitchen there are new floors, new counter-tops, new back-splash, along with a new microwave, dishwasher, and barn door to the pantry. New solid custom doors throughout the main level, and exterior doors. The basement is also newly finished with laminate flooring. Outside there is all new siding and landscaping as well. Refrigerator to stay. Don't miss this home!
-
2019-09-18historical Active Under Contract 781-char remark
Show marketing remark (781 chars)
Don't miss this home with tons of updates. If you are looking for updates here is the home for you! Walk in to the living room that overlooks a completely remodeled kitchen. Go down the hall and you will find a full bath, and two other bedrooms. At the end of the hall is the master bedroom. The basement is partially finished, and the backyard is fenced. There are new floors throughout the whole main level, in the kitchen there are new floors, new counter-tops, new back-splash, along with a new microwave, dishwasher, and barn door to the pantry. New solid custom doors throughout the main level, and exterior doors. The basement is also newly finished with laminate flooring. Outside there is all new siding and landscaping as well. Refrigerator to stay. Don't miss this home!
-
2019-09-12$165,000 Active 781-char remark
Show marketing remark (781 chars)
Don't miss this home with tons of updates. If you are looking for updates here is the home for you! Walk in to the living room that overlooks a completely remodeled kitchen. Go down the hall and you will find a full bath, and two other bedrooms. At the end of the hall is the master bedroom. The basement is partially finished, and the backyard is fenced. There are new floors throughout the whole main level, in the kitchen there are new floors, new counter-tops, new back-splash, along with a new microwave, dishwasher, and barn door to the pantry. New solid custom doors throughout the main level, and exterior doors. The basement is also newly finished with laminate flooring. Outside there is all new siding and landscaping as well. Refrigerator to stay. Don't miss this home!
-
2009-09-23soldstatus $127,200
-
2007-08-01soldstatus $132,500
-
2004-08-30soldstatus $121,000
-
2002-01-22soldstatus $94,900
-
1990-07-01soldstatus
-
1990-07-01soldstatus $53,000
-
1982-11-01soldstatus $48,500
ⓘ Source: listings_history table (triggers on properties + properties_extension) + one-shot
backfill from property_details.listing_events for pre-trigger history.
Tax reassessment forecast MO · Resets to sale price
- Current annual tax
- $2,250 · $187/mo
- Projected year-2 tax
- $2,522 · $210/mo
- Expected delta
- +$272/yr (+$23/mo · 12.1%)
ⓘ Screening estimate from a state-policy table — verify with the county assessor before closing.
Climate risk First Street
- Flood 1/10 Low FEMA zone X (unshaded) · 0% chance over 30 yrs
- Wildfire 1/10 Low
- Heat 5/10 Major 7 d/yr ≥108°F today · 20 d/yr by 30 yrs out
- Wind 2/10 Low 100% chance of damaging wind over 30 yrs
- Air quality 2/10 Low 2 unhealthy d/yr today · 2 by 30 yrs out
Nearby sold comps map
Loading sold comps map…
Walkable amenities ~0.75 mi
Loading nearby amenities…
Taxation est. · year 1
- Rental income
- $25,991
- − Mortgage interest
- −$14,564
- − Property taxes
- −$2,250
- − Insurance
- −$1,300
- − Repairs & maintenance
- −$2,079
- − Management
- −$2,079
- − HOA
- −$84
- − Depreciation
- −$7,564
- Taxable loss
- −$3,929
- Est. tax savings @ 24.0%
- +$943
- After-tax cash flow
- $1,480/yr
For passive investors: Depreciation is non-cash, so a rental often shows a tax loss while cash-flowing — sheltering income. Rental losses are passive: they offset passive income freely, and up to $25,000/yr can offset ordinary (W-2) income if you actively participate and your MAGI is under $100k (phasing out to $0 by $150k); unused losses carry forward. On sale, claimed depreciation is recaptured at up to 25%, and gains may owe capital-gains tax (a 1031 exchange can defer both). Figures are a year-1 estimate at your 24.0% rate — not tax advice; consult a CPA.
Schools (NCES district)
- District
- Francis Howell R-III
- NCES district ID
- 2928950
- Math proficiency
- 53% ▼ -12.00%
- Reading proficiency
- 63% ▼ -5.00%
- Median HH income
- $79,768
- Composite
- 52.23/100
- National rank
- #1602
- State rank
- #11 of 324 in MO
Livability — St. Peters
No livability data for this city. (Only ~50 U.S. cities are tracked.)
Census & demographics
- County
- Saint Charles County · 399,703 people
- City population
- 74,876
- Metro
- St. Louis, MO-IL
- Population (ZIP)
- 43,195
- Household income
- $114,442
- Rent vs Own
- Severe rent burden
- 560.0
Population outlook (St. Charles County) Hauer SSP2
- Today (2025)
- 437,857 people
- By 2030
- 461,707 · +5.4%
- By 2040
- 503,222 · +14.9%
- By 2050
- 534,684 · +22.1%
- By 2075
- 597,047 · +36.4%
- By 2100
- 609,682 · +39.2%
Race, ethnicity, and origin ACS 2023
- Neighborhood character
- Predominantly White (87%)
- Race & ethnicity
- White 87% Two or more races 4% Hispanic / Latino 4% Black 4% Asian 2%
- Common ancestry
- Lithuanian 3% Romanian 3% Italian 3%
- Foreign-born
- 5% · Canada
- Languages at home
- 95% English-only · Spanish 2% Other Indo-European 1% Russian/Polish/Slavic 1%
Political lean MEDSL · St. Charles
- 2024 margin
- R (+17.0) · D 40.8% · R 57.8% · Other 1.4%
- 2008→2024 swing
- -7.2pp toward R · 2008: -9.7pp · 2024: -17.0pp
- All cycles
- 2024: R+17.0 2020: R+17.5 2016: R+26.4 2012: R+21.0 2008: R+9.7
Not yet ingested
- Civics
- —
Market trends
- HPI YoY
- ▼ -225.72%
- Current HPI
- 233.745
- Rent YoY
- ▲ 2.52%
- Metro
- St. Louis, MO-IL
- State GDP YoY
- ▲ 1.84%
- F500 in state
- 20
Industry mix (Fortune 500 HQ in MO)
| Industry | F500 HQs | Revenue |
|---|---|---|
| Healthcare | 1 | $163B |
|
||
| Insurance | 1 | $21B |
|
||
| Industrial Technology | 1 | $17B |
|
||
| Retail | 1 | $16B |
|
||
| Industrial Distribution | 1 | $10B |
|
||
| Utilities | 1 | $9B |
|
||
Price history
+436.1% since first listed12 events — show timeline
- 2026-05-26 Coming Soon $260,000 MARIS as Distributed by MLS Grid
- 2019-11-05 Sold (Public Records) $163,250 Public Records
- 2019-10-25 Sold (MLS) — MARIS as Distributed by MLS Grid
- 2019-09-18 Contingent — MARIS as Distributed by MLS Grid
- 2019-09-12 Listed $165,000 MARIS as Distributed by MLS Grid
- 2009-09-23 Sold (Public Records) $127,200 Public Records
- 2007-08-01 Sold (Public Records) $132,500 Public Records
- 2004-08-30 Sold (Public Records) $121,000 Public Records
- 2002-01-22 Sold (Public Records) $94,900 Public Records
- 1990-07-01 Sold (Public Records) $53,000 Public Records
- 1990-07-01 Sold (Public Records) — Public Records
- 1982-11-01 Sold (Public Records) $48,500 Public Records
Property tax history
+4.1%/yrLatest (2025): $2,250 · +1.3% YoY. Source: county tax records.
Cash-flow waterfall
monthlySold comps — $/sqft
last 12 mo · ≤1 miLoading sold comps…