 Duplex
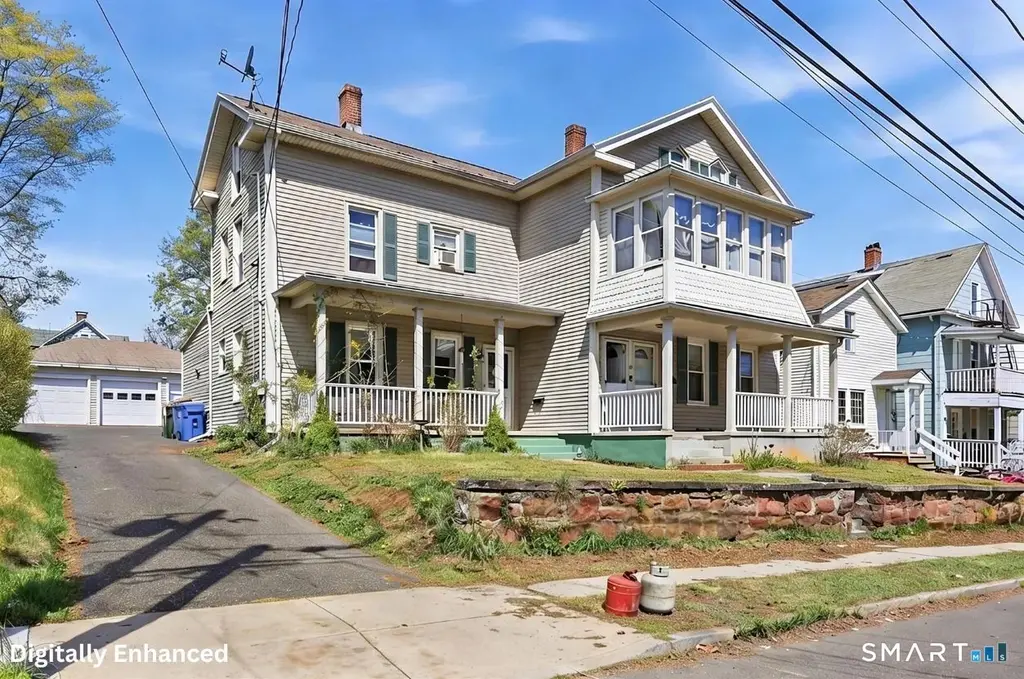
23 N 3rd St · Meriden, CT
Flood risk 1/10 · Minimal
- FEMA flood zone
- X (unshaded)
- Chance of flooding over 30 yrs
- 0.0%
- Est. flood insurance / yr
- $473 – $860
Fire risk 1/10 · Minimal
- Est. fire insurance / yr
- $829 – $1,539
Heat risk 6/10 · Moderate
- Hot days now (above 99°F)
- 7 days/yr
- Hot days in 30 yrs
- 17 days/yr
Wind risk 6/10 · Moderate
- Chance of severe wind over 30 yrs
- 27.0%
Air-quality risk 4/10 · Minor
- Unhealthy air days now
- 3 days/yr
- Unhealthy air days in 30 yrs
- 5 days/yr
Risk factors via First Street. Map © Google.
Why this score? — see what drove the C+ grade
The composite is a weighted blend of 9 inputs, each scored 0–100. Each bar is that input's sub-score; the figure is the points it added to the 100-point composite (weight × sub-score).
- Cash flow +22.4/30.0
- ARV discount +12.1/15.0
- DSCR +7.2/10.0
- 1% rule +5.9/10.0
- Livability +4.2/5.0
- Condition / age +3.8/5.0
- Schools +3.0/10.0
- Rent growth +2.5/5.0
- Appreciation +0.0/10.0
$349,900
🖨 Deal sheet 📄 Offer letter ✓ Due diligence
Multi-family units
County records classify this as Multi-Family (2-4 Unit). Listing-text estimate: 2 units. confirmed
Listing remarks
HIGHEST & BEST BY MONDAY AT 12:00 PM. A fantastic opportunity for both owner-occupants and investors in Meriden. This two-family home features two separate units, each occupying its own floor, with generously sized rooms throughout. The property also includes a detached three-car garage, offering ample parking and storage. With flexible potential, this home may be suitable for conversion into a three- or even four-unit property (buyer to perform due diligence), making it an attractive option for those looking to maximize value. Ideally located, the property provides easy access to some of Meriden's most popular destinations, including Hubbard Park, as well as convenient connections to
Key facts
- 8,712 sq ft lot
- 2 garage spots
- Built 1900
Property features AI
Exterior
- Parking: Detached garage; 2-car garage; Paved driveway; Total 3 parking spaces
- Utilities: Public water connected; Public sewer connected; Natural gas hot water
- Home design: Multi-family 2-family property
- Construction: Frame construction; Vinyl siding; Asphalt shingle roof; Concrete and stone foundation
- Exterior features: Porch; Gutters; Sloping lot; Paved driveway
Interior
- Bedrooms: 6 total bedrooms (across units)
- Bathrooms: 2 full bathrooms; 1 half bathroom
- Heating & cooling: Baseboard, hot water, and radiator heating; Natural gas heating fuel
- Interior features: Ceiling fans; Window unit cooling; Full, unfinished shared basement with interior access, dirt and concrete floors; Walk-up attic
- Laundry & utility: Laundry in each unit; Natural gas hot water
Neighborhood map
What this means for you Summary
Snapshot
- This is a 2 × 3-bed/1.2-bath units multifamily listed at $350k. Condition is rated good.
Deal economics
- At list price, monthly cash flow is $585 ($7k/yr) — positive. Per door: $293/mo.
- The deal already cash-flows at list — no discount required.
- Meets the 1% rule at list price ($4k rent vs $350k).
- Cap rate 8.3% vs local median 4.2% in Meriden — top-decile yield for the area; either an underpriced asset or a hidden risk that comps aren't pricing in. Stress-test before assuming the spread holds.
Location & tenants
- Location reads 85/100 on livability (#4 in CT, #505 nationally) — a professional / high-income tenant draw. Strengths: amenities A+, housing A+, health & safety A+.
- Meriden School District (suburban): math 27% / reading 41% proficiency, ranked #116 of 153 in CT (top 76%) — families likely to look elsewhere, expect single-tenant / working-renter base with shorter leases; 61% free/reduced lunch — lower-income household profile, screen leases tightly.
- Market conditions: 70 active listings in the ZIP; 1 comparable units currently listed for rent nearby; 1,059 units permitted in South Central Connecticut Planning Region in 2024 (779 in 5+ unit buildings).
- At $3,802/mo this rent would consume 64% of the median local household income ($71k/yr) (locally 973% of renters already pay >50% of income on rent) — very limited rent-growth headroom before tenants either downsize or default.
Forward outlook
- Local home prices are declining (-3.0%/yr); year-one equity from $2k of loan paydown is wiped out by about $10k of value loss. Plan a longer hold.
Negotiation context
- Only 5 days on market — expect competitive offers; lowballing is unlikely to land.
Risks & watch-outs
- Watch-outs: built in 1900 — expect roof / HVAC / electrical / plumbing capex.
- Climate carrying-cost: major wind risk, 27% chance of damaging wind over 30y; extreme-heat days projected 7→17/yr by 2055 (HVAC capex compounding) — expect insurance premiums to compound above CPI over the hold.
Questions for the listing agent
- Can we see the unit-by-unit rent roll, current vacancy, and any below-market leases? What's the average tenancy length?
- What capital expenditures (roof, boiler, parking lot, exteriors) have been made in the last 5 years, and what's planned in the next 2?
- Built in 1900 — when were the roof, HVAC, electrical panel, plumbing, and water heater last replaced?
- Is there a deadline driving the sale (1031 exchange, divorce, estate, relocation)? That informs how much negotiation room exists.
- What's the average days-on-market for RENTAL listings here right now (not sales)? A rising rental-DOM trend means longer vacancies and softer asking-rent achievability than the comps imply.
- What's the recent tenant-quality profile in this submarket — average credit score on applications, eviction rate, late-payment / NSF rate, and stable-employment percentage? A property-management company in the area should have these aggregated.
- How much new apartment / multifamily construction is in the pipeline within 1–3 miles? Heavy new supply (>2% of stock underway) typically softens rents 12–24 months out; light construction supports rent growth.
Investment metrics
- 1% rule
- 1.09% ✓
- Cap rate
- 8.30%
- Cash-on-cash
- 7.17%
- DSCR
- 1.32
- GRM
- 7.7
CMA / ARV
- ARV (median comp)
- $389,850
- List price
- $349,900
- Delta
- -10.25%
- Verdict
- UNDERPRICED
- Comps
- 20 within 1.0 mi
Show comp detail 12 sales within ~0.75 mi
| Address | Dist | Beds/Ba | Sqft | Sold | Price | $/sf | Match |
|---|---|---|---|---|---|---|---|
| 27 Windsor Ave | 0.11mi | 6/2.0 | 2,578 (-1%) | 2mo | $385,000 | $149 | 89 |
| 85 Goodwill Ave | 0.34mi | 6/3.0 | 2,705 (+3%) | 6mo | $500,000 | $185 | 71 |
| 45 4th St | 0.08mi | 6/2.0 | 2,329 (-11%) | 11mo | $425,000 | $182 | 68 |
| 24 North St | 0.31mi | 6/3.0 | 2,478 (-5%) | 9mo | $430,000 | $174 | 66 |
| 2 Springdale Ave | 0.49mi | 6/4.0 | 2,604 (-0%) | 6mo | $295,000 | $113 | 65 |
| 22 Lewis Ave | 0.22mi | 5/2.0 (-1) | 2,414 (-8%) | 14mo | $280,000 | $116 | 59 |
| 66 Vine St | 0.29mi | 5/2.0 (-1) | 2,254 (-14%) | 1mo | $375,000 | $166 | 56 |
| 31 Winthrop St | 0.65mi | 5/3.0 (-1) | 2,738 (+5%) | 1mo | $430,000 | $157 | 53 |
| 52 Cherry St | 0.54mi | 6/4.0 | 2,728 (+4%) | 10mo | $420,000 | $154 | 53 |
| 126 Willow St | 0.73mi | 7/3.0 (+1) | 2,436 (-7%) | 0mo | $400,000 | $164 | 47 |
| 221 Grove St | 0.58mi | 7/3.0 (+1) | 2,898 (+11%) | 4mo | $375,000 | $129 | 45 |
| 49 Foster St | 0.61mi | 7/2.5 (+1) | 2,990 (+14%) | 16mo | $278,000 | $93 | 29 |
Match score weights: distance 35% · size 25% · config 20% · recency 20%. Top-matched comps best support the ARV.
Projected returns pro-forma
-3.0% appreciation · 3.0% rent growth · sell at horizon
- IRR
- -5.3%
- Equity multiple
- 0.80×
- Total profit
- $-19,351
- Equity at exit
- $52,171
- IRR
- 4.4%
- Equity multiple
- 1.32×
- Total profit
- $31,401
- Equity at exit
- $30,253
Cash invested: $97,972 (down + closing). Projections, not guarantees.
Landlord ↔ Tenant lean methodology
- Overall (STATE)
- 27 Tenant-Leaning
- State Connecticut
- 27 Tenant-Leaning · D+7
- County
- — inherits STATE
- City
- — inherits STATE
ZIP-level market 06451
- Home prices YoY
- -14.2%
- Active inventory
- 70
- Price-to-rent
- 15.3×
Monthly cashflow live
- Estimated rent
- $3,802 high interval (Pro) →
- Mortgage (P&I)
- −$1,835
- Tax est. 1.5%
- −$437 /mo · $5,248/yr
- Insurance
- −$146
- HOA
- −$0
- Vacancy / Maint / Mgmt
- −$798
- Net cashflow
- $585
Break-even live
2-unit breakdown (identical units grouped — click to expand)
| Units | Beds | Baths | Est. rent |
|---|---|---|---|
| 2× units | 3 | 1.2 | $3,802 |
| #1 | 3 | 1.2 | $1,901 |
| #2 | 3 | 1.2 | $1,901 |
| Total (2 units) | $3,802 | ||
UW: 25.0% down · 7.5% · 30yr · 1.5% tax · 5.0% vac · 8.0% maint · 8.0% mgmt
Financing live
Cash to close
- Down payment
- $87,475
- Closing costs
- $10,497
- Reserves months
- —
- Total cash needed
- —
Loan-product check · same deal, 3 products live
Conventional
25% down · 7.5% · 30yr
- Down + closing
- —
- Monthly P&I
- —
- Monthly cashflow
- —
- DSCR
- —
- Eligible?
- —
Personal DTI + credit; lowest rate.
DSCR
20% down · 8.5% · 30yr
- Down + closing
- —
- Monthly P&I
- —
- Monthly cashflow
- —
- DSCR
- —
- Eligible?
- —
No personal income docs; deal must DSCR.
Hard money
10% down · 12.0% · 12mo
- Down + closing
- —
- Monthly P&I
- —
- Monthly cashflow
- —
- DSCR
- —
- Eligible?
- —
Short-term bridge; refi at stabilization.
Rent comps 1 comps
| Address | Beds | Baths | Sqft | Rent | $/sqft | DOM | Units | Dist |
|---|---|---|---|---|---|---|---|---|
| 55 Liberty St Meriden, CT | 5.0 | 3.0 | 2215 | $2,900 | $1.31 | 3d | 1 | 0.90mi |
Listing history 3 events
-
2026-05-05status Under Contract 734-char remark
-
2026-04-30$349,900 Active 734-char remark
-
2026-04-27historical $349,900 734-char remark
ⓘ Source: listings_history table (triggers on properties + properties_extension) + one-shot
backfill from property_details.listing_events for pre-trigger history.
Climate risk First Street
- Flood 1/10 Low FEMA zone X (unshaded) · 0% chance over 30 yrs
- Wildfire 1/10 Low
- Heat 6/10 Major 7 d/yr ≥99°F today · 17 d/yr by 30 yrs out
- Wind 6/10 Major 27% chance of damaging wind over 30 yrs
- Air quality 4/10 Moderate 3 unhealthy d/yr today · 5 by 30 yrs out
Nearby sold comps map
Loading sold comps map…
Walkable amenities ~0.75 mi
Loading nearby amenities…
Taxation est. · year 1
- Rental income
- $45,624
- − Mortgage interest
- −$19,600
- − Property taxes
- −$5,248
- − Insurance
- −$1,750
- − Repairs & maintenance
- −$3,650
- − Management
- −$3,650
- − Depreciation
- −$10,179
- Taxable income
- $1,547
- Est. tax owed @ 24.0%
- −$371
- After-tax cash flow
- $6,655/yr
For passive investors: Depreciation is non-cash, so a rental often shows a tax loss while cash-flowing — sheltering income. Rental losses are passive: they offset passive income freely, and up to $25,000/yr can offset ordinary (W-2) income if you actively participate and your MAGI is under $100k (phasing out to $0 by $150k); unused losses carry forward. On sale, claimed depreciation is recaptured at up to 25%, and gains may owe capital-gains tax (a 1031 exchange can defer both). Figures are a year-1 estimate at your 24.0% rate — not tax advice; consult a CPA.
Condition & rehab AI · 12 photos
This two-family home in Meriden is in good condition with cosmetic updates needed. It offers ample space and potential for further value through exterior painting and HVAC upgrades.
Value-add opportunities
- Both Paint exterior — Enhances curb appeal and value
- Both Replace ceiling fan with modern model — Improves aesthetics and energy efficiency
- Both Upgrade HVAC system — Enhances comfort and energy efficiency
Renovation cost estimate screening
Value-add ROI direction
- Both Paint exterior — Enhances curb appeal and value ↑
- Both Replace ceiling fan with modern model — Improves aesthetics and energy efficiency ↑
- Both Upgrade HVAC system — Enhances comfort and energy efficiency ↑
ⓘ Cost ranges are severity-bucket heuristics (US national rule-of-thumb). Get contractor quotes + a written scope before underwriting a rehab budget.
Schools (NCES district)
- District
- Meriden School District
- NCES district ID
- 0902400
- Math proficiency
- 27% ▼ -8.00%
- Reading proficiency
- 41% ▼ -6.00%
- Median HH income
- $53,883
- Composite
- 29.84/100
- National rank
- #6413
- State rank
- #116 of 153 in CT
Livability — Meriden
- Score
- 85/100
- State rank
- #4
- US rank
- #505
Category grades
Schools grade is shown separately in the Schools card above.
Census & demographics
- Census place
- Meriden, CT
- County
- New Haven County · 688,236 people
- City population
- 60,545
- Metro
- New Haven-Milford, CT
- Population (ZIP)
- 24,851
- Household income
- $71,255
- Rent vs Own
- Severe rent burden
- 973.0
Population outlook (South Central Connecticut County) Hauer SSP2
- By 2040
- 608,362
Race, ethnicity, and origin ACS 2023
- Neighborhood character
- Diverse neighborhood (Simpson 0.62)
- Race & ethnicity
- White 46% Hispanic / Latino 40% Two or more races 26% Black 8% Asian 2%
- Hispanic origin (detail)
- Mexican 4% Puerto Rican 24% Cuban 2% Dominican 2%
- Common ancestry
- Romanian 5% Lithuanian 4% Subsaharan African 1%
- Foreign-born
- 11% · Canada, Jamaica, China
- Languages at home
- 65% English-only · Spanish 31% Chinese 1% French/Haitian/Cajun 1%
Political lean MEDSL · South Central Connecticut
- 2024 margin
- Strong D (+20.1) · D 59.0% · R 38.9% · Other 2.1%
- All cycles
- 2024: D+20.1
Not yet ingested
- Civics
- —
Market trends
- HPI YoY
- ▼ -45.38%
- Current HPI
- 274.0567
- Rent YoY
- —
- Metro
- New Haven-Milford, CT
- State GDP YoY
- ▲ 1.06%
- F500 in state
- 38
Industry mix (Fortune 500 HQ in CT)
| Industry | F500 HQs | Revenue |
|---|---|---|
| Industrial Machinery | 4 | $38B |
|
||
| Insurance | 3 | $71B |
|
||
| Financial Services | 2 | $25B |
|
||
| Transportation / Logistics | 2 | $18B |
|
||
| Healthcare | 1 | $247B |
|
||
| Telecommunications | 1 | $55B |
|
||
Price history
+0.0% since first listed3 events — show timeline
- 2026-05-05 Pending — Smart MLS
- 2026-04-30 Listed $349,900 Smart MLS
- 2026-04-27 Coming Soon $349,900 Smart MLS
Cash-flow waterfall
monthlySold comps — $/sqft
last 12 mo · ≤1 miLoading sold comps…