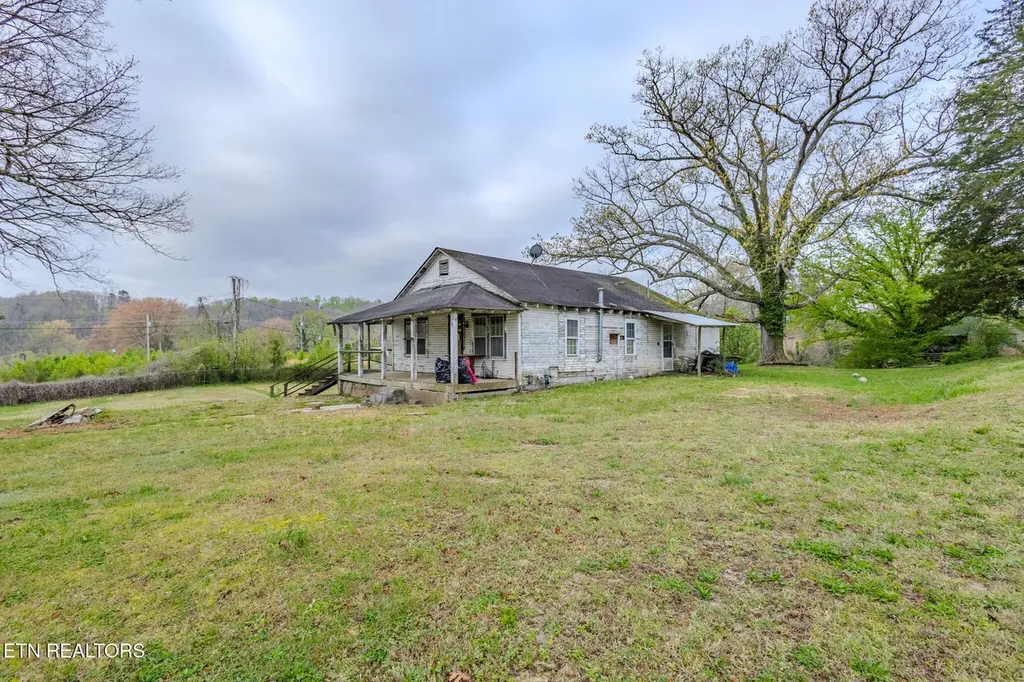
248 Woody Ave · Harriman, TN
Flood risk 1/10 · Minimal
- FEMA flood zone
- X (unshaded)
- Chance of flooding over 30 yrs
- 0.0%
- Est. flood insurance / yr
- $507 – $1,088
Fire risk 4/10 · Minor
- Est. fire insurance / yr
- $949 – $1,763
Heat risk 5/10 · Moderate
- Hot days now (above 103°F)
- 7 days/yr
- Hot days in 30 yrs
- 22 days/yr
Wind risk 2/10 · Minimal
- Chance of severe wind over 30 yrs
- 3.0%
Air-quality risk 3/10 · Minor
- Unhealthy air days now
- 2 days/yr
- Unhealthy air days in 30 yrs
- 2 days/yr
Risk factors via First Street. Map © Google.
Why this score? — see what drove the B- grade
The composite is a weighted blend of 9 inputs, each scored 0–100. Each bar is that input's sub-score; the figure is the points it added to the 100-point composite (weight × sub-score).
- Cash flow +30.0/30.0
- 1% rule +10.0/10.0
- DSCR +10.0/10.0
- ARV discount +7.5/15.0
- Livability +2.9/5.0
- Rent growth +2.5/5.0
- Schools +2.5/10.0
- Condition / age +2.5/5.0
- Appreciation +0.0/10.0
$69,900
🖨 Deal sheet 📄 Offer letter ✓ Due diligence
Listing remarks
Investor Special - Fixer Upper on Level Lot! Great opportunity to bring this 3-bedroom, 2-bath home back to life! Situated on a generous 0.65-acre level lot, this property offers plenty of usable space and endless potential for renovation or investment. Bring your contractor and your imagination--this home features a blank slate layout, ready for your vision and customization. Ideal for investors, flippers, or buyers looking to build equity, this property provides the perfect foundation to create something special. Conveniently located near local amenities, this home combines space, location, and opportunity.
Key facts
- Blank slate layout
- Endless potential
- 0.65-acre lot
Tags
Neighborhood map
What this means for you Summary
Snapshot
- This is a 3-bed/1.0-bath single-family listed at $70k.
Deal economics
- At list price, monthly cash flow is $540 ($6k/yr) — positive.
- The deal already cash-flows at list — no discount required.
- Meets the 1% rule at list price ($1k rent vs $70k).
- Cap rate 15.6% vs local median 3.1% in Harriman — top-decile yield for the area; either an underpriced asset or a hidden risk that comps aren't pricing in. Stress-test before assuming the spread holds.
Location & tenants
- Location reads 57/100 on livability (#330 in TN) — a working-class tenant base; expect higher turnover. Strengths: cost of living A+, housing A+; Watch: schools F, crime F, amenities F.
- Roane County (town): math 30% / reading 29% proficiency, ranked #64 of 139 in TN (top 46%) — low school quality limits family demand, transient renter base, plan for 1-2y turnover.
- Market conditions: 211 active listings in the ZIP; 5 comparable units currently listed for rent nearby; rentals lingering (median 44d on market — plan ~5-8 weeks vacancy on turnover, expect pricing pressure); 60% of comp listings sitting > 30 days — soft ceiling on asking rent; 229 units permitted in Roane County in 2024 (0 in 5+ unit buildings).
Forward outlook
- Local home prices are declining (-3.0%/yr); year-one equity from $483 of loan paydown is wiped out by about $2k of value loss. Plan a longer hold.
- Roane County population projected at -21% by 2050 — secular population decline; favor cash flow + early exit over multi-decade hold.
- At projected returns (-3.0% appreciation + 3.0% rent growth), your $20k cash investment doubles in ~4 years — after that, you're playing with house money.
Negotiation context
- Only 5 days on market — expect competitive offers; lowballing is unlikely to land.
Risks & watch-outs
- Watch-outs: built in 1942 — expect roof / HVAC / electrical / plumbing capex.
- Climate carrying-cost: extreme-heat days projected 7→22/yr by 2055 (HVAC capex compounding) — expect insurance premiums to compound above CPI over the hold.
Questions for the listing agent
- Built in 1942 — when were the roof, HVAC, electrical panel, plumbing, and water heater last replaced?
- Is there a deadline driving the sale (1031 exchange, divorce, estate, relocation)? That informs how much negotiation room exists.
- Schools are F-rated, which usually means shorter tenancies and higher turnover. Who's the typical renter profile here, and what's been the actual vacancy rate?
- Crime grade is F in this area — have there been break-ins, vandalism, or insurance claims at this property in the last 3 years? What carrier currently insures it and at what premium?
- What's the average days-on-market for RENTAL listings here right now (not sales)? A rising rental-DOM trend means longer vacancies and softer asking-rent achievability than the comps imply.
- What's the recent tenant-quality profile in this submarket — average credit score on applications, eviction rate, late-payment / NSF rate, and stable-employment percentage? A property-management company in the area should have these aggregated.
- How much new for-sale + rental construction is in the pipeline within 1–3 miles? Heavy new supply typically softens prices + rents 12–24 months out; constrained supply supports both.
Investment metrics
- 1% rule
- 1.75% ✓
- Cap rate
- 15.56%
- Cash-on-cash
- 33.10%
- DSCR
- 2.47
- GRM
- 4.8
CMA / ARV
- ARV (on-the-fly)
- $232,656
- Comps found
- 12
Show comp detail 12 sales within ~0.75 mi
| Address | Dist | Beds/Ba | Sqft | Sold | Price | $/sf | Match |
|---|---|---|---|---|---|---|---|
| 133 Briggs Dr | 0.63mi | 3/1.0 | 1,056 (+1%) | 1mo | $223,000 | $211 | 68 |
| 205 Carr Ave | 0.16mi | 3/2.0 | 1,147 (+9%) | 8mo | $184,500 | $161 | 66 |
| 401 Woody Ave | 0.16mi | 3/2.0 | 1,200 (+14%) | 1mo | $245,000 | $204 | 64 |
| 230 Leslie St | 0.30mi | 3/1.0 | 1,171 (+12%) | 4mo | $90,000 | $77 | 63 |
| 117 Love Dr | 0.26mi | 2/1.0 (-1) | 925 (-12%) | 1mo | $205,000 | $222 | 63 |
| 125 Love Dr | 0.22mi | 3/2.0 | 1,128 (+8%) | 14mo | $265,000 | $235 | 61 |
| 539 Baumgartner Rd | 0.51mi | 3/1.0 | 960 (-8%) | 9mo | $199,900 | $208 | 55 |
| 108 Bradys Way | 0.66mi | 2/2.0 (-1) | 1,053 (+0%) | 10mo | $249,000 | $236 | 52 |
| 116 Davis Cir | 0.34mi | 2/1.5 (-1) | 900 (-14%) | 9mo | $213,000 | $237 | 46 |
| 211 Morris St | 0.64mi | 3/2.0 | 1,200 (+14%) | 2mo | $286,000 | $238 | 40 |
| 106 White Rd | 0.66mi | 3/2.0 | 1,200 (+14%) | 2mo | $280,000 | $233 | 39 |
| 914 Renfro Rd | 0.71mi | 4/1.5 (+1) | 1,200 (+14%) | 7mo | $235,000 | $196 | 30 |
Match score weights: distance 35% · size 25% · config 20% · recency 20%. Top-matched comps best support the ARV.
Projected returns pro-forma
-3.0% appreciation · 3.0% rent growth · sell at horizon
- IRR
- 28.3%
- Equity multiple
- 2.18×
- Total profit
- $23,045
- Equity at exit
- $10,422
- IRR
- 35.7%
- Equity multiple
- 4.28×
- Total profit
- $64,285
- Equity at exit
- $6,044
Cash invested: $19,572 (down + closing). Projections, not guarantees.
Landlord ↔ Tenant lean methodology
- Overall (STATE)
- 87 Strongly Landlord-Friendly
- State Tennessee
- 87 Strongly Landlord-Friendly · R+13
- County
- — inherits STATE
- City
- — inherits STATE
ZIP-level market 37748
- Home prices YoY
- -11.5%
- Active inventory
- 211
- Price-to-rent
- 4.8×
Monthly cashflow live
- Estimated rent
- $1,226 high interval (Pro) →
- Mortgage (P&I)
- −$367
- Tax from tax record
- −$33 /mo · $392/yr
- Insurance
- −$29
- HOA
- −$0
- Vacancy / Maint / Mgmt
- −$257
- Net cashflow
- $540
Break-even live
UW: 25.0% down · 7.5% · 30yr · 1.5% tax · 5.0% vac · 8.0% maint · 8.0% mgmt
Financing live
Cash to close
- Down payment
- $17,475
- Closing costs
- $2,097
- Reserves months
- —
- Total cash needed
- —
Loan-product check · same deal, 3 products live
Conventional
25% down · 7.5% · 30yr
- Down + closing
- —
- Monthly P&I
- —
- Monthly cashflow
- —
- DSCR
- —
- Eligible?
- —
Personal DTI + credit; lowest rate.
DSCR
20% down · 8.5% · 30yr
- Down + closing
- —
- Monthly P&I
- —
- Monthly cashflow
- —
- DSCR
- —
- Eligible?
- —
No personal income docs; deal must DSCR.
Hard money
10% down · 12.0% · 12mo
- Down + closing
- —
- Monthly P&I
- —
- Monthly cashflow
- —
- DSCR
- —
- Eligible?
- —
Short-term bridge; refi at stabilization.
Rent comps 5 comps
| Address | Beds | Baths | Sqft | Rent | $/sqft | DOM | Units | Dist |
|---|---|---|---|---|---|---|---|---|
| 415 Woody Ave Unit 415 Harriman, TN | 2.0 | 2.0 | 1200 | $1,200 | $1.00 | 44d | 1 | 0.17mi |
| 633 Russell Ave Harriman, TN | 2.0 | 1.0 | 1188 | $1,400 | $1.18 | 44d | 1 | 0.48mi |
| 408 Hassler Mill Rd Harriman, TN | 2.0 | 1.0 | 748 | $1,195 | $1.60 | 23d | 1 | 0.55mi |
| 1310 S Roane St Harriman, TN | 2.0 | 1.0 | 1404 | $950 | $0.68 | 23d | 1 | 0.59mi |
| 105 Highland Dr Unit A Harriman, TN | 2.0 | 1.0 | 950 | $1,425 | $1.50 | 44d | 1 | 0.89mi |
Listing history 2 events
-
2026-04-10status Pending
-
2026-04-04$69,900 Active
ⓘ Source: listings_history table (triggers on properties + properties_extension) + one-shot
backfill from property_details.listing_events for pre-trigger history.
Tax reassessment forecast TN · Resets to sale price
- Current annual tax
- $392 · $33/mo
- Projected year-2 tax
- $496 · $41/mo
- Expected delta
- +$104/yr (+$9/mo · 26.6%)
ⓘ Screening estimate from a state-policy table — verify with the county assessor before closing.
Climate risk First Street
- Flood 1/10 Low FEMA zone X (unshaded) · 0% chance over 30 yrs
- Wildfire 4/10 Moderate
- Heat 5/10 Major 7 d/yr ≥103°F today · 22 d/yr by 30 yrs out
- Wind 2/10 Low 3% chance of damaging wind over 30 yrs
- Air quality 3/10 Moderate 2 unhealthy d/yr today · 2 by 30 yrs out
Nearby sold comps map
Loading sold comps map…
Walkable amenities ~0.75 mi
Loading nearby amenities…
Taxation est. · year 1
- Rental income
- $14,708
- − Mortgage interest
- −$3,915
- − Property taxes
- −$392
- − Insurance
- −$350
- − Repairs & maintenance
- −$1,177
- − Management
- −$1,177
- − Depreciation
- −$2,033
- Taxable income
- $5,664
- Est. tax owed @ 24.0%
- −$1,359
- After-tax cash flow
- $5,120/yr
For passive investors: Depreciation is non-cash, so a rental often shows a tax loss while cash-flowing — sheltering income. Rental losses are passive: they offset passive income freely, and up to $25,000/yr can offset ordinary (W-2) income if you actively participate and your MAGI is under $100k (phasing out to $0 by $150k); unused losses carry forward. On sale, claimed depreciation is recaptured at up to 25%, and gains may owe capital-gains tax (a 1031 exchange can defer both). Figures are a year-1 estimate at your 24.0% rate — not tax advice; consult a CPA.
Schools (NCES district)
- District
- Roane County
- NCES district ID
- 4703590
- Math proficiency
- 30% ▼ -10.00%
- Reading proficiency
- 29% ▼ -7.00%
- Median HH income
- $41,611
- Composite
- 25.0/100
- National rank
- #7557
- State rank
- #64 of 139 in TN
Livability — Harriman
- Score
- 57/100
- State rank
- #330
- US rank
- #21927
Category grades
Schools grade is shown separately in the Schools card above.
Census & demographics
- Census place
- Harriman, TN
- City population
- 17,021
- Population (ZIP)
- 17,021
Population outlook (Roane County) Hauer SSP2
- Today (2025)
- 49,652 people
- By 2030
- 47,648 · -4.0%
- By 2040
- 43,306 · -12.8%
- By 2050
- 39,294 · -20.9%
- By 2075
- 32,318 · -34.9%
- By 2100
- 27,137 · -45.3%
Race, ethnicity, and origin ACS 2023
- Neighborhood character
- Predominantly White (90%)
- Race & ethnicity
- White 90% Two or more races 5% Black 4% Hispanic / Latino 2%
- Common ancestry
- Serbian 3% Slovak 2% Lithuanian 1%
- Foreign-born
- 1%
- Languages at home
- 99% English-only · Spanish 1%
Political lean MEDSL · Roane
- 2024 margin
- Solid R (+54.5) · D 22.1% · R 76.7% · Other 1.2%
- 2008→2024 swing
- -18.3pp toward R · 2008: -36.2pp · 2024: -54.5pp
- All cycles
- 2024: R+54.5 2020: R+50.9 2016: R+51.1 2012: R+41.3 2008: R+36.2
Not yet ingested
- Civics
- —
Market trends
- HPI YoY
- ▼ -39.78%
- Current HPI
- 305.724
- Rent YoY
- —
- Metro
- —
- State GDP YoY
- ▲ 2.78%
- F500 in state
- 22
Industry mix (Fortune 500 HQ in TN)
| Industry | F500 HQs | Revenue |
|---|---|---|
| Healthcare | 3 | $91B |
|
||
| Retail | 3 | $72B |
|
||
| Transportation / Logistics | 1 | $88B |
|
||
| Paper / Packaging | 1 | $19B |
|
||
| Insurance | 1 | $13B |
|
||
| Energy | 1 | $12B |
|
||
Price history
2 events — show timeline
- 2026-04-10 Pending — Knoxville MLS
- 2026-04-04 Listed $69,900 Knoxville MLS
Property tax history
+1.8%/yrLatest (2025): $392 · -11.7% YoY. Source: county tax records.
Cash-flow waterfall
monthlySold comps — $/sqft
last 12 mo · ≤1 miLoading sold comps…