1259 Wilcox Ave · Gaffney, SC
Flood risk 1/10 · Minimal
- FEMA flood zone
- X (unshaded)
- Chance of flooding over 30 yrs
- 0.0%
- Est. flood insurance / yr
- $507 – $1,088
Fire risk 3/10 · Minor
- Est. fire insurance / yr
- $783 – $1,453
Heat risk 6/10 · Moderate
- Hot days now (above 103°F)
- 7 days/yr
- Hot days in 30 yrs
- 17 days/yr
Wind risk 3/10 · Minor
- Chance of severe wind over 30 yrs
- 4.0%
Air-quality risk 3/10 · Minor
- Unhealthy air days now
- 3 days/yr
- Unhealthy air days in 30 yrs
- 4 days/yr
Risk factors via First Street. Map © Google.
Why this score? — see what drove the C+ grade
The composite is a weighted blend of 9 inputs, each scored 0–100. Each bar is that input's sub-score; the figure is the points it added to the 100-point composite (weight × sub-score).
- Cash flow +26.9/30.0
- DSCR +9.3/10.0
- ARV discount +7.5/15.0
- 1% rule +7.2/10.0
- Livability +3.3/5.0
- Schools +2.8/10.0
- Rent growth +2.5/5.0
- Condition / age +2.5/5.0
- Appreciation +0.0/10.0
$85,000
🖨 Deal sheet 📄 Offer letter ✓ Due diligence
Listing remarks
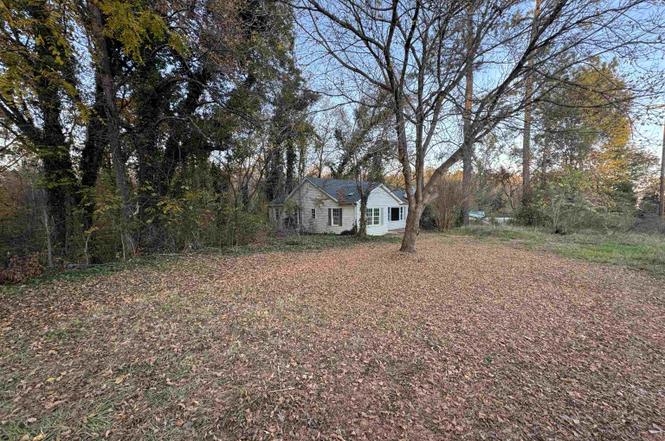
Excellent investment opportunity on over an acre in Gaffney! This 2-bedroom, 1-bath, 1,186 sq ft home has been gutted with new subflooring installed—ready for renovation and customization. Built in 1950 with vinyl siding, shingle roof in good condition, and central heat/air. Located on a private 1.03-acre lot in the county, close to I-85, offering strong resale or rental potential once completed. Ideal for investors, flippers, or anyone looking to create value in a growing area.
Key facts
- Rental potential
- Private lot
- New subflooring
Tags
Property features AI
Finance
- Financial info: Annual tax: $1,211
Exterior
- Home design: Single-family residence; Residential property; One story
- Construction: Above-grade finished area approximately 1,186
- Exterior features: Approximately 1.03-acre lot; Subdivision: Other; Property located on Wilcox Ave; sign in front
Interior
- Bathrooms: 1 full bathroom
- Interior features: One-level layout
Neighborhood map
What this means for you Summary
Snapshot
- This is a 2-bed/1.0-bath single-family listed at $85k.
Deal economics
- At list price, monthly cash flow is $236 ($3k/yr) — positive.
- The deal already cash-flows at list — no discount required.
- Meets the 1% rule at list price ($1k rent vs $85k).
- Recommended offer: $75k (12.0% below list) — sets the bar for market timing.
- Cap rate 9.6% vs local median 2.6% in Gaffney — top-decile yield for the area; either an underpriced asset or a hidden risk that comps aren't pricing in. Stress-test before assuming the spread holds.
Location & tenants
- Location reads 66/100 on livability (#112 in SC) — a middle-class / working-renter tenant base. Strengths: cost of living A+, health & safety A+, housing A-; Watch: amenities D+, crime D, commute F.
- Cherokee 01 (rural): math 29% / reading 40% proficiency, ranked #47 of 80 in SC (top 59%) — families likely to look elsewhere, expect single-tenant / working-renter base with shorter leases; 64% free/reduced lunch — lower-income household profile, screen leases tightly.
- Zoned schools: Gaffney Middle (math 25% / reading 37%, grade F, #128 of 229 statewide, top 58%, 921 students, 100% FRL); Gaffney High (math 40% / reading 75%, grade C, #116 of 196 statewide, top 59%, 1,838 students, 84% FRL) — zoned schools average 92% FRL vs 64% district-wide (28 pts higher); higher-poverty schools than district average — tighter screening recommended.
- Market conditions: 196 active listings in the ZIP; 1 comparable units currently listed for rent nearby; 200 units permitted in Cherokee County in 2024 (0 in 5+ unit buildings).
Forward outlook
- Local home prices are declining (-3.0%/yr); year-one equity from $588 of loan paydown is wiped out by about $3k of value loss. Plan a longer hold.
- At projected returns (-3.0% appreciation + 3.0% rent growth), your $24k cash investment doubles in ~10 years — after that, you're playing with house money.
Negotiation context
- It's been on market 199 days — a 12% lower offer ($75k) is reasonable based on typical stale-listing flexibility.
Risks & watch-outs
- Watch-outs: built in 1950 — expect roof / HVAC / electrical / plumbing capex.
- Climate carrying-cost: extreme-heat days projected 7→17/yr by 2055 (HVAC capex compounding) — expect insurance premiums to compound above CPI over the hold.
Questions for the listing agent
- It's been on market 199 days. Have you received any prior offers? Is the seller open to a 12% concession, seller financing, or rate buy-down credit?
- Built in 1950 — when were the roof, HVAC, electrical panel, plumbing, and water heater last replaced?
- Why hasn't it sold? Are there any deal-killer items the seller is aware of (foundation, flood, title, zoning, code violations)?
- Is there a deadline driving the sale (1031 exchange, divorce, estate, relocation)? That informs how much negotiation room exists.
- Schools are D-rated, which usually means shorter tenancies and higher turnover. Who's the typical renter profile here, and what's been the actual vacancy rate?
- Crime grade is D in this area — have there been break-ins, vandalism, or insurance claims at this property in the last 3 years? What carrier currently insures it and at what premium?
- What's the average days-on-market for RENTAL listings here right now (not sales)? A rising rental-DOM trend means longer vacancies and softer asking-rent achievability than the comps imply.
- What's the recent tenant-quality profile in this submarket — average credit score on applications, eviction rate, late-payment / NSF rate, and stable-employment percentage? A property-management company in the area should have these aggregated.
- How much new for-sale + rental construction is in the pipeline within 1–3 miles? Heavy new supply typically softens prices + rents 12–24 months out; constrained supply supports both.
Investment metrics
- 1% rule
- 1.22% ✓
- Cap rate
- 9.62%
- Cash-on-cash
- 11.88%
- DSCR
- 1.53
- GRM
- 6.8
CMA / ARV
- ARV (on-the-fly)
- $215,852
- Comps found
- 1
Show comp detail 1 sale within ~0.75 mi
| Address | Dist | Beds/Ba | Sqft | Sold | Price | $/sf | Match |
|---|---|---|---|---|---|---|---|
| 145 Maplewood Drive Dr | 0.73mi | 3/2.0 (+1) | 1,083 (-9%) | 12mo | $196,900 | $182 | 32 |
Match score weights: distance 35% · size 25% · config 20% · recency 20%. Top-matched comps best support the ARV.
Projected returns pro-forma
-3.0% appreciation · 3.0% rent growth · sell at horizon
- IRR
- 1.4%
- Equity multiple
- 1.05×
- Total profit
- $1,239
- Equity at exit
- $12,674
- IRR
- 11.0%
- Equity multiple
- 1.86×
- Total profit
- $20,445
- Equity at exit
- $7,349
Cash invested: $23,800 (down + closing). Projections, not guarantees.
Landlord ↔ Tenant lean methodology
- Overall (STATE)
- 90 Strongly Landlord-Friendly
- State South Carolina
- 90 Strongly Landlord-Friendly · R+6
- County
- — inherits STATE
- City
- — inherits STATE
ZIP-level market 29341
- Home prices YoY
- -24.1%
- Active inventory
- 196
- Price-to-rent
- 6.8×
Monthly cashflow live
- Estimated rent
- $1,035 medium interval (Pro) →
- Mortgage (P&I)
- −$446
- Tax from tax record
- −$101 /mo · $1,211/yr
- Insurance
- −$35
- HOA
- −$0
- Vacancy / Maint / Mgmt
- −$217
- Net cashflow
- $236
Break-even live
UW: 25.0% down · 7.5% · 30yr · 1.5% tax · 5.0% vac · 8.0% maint · 8.0% mgmt
Financing live
Cash to close
- Down payment
- $21,250
- Closing costs
- $2,550
- Reserves months
- —
- Total cash needed
- —
Loan-product check · same deal, 3 products live
Conventional
25% down · 7.5% · 30yr
- Down + closing
- —
- Monthly P&I
- —
- Monthly cashflow
- —
- DSCR
- —
- Eligible?
- —
Personal DTI + credit; lowest rate.
DSCR
20% down · 8.5% · 30yr
- Down + closing
- —
- Monthly P&I
- —
- Monthly cashflow
- —
- DSCR
- —
- Eligible?
- —
No personal income docs; deal must DSCR.
Hard money
10% down · 12.0% · 12mo
- Down + closing
- —
- Monthly P&I
- —
- Monthly cashflow
- —
- DSCR
- —
- Eligible?
- —
Short-term bridge; refi at stabilization.
Rent comps 1 comps
| Address | Beds | Baths | Sqft | Rent | $/sqft | DOM | Units | Dist |
|---|---|---|---|---|---|---|---|---|
| 112 Martin Ln Gaffney, SC | 2.0 | 1.5 | 921 | $975 | $1.06 | 5d | 1 | 1.17mi |
Listing history 18 events
-
2026-06-19days on market $85,000 Active 199 DOM
-
2026-06-18days on market $85,000 Active 198 DOM
-
2026-06-17days on market $85,000 Active 197 DOM
-
2026-06-16days on market $85,000 Active 196 DOM
-
2026-06-15days on market $85,000 Active 195 DOM
-
2026-06-14days on market $85,000 Active 193 DOM
-
2026-06-13days on market $85,000 Active 192 DOM
-
2026-06-10days on market $85,000 Active 190 DOM
-
2026-06-09days on market $85,000 Active 189 DOM
-
2026-06-08days on market $85,000 Active 188 DOM
-
2026-06-07days on market $85,000 Active 187 DOM
-
2026-06-02days on market $85,000 Active 182 DOM
-
2026-06-01days on market $85,000 Active 181 DOM
-
2026-05-31days on market $85,000 Active 180 DOM
-
2026-05-30days on market $85,000 Active 179 DOM
-
2026-01-16price $85,000
-
2025-12-02$95,000 Active
-
2021-12-14soldstatus $520,667
ⓘ Source: listings_history table (triggers on properties + properties_extension) + one-shot
backfill from property_details.listing_events for pre-trigger history.
Tax reassessment forecast SC · Resets to sale price
- Current annual tax
- $1,211 · $101/mo
- Projected year-2 tax
- $1,211 · $101/mo
- Expected delta
- $0/yr ($0/mo · 0.0%)
ⓘ Screening estimate from a state-policy table — verify with the county assessor before closing.
Climate risk First Street
- Flood 1/10 Low FEMA zone X (unshaded) · 0% chance over 30 yrs
- Wildfire 3/10 Moderate
- Heat 6/10 Major 7 d/yr ≥103°F today · 17 d/yr by 30 yrs out
- Wind 3/10 Moderate 4% chance of damaging wind over 30 yrs
- Air quality 3/10 Moderate 3 unhealthy d/yr today · 4 by 30 yrs out
Nearby sold comps map
Loading sold comps map…
Walkable amenities ~0.75 mi
Loading nearby amenities…
Taxation est. · year 1
- Rental income
- $12,419
- − Mortgage interest
- −$4,761
- − Property taxes
- −$1,211
- − Insurance
- −$425
- − Repairs & maintenance
- −$994
- − Management
- −$994
- − Depreciation
- −$2,473
- Taxable income
- $1,562
- Est. tax owed @ 24.0%
- −$375
- After-tax cash flow
- $2,451/yr
For passive investors: Depreciation is non-cash, so a rental often shows a tax loss while cash-flowing — sheltering income. Rental losses are passive: they offset passive income freely, and up to $25,000/yr can offset ordinary (W-2) income if you actively participate and your MAGI is under $100k (phasing out to $0 by $150k); unused losses carry forward. On sale, claimed depreciation is recaptured at up to 25%, and gains may owe capital-gains tax (a 1031 exchange can defer both). Figures are a year-1 estimate at your 24.0% rate — not tax advice; consult a CPA.
Schools (NCES district)
- District
- Cherokee 01
- NCES district ID
- 4501500
- Math proficiency
- 29% ▼ -9.00%
- Reading proficiency
- 40% ▼ -2.00%
- Median HH income
- $34,262
- Composite
- 28.39/100
- National rank
- #6768
- State rank
- #47 of 80 in SC
Livability — Gaffney
- Score
- 66/100
- State rank
- #112
- US rank
- #11549
Category grades
Schools grade is shown separately in the Schools card above.
Census & demographics
- County
- Cherokee County · 41,410 people
- City population
- 41,410
- Metro
- Gaffney, SC
- Population (ZIP)
- 20,647
- Household income
- $58,029
- Rent vs Own
- Severe rent burden
- 452.0
Population outlook (Cherokee County) Hauer SSP2
- Today (2025)
- 58,602 people
- By 2030
- 59,336 · +1.3%
- By 2040
- 60,266 · +2.8%
- By 2050
- 60,314 · +2.9%
- By 2075
- 59,276 · +1.2%
- By 2100
- 53,788 · -8.2%
Race, ethnicity, and origin ACS 2023
- Neighborhood character
- Diverse neighborhood (Simpson 0.58)
- Race & ethnicity
- White 59% Black 26% Two or more races 9% Hispanic / Latino 8%
- Hispanic origin (detail)
- Mexican 4% Puerto Rican 1%
- Common ancestry
- Italian 2% Serbian 2% Slovak 2%
- Foreign-born
- 4% · Canada
- Languages at home
- 93% English-only · Spanish 6% Other Indo-European 1%
Political lean MEDSL · Cherokee
- 2024 margin
- Solid R (+51.4) · D 23.9% · R 75.3%
- 2008→2024 swing
- -22.0pp toward R · 2008: -29.3pp · 2024: -51.4pp
- All cycles
- 2024: R+51.4 2020: R+43.8 2016: R+41.7 2012: R+29.3 2008: R+29.3
Not yet ingested
- Civics
- —
Market trends
- HPI YoY
- ▼ -64.62%
- Current HPI
- 203.8038
- Rent YoY
- —
- Metro
- Gaffney, SC
- State GDP YoY
- ▲ 4.51%
- F500 in state
- 2
Industry mix (Fortune 500 HQ in SC)
| Industry | F500 HQs | Revenue |
|---|---|---|
| Packaging | 1 | $7B |
|
||
Price history
-83.7% since first listed3 events — show timeline
- 2026-01-16 Price Changed $85,000 SPMLS
- 2025-12-02 Listed $95,000 SPMLS
- 2021-12-14 Sold (Public Records) $520,667 Public Records
Property tax history
+8.5%/yrLatest (2025): $1,211 · +5.5% YoY. Source: county tax records.
Cash-flow waterfall
monthlySold comps — $/sqft
last 12 mo · ≤1 miLoading sold comps…