22780 Skylink Dr · Canyon Lake, CA
Flood risk 1/10 · Minimal
- FEMA flood zone
- X (unshaded)
- Chance of flooding over 30 yrs
- 0.0%
- Est. flood insurance / yr
- $507 – $1,088
Fire risk 7/10 · Major
- Est. fire insurance / yr
- $659 – $1,223
Heat risk 6/10 · Moderate
- Hot days now (above 104°F)
- 7 days/yr
- Hot days in 30 yrs
- 19 days/yr
Wind risk 1/10 · Minimal
- Chance of severe wind over 30 yrs
- —
Air-quality risk 6/10 · Moderate
- Unhealthy air days now
- 9 days/yr
- Unhealthy air days in 30 yrs
- 11 days/yr
Risk factors via First Street. Map © Google.
Why this score? — see what drove the D grade
The composite is a weighted blend of 9 inputs, each scored 0–100. Each bar is that input's sub-score; the figure is the points it added to the 100-point composite (weight × sub-score).
- ARV discount +13.2/15.0
- Cash flow +11.2/30.0
- 1% rule +3.8/10.0
- Schools +3.7/10.0
- DSCR +3.3/10.0
- Livability +2.8/5.0
- Rent growth +2.5/5.0
- Condition / age +2.5/5.0
- Appreciation +0.0/10.0
$275,000
🖨 Deal sheet (PDF) 📄 Offer letter ✓ Due diligence
Listing remarks
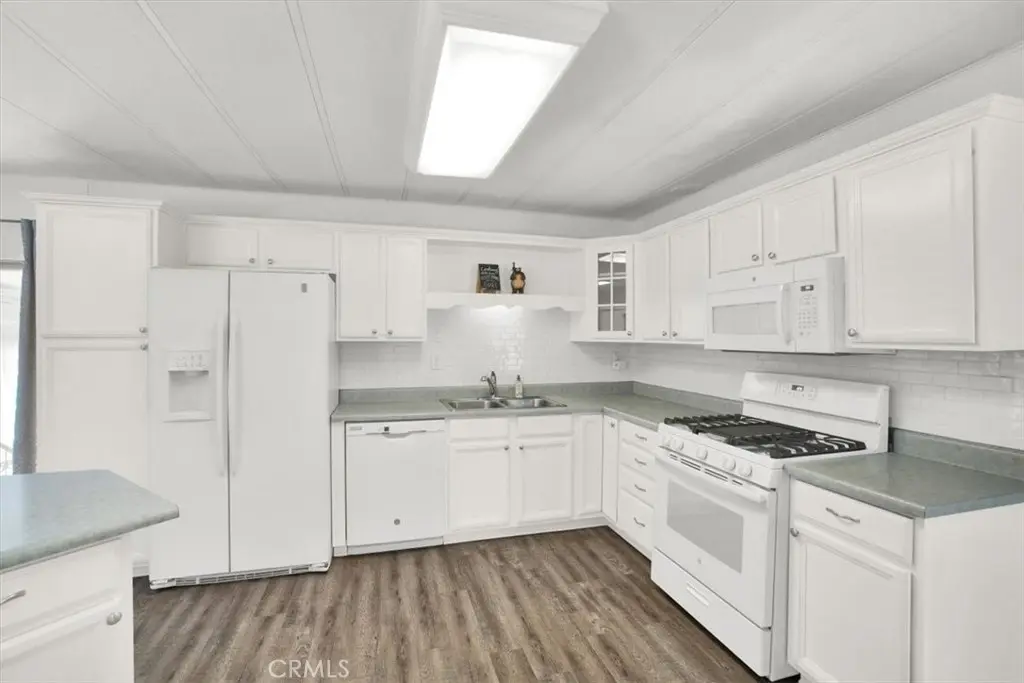
Experience resort-style living in the gated, private, golf cart-friendly, waterfront community of Canyon Lake, where you own the land and enjoy low taxes with no space rent. Perfectly positioned with sweeping golf course views and stunning sunset skies, this meticulously maintained two-bedroom, two-bath home offers comfort, style, and an impressive list of upgrades. Step inside to an open and inviting floor plan featuring updated luxury vinyl plank flooring, 5-inch baseboards, and spacious living areas designed for both everyday living and entertaining. The remodeled kitchen showcases white oak cabinetry, subway tile backsplash, newer appliances, a five-burner gas cooktop with center grill,
Key facts
- Gated community
- White oak cabinetry
- Remodeled kitchen
Tags
Property features AI
Finance
- Other: Community features include lake access, park, storm drains, riding/stables
- HOA & community: Part of CLPOA with monthly association dues; Association fee approximately $362 per month; Association amenities include: controlled access/guard, onsite property management, clubhouse, meeting room, banquet facilities, maintenance of grounds, pool, sport courts (tennis, pickleball, other courts), golf, docks, hiking/biking/horse trails, playground, dog park, fishing, watersports, picnic and barbecue/outdoor cooking areas, storage, recreational multipurpose room
Exterior
- Utilities: Public sewer; District/public water
- Home design: Single-story property; Planned development community; No shared/common walls; Entry level: 1
- Construction: Year built reported from public records; Parcel number 354191002
- Exterior features: Manufactured house; Association pool; Has a view; Lot noted as 6,500–9,999 sq ft (lot range from assessor's data)
Interior
- Kitchen: Kitchen on main floor
- Bedrooms: Primary bedroom on main floor; Two main-level bedrooms
- Bathrooms: One full bathroom; One half bathroom; Two bathrooms on the main level
- Heating & cooling: Central furnace heating; Zoned cooling
- Interior features: One-level layout; Side entry; Main floor primary bedroom; All bedrooms on the main level; Primary bathroom
- Laundry & utility: Laundry room inside the home; Dedicated laundry room
Neighborhood map
What this means for you Summary
Snapshot
- This is a 2-bed/1.0-bath manufactured listed at $275k.
Deal economics
- At list price, monthly cash flow is $-106 ($-1k/yr) — negative.
- To cash-flow at today's rent, offer at most $256k (6.8% below list).
- To meet the 1% rule (rent ≥ 1% of price), the offer needs to be $243k (11.8% below list).
- Recommended offer: $243k (11.8% below list) — sets the bar for 1% rule.
- Cap rate 5.8% vs local median 2.3% in Canyon Lake — top-decile yield for the area; either an underpriced asset or a hidden risk that comps aren't pricing in. Stress-test before assuming the spread holds.
Location & tenants
- Location reads 56/100 on livability (#825 in CA) — a working-class tenant base; expect higher turnover. Strengths: crime A+, employment A+, housing A+; Watch: health & safety C-, amenities F, commute F.
- Lake Elsinore Unified (suburban): math 34% / reading 49% proficiency, ranked #210 of 517 in CA (top 41%) — families likely to look elsewhere, expect single-tenant / working-renter base with shorter leases.
- Zoned schools: Cottonwood Canyon Elementary (math 54% / reading 54%, grade C, #311 of 1,571 statewide, top 21%, 789 students, 50% FRL); Canyon Lake Middle (math 44% / reading 64%, grade B-, #78 of 498 statewide, top 15%, 955 students, 51% FRL); Temescal Canyon High (math 50% / reading 90%, grade B+, #112 of 1,170 statewide, top 10%, 2,176 students, 59% FRL).
- Zoned-school proficiency averages 60% at this address vs 42% district-wide (+18 pts) — the actual schools serving this property are materially stronger than the Lake Elsinore Unified average implies; a family-tenant draw the district grade alone would hide.
- Market conditions: 255 active listings in the ZIP; 9,195 units permitted in Riverside County in 2024 (1,512 in 5+ unit buildings).
Forward outlook
- Local home prices are declining (-3.0%/yr); year-one equity from $2k of loan paydown is wiped out by about $8k of value loss. Plan a longer hold.
- Riverside County population projected at +22% by 2050 — long-run rental-demand tailwind backs the buy-and-hold thesis.
Negotiation context
- Only 3 days on market — expect competitive offers; lowballing is unlikely to land.
- 7 sale attempts since 5y ago with the ask held roughly flat each time — persistent listings suggest the price (not the market) is what's stuck; bring a comps-based counter.
Risks & watch-outs
- Climate carrying-cost: major wildfire risk; extreme-heat days projected 7→19/yr by 2055 (HVAC capex compounding) — expect insurance premiums to compound above CPI over the hold.
Questions for the listing agent
- What do current leases actually rent for vs. the listed asking? Can we see a recent rent roll and the last 12 months of T-12 income?
- Built in 1971 — when were the roof, HVAC, electrical panel, plumbing, and water heater last replaced?
- What does the HOA fee cover, when was the last increase, and are there any pending special assessments or reserve-fund shortfalls?
- Is there a deadline driving the sale (1031 exchange, divorce, estate, relocation)? That informs how much negotiation room exists.
- Schools are D-rated, which usually means shorter tenancies and higher turnover. Who's the typical renter profile here, and what's been the actual vacancy rate?
- The area grade is low — what's the realistic commute time and amenity access for the typical tenant pool here? Any planned neighborhood developments (good or bad) we should know about?
- What's the average days-on-market for RENTAL listings here right now (not sales)? A rising rental-DOM trend means longer vacancies and softer asking-rent achievability than the comps imply.
- What's the recent tenant-quality profile in this submarket — average credit score on applications, eviction rate, late-payment / NSF rate, and stable-employment percentage? A property-management company in the area should have these aggregated.
- How much new for-sale + rental construction is in the pipeline within 1–3 miles? Heavy new supply typically softens prices + rents 12–24 months out; constrained supply supports both.
Investment metrics
- 1% rule
- 0.88% ✗
- Cap rate
- 5.83%
- Cash-on-cash
- -1.64%
- DSCR
- 0.93
- GRM
- 9.4
CMA / ARV
- ARV (median comp)
- $315,106
- List price
- $275,000
- Delta
- -11.14%
- Verdict
- UNDERPRICED
- Comps
- 5 within 1.0 mi
Projected returns pro-forma
-3.0% appreciation · 3.0% rent growth · sell at horizon
- IRR
- -19.0%
- Equity multiple
- 0.34×
- Total profit
- $-51,171
- Equity at exit
- $41,003
- IRR
- -11.4%
- Equity multiple
- 0.31×
- Total profit
- $-52,760
- Equity at exit
- $23,777
Cash invested: $77,000 (down + closing). Projections, not guarantees.
Landlord ↔ Tenant lean methodology
- Overall (STATE)
- 18 Strongly Tenant-Friendly
- State California
- 18 Strongly Tenant-Friendly · D+13
- County
- — inherits STATE
- City
- — inherits STATE
ZIP-level market 92587
- Active inventory
- 255
- Price-to-rent
- 9.4×
Monthly cashflow live
- Estimated rent
- $2,427 medium interval (Pro) →
- Mortgage (P&I)
- −$1,442
- Tax from tax record
- −$104 /mo · $1,245/yr
- Insurance
- −$115
- HOA
- −$362
- Vacancy / Maint / Mgmt
- −$510
- Net cashflow
- $-106
Break-even live
Sensitivity live
| Price | -10% $50 | -5% $-28 | +0% $-106 | +5% $-183 | +10% $-261 |
|---|---|---|---|---|---|
| Rent | -10% $-297 | -5% $-201 | +0% $-106 | +5% $-10 | +10% $86 |
| Rate | -1.0pp $33 | -0.5pp $-36 | base $-106 | +0.5pp $-177 | +1.0pp $-249 |
UW: 25.0% down · 7.5% · 30yr · 1.5% tax · 5.0% vac · 8.0% maint · 8.0% mgmt
Financing live
Cash to close
- Down payment
- $68,750
- Closing costs
- $8,250
- Reserves months
- —
- Total cash needed
- —
Loan-product check · same deal, 3 products live
Conventional
25% down · 7.5% · 30yr
- Down + closing
- —
- Monthly P&I
- —
- Monthly cashflow
- —
- DSCR
- —
- Eligible?
- —
Personal DTI + credit; lowest rate.
DSCR
20% down · 8.5% · 30yr
- Down + closing
- —
- Monthly P&I
- —
- Monthly cashflow
- —
- DSCR
- —
- Eligible?
- —
No personal income docs; deal must DSCR.
Hard money
10% down · 12.0% · 12mo
- Down + closing
- —
- Monthly P&I
- —
- Monthly cashflow
- —
- DSCR
- —
- Eligible?
- —
Short-term bridge; refi at stabilization.
HOA detail
- Monthly dues
- $362 · $4,344/yr
- Likely covers
- watergassecurity
Listing history 34 events
-
2026-06-21remarks 699-char remark
-
2026-06-21pricedays on market $275,000 Active 3 DOM
-
2026-06-09days on market $280,000 Active 158 DOM
-
2026-06-08days on market $280,000 Active 157 DOM
-
2026-06-07days on market $280,000 Active 156 DOM
-
2026-06-04days on market $280,000 Active 153 DOM
-
2026-06-03days on market $280,000 Active 152 DOM
-
2026-06-02days on market $280,000 Active 151 DOM
-
2026-06-01days on market $280,000 Active 150 DOM
-
2026-05-31days on market $280,000 Active 149 DOM
-
2026-05-06status Active 2464-char remark
-
2026-05-05historical Active Under Contract 2464-char remark
-
2026-04-12price $289,000 2464-char remark
-
2026-04-10price $298,000 2464-char remark
-
2026-04-03price $299,000 2464-char remark
-
2026-02-27price $299,900 2464-char remark
-
2026-02-22price $319,900 2464-char remark
-
2026-02-13price $329,900 2464-char remark
-
2026-01-02$335,000 Active 2464-char remark
-
2025-12-01historical
-
2025-11-15price $335,000
-
2025-10-30$349,999 Active
-
2025-10-24historical
-
2023-12-12historical
-
2023-12-05price $324,000
-
2023-11-28status Active
-
2023-10-20historical Active Under Contract
-
2023-09-08$324,750 Active
-
2021-06-04status Pending Sale
-
2021-06-03historical
-
2021-05-18price $248,888
-
2021-05-14price $269,900
-
2021-05-08price $274,000
-
2021-04-30$289,900 Active
ⓘ Source: listings_history table (triggers on properties + properties_extension) + one-shot
backfill from property_details.listing_events for pre-trigger history.
Tax reassessment forecast CA · Resets to sale price
- Current annual tax
- $1,245 · $104/mo
- Projected year-2 tax
- $2,090 · $174/mo
- Expected delta
- +$845/yr (+$70/mo · 67.9%)
ⓘ Screening estimate from a state-policy table — verify with the county assessor before closing.
Climate risk First Street
- Flood 1/10 Low FEMA zone X (unshaded) · 0% chance over 30 yrs
- Wildfire 7/10 Severe
- Heat 6/10 Major 7 d/yr ≥104°F today · 19 d/yr by 30 yrs out
- Wind 1/10 Low
- Air quality 6/10 Major 9 unhealthy d/yr today · 11 by 30 yrs out
Nearby sold comps map
Loading sold comps map…
Walkable amenities ~0.75 mi
Loading nearby amenities…
Taxation est. · year 1
- Rental income
- $29,118
- − Mortgage interest
- −$15,404
- − Property taxes
- −$1,245
- − Insurance
- −$1,375
- − Repairs & maintenance
- −$2,329
- − Management
- −$2,329
- − HOA
- −$4,344
- − Depreciation
- −$8,000
- Taxable loss
- −$5,909
- Est. tax savings @ 24.0%
- +$1,418
- After-tax cash flow
- $152/yr
For passive investors: Depreciation is non-cash, so a rental often shows a tax loss while cash-flowing — sheltering income. Rental losses are passive: they offset passive income freely, and up to $25,000/yr can offset ordinary (W-2) income if you actively participate and your MAGI is under $100k (phasing out to $0 by $150k); unused losses carry forward. On sale, claimed depreciation is recaptured at up to 25%, and gains may owe capital-gains tax (a 1031 exchange can defer both). Figures are a year-1 estimate at your 24.0% rate — not tax advice; consult a CPA.
Schools (NCES district)
- District
- Lake Elsinore Unified
- NCES district ID
- 0600027
- Math proficiency
- 34% ▲ 5.00%
- Reading proficiency
- 49% ▲ 8.00%
- Median HH income
- $63,829
- Composite
- 37.01/100
- National rank
- #4518
- State rank
- #210 of 517 in CA
Livability — Canyon Lake
- Score
- 56/100
- State rank
- #825
- US rank
- #23089
Category grades
Schools grade is shown separately in the Schools card above.
Census & demographics
- Census place
- Canyon Lake, CA
- Population (ZIP)
- 18,382
Population outlook (Riverside County) Hauer SSP2
- Today (2025)
- 2,664,475 people
- By 2030
- 2,802,692 · +5.2%
- By 2040
- 3,050,904 · +14.5%
- By 2050
- 3,256,783 · +22.2%
- By 2075
- 3,655,058 · +37.2%
- By 2100
- 3,766,594 · +41.4%
Race, ethnicity, and origin ACS 2023
- Neighborhood character
- Diverse neighborhood (Simpson 0.60)
- Race & ethnicity
- White 55% Hispanic / Latino 30% Two or more races 15% Black 4% Asian 3% Native American 1%
- Hispanic origin (detail)
- Mexican 25% Puerto Rican 1%
- Common ancestry
- Lithuanian 2% Italian 1% Slovak 1%
- Foreign-born
- 10% · Canada, Vietnam
- Languages at home
- 80% English-only · Spanish 17% Other Asian/Pacific 1% Vietnamese 1%
Political lean MEDSL · Riverside
- 2024 margin
- Toss-up / Even · D 48.0% · R 49.3% · Other 2.6%
- 2008→2024 swing
- -3.6pp toward R · 2008: 2.3pp · 2024: -1.3pp
- All cycles
- 2024: R+1.3 2020: D+8.0 2016: D+4.3 2012: R+0.4 2008: D+2.3
Not yet ingested
- Civics
- —
Market trends
- HPI YoY
- ▼ -403.17%
- Current HPI
- 336.4209
- Rent YoY
- —
- Metro
- —
- State GDP YoY
- ▲ 3.21%
- F500 in state
- 116
Industry mix (Fortune 500 HQ in CA)
| Industry | F500 HQs | Revenue |
|---|---|---|
| Technology | 27 | $1,492B |
|
||
| Financial Services | 3 | $174B |
|
||
| Retail | 3 | $44B |
|
||
| Insurance | 3 | $26B |
|
||
| Media / Entertainment | 2 | $115B |
|
||
| Pharmaceuticals / Biotech | 2 | $62B |
|
||
Price history
-5.1% since first listed29 events — show timeline
- 2026-06-18 Listed $275,000 CRMLS
- 2026-06-11 Listing Removed — CRMLS
- 2026-06-09 Price Changed $309,000 CRMLS
- 2026-05-26 Price Changed $280,000 CRMLS
- 2026-05-22 Price Changed $285,000 CRMLS
- 2026-05-06 Relisted — CRMLS
- 2026-05-05 Contingent — CRMLS
- 2026-04-12 Price Changed $289,000 CRMLS
- 2026-04-10 Price Changed $298,000 CRMLS
- 2026-04-03 Price Changed $299,000 CRMLS
- 2026-02-27 Price Changed $299,900 CRMLS
- 2026-02-22 Price Changed $319,900 CRMLS
- 2026-02-13 Price Changed $329,900 CRMLS
- 2026-01-02 Listed $335,000 CRMLS
- 2025-12-01 Listing Removed — CRMLS
- 2025-11-15 Price Changed $335,000 CRMLS
- 2025-10-30 Listed $349,999 CRMLS
- 2025-10-24 Coming Soon — CRMLS
- 2023-12-12 Listing Removed — CRMLS
- 2023-12-05 Price Changed $324,000 CRMLS
- 2023-11-28 Relisted — CRMLS
- 2023-10-20 Contingent — CRMLS
- 2023-09-08 Listed $324,750 CRMLS
- 2021-06-04 Pending — CRMLS
- 2021-06-03 Listing Removed — CRMLS
- 2021-05-18 Price Changed $248,888 CRMLS
- 2021-05-14 Price Changed $269,900 CRMLS
- 2021-05-08 Price Changed $274,000 CRMLS
- 2021-04-30 Listed $289,900 CRMLS
Property tax history
+5.6%/yrLatest (2025): $1,245 · +2.6% YoY. Source: county tax records.
Cash-flow waterfall
monthlySold comps — $/sqft
last 12 mo · ≤1 miLoading sold comps…