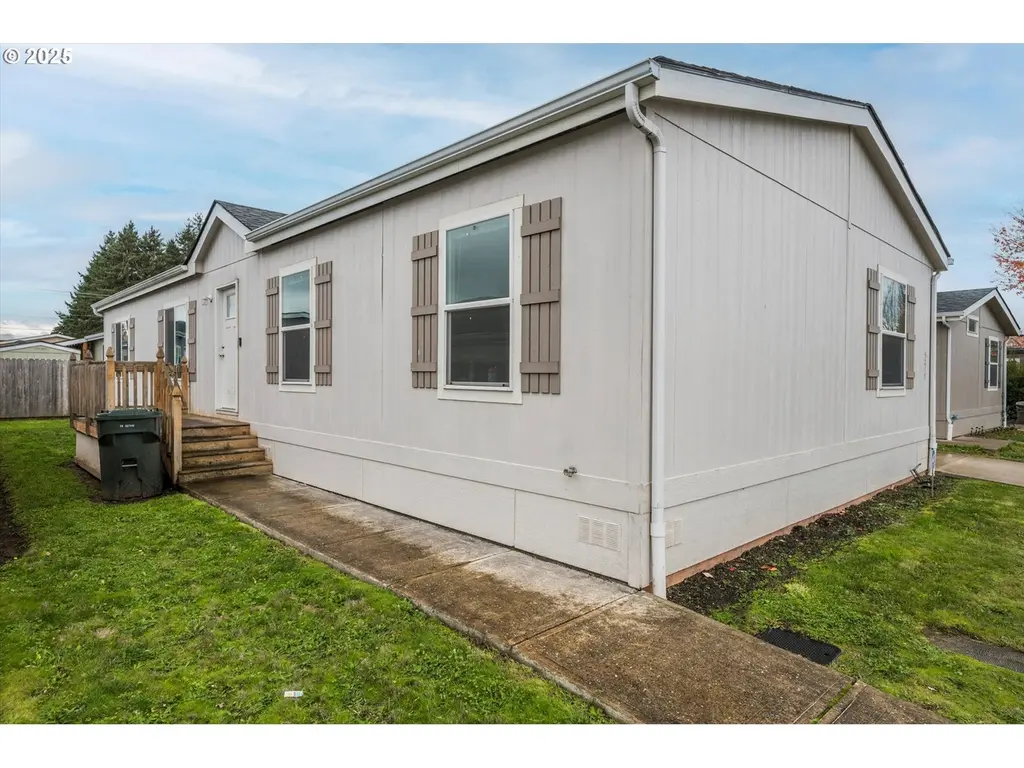
5217 Silver Loop NE · Salem, OR
Flood risk 1/10 · Minimal
- FEMA flood zone
- X (unshaded)
- Chance of flooding over 30 yrs
- 0.0%
- Est. flood insurance / yr
- $507 – $1,088
Fire risk 2/10 · Minimal
- Est. fire insurance / yr
- $498 – $926
Heat risk 4/10 · Minor
- Hot days now (above 92°F)
- 7 days/yr
- Hot days in 30 yrs
- 15 days/yr
Wind risk 1/10 · Minimal
- Chance of severe wind over 30 yrs
- —
Air-quality risk 10/10 · Severe
- Unhealthy air days now
- 13 days/yr
- Unhealthy air days in 30 yrs
- 14 days/yr
Risk factors via First Street. Map © Google.
Why this score? — see what drove the B- grade
The composite is a weighted blend of 9 inputs, each scored 0–100. Each bar is that input's sub-score; the figure is the points it added to the 100-point composite (weight × sub-score).
- Cash flow +30.0/30.0
- DSCR +10.0/10.0
- 1% rule +9.7/10.0
- ARV discount +7.5/15.0
- Livability +4.0/5.0
- Schools +3.7/10.0
- Rent growth +2.5/5.0
- Condition / age +2.5/5.0
- Appreciation +0.0/10.0
$159,000
🖨 Deal sheet 📄 Offer letter ✓ Due diligence
Listing remarks MLS
Hard to find 4 bedroom in an all family park! The one owner home features great room style living with a beautiful kitchen! Great Workspace plus and eating island, black appliances and a farm style stainless sink! Vaulted living and dining area. Laminate floors with carpet in the bedrooms. Separate utility room with cabinets. Double sinks in the large primary! This home sits on a nice lot with room to play! Water and sewer are added to the base rent.
Key facts
- Garage
- Built 2018
- Listed 210 days
Neighborhood map
What this means for you Summary
Snapshot
- This is a 3-bed/2.0-bath manufactured listed at $159k.
Deal economics
- At list price, monthly cash flow is $803 ($10k/yr) — positive.
- The deal already cash-flows at list — no discount required.
- Meets the 1% rule at list price ($2k rent vs $159k).
- Recommended offer: $140k (12.0% below list) — sets the bar for market timing.
- Cap rate 12.4% vs local median 2.9% in Salem — top-decile yield for the area; either an underpriced asset or a hidden risk that comps aren't pricing in. Stress-test before assuming the spread holds.
Location & tenants
- Location reads 79/100 on livability (#59 in OR, #2,084 nationally) — a middle-class / working-renter tenant base. Strengths: amenities A+, commute A+, housing A+; Watch: schools D, crime F.
- Salem-Keizer SD 24J (urban): math 34% / reading 47% proficiency, ranked #103 of 183 in OR (top 56%) — families likely to look elsewhere, expect single-tenant / working-renter base with shorter leases.
- Market conditions: 175 active listings in the ZIP; 15 comparable units currently listed for rent nearby; rentals at typical pace (median 24d on market — plan ~3-4 weeks tenant-placement turnaround); 40% of comp listings sitting > 30 days — soft ceiling on asking rent; 1,591 units permitted in Marion County in 2024 (716 in 5+ unit buildings).
Forward outlook
- Local home prices are declining (-3.0%/yr); year-one equity from $1k of loan paydown is wiped out by about $5k of value loss. Plan a longer hold.
- Marion County population projected at +17% by 2050 — long-run rental-demand tailwind backs the buy-and-hold thesis.
- At projected returns (-3.0% appreciation + 3.0% rent growth), your $45k cash investment doubles in ~6 years — after that, you're playing with house money.
Negotiation context
- It's been on market 210 days — a 12% lower offer ($140k) is reasonable based on typical stale-listing flexibility.
Questions for the listing agent
- It's been on market 210 days. Have you received any prior offers? Is the seller open to a 12% concession, seller financing, or rate buy-down credit?
- Why hasn't it sold? Are there any deal-killer items the seller is aware of (foundation, flood, title, zoning, code violations)?
- Is there a deadline driving the sale (1031 exchange, divorce, estate, relocation)? That informs how much negotiation room exists.
- Schools are D-rated, which usually means shorter tenancies and higher turnover. Who's the typical renter profile here, and what's been the actual vacancy rate?
- Crime grade is F in this area — have there been break-ins, vandalism, or insurance claims at this property in the last 3 years? What carrier currently insures it and at what premium?
- What's the average days-on-market for RENTAL listings here right now (not sales)? A rising rental-DOM trend means longer vacancies and softer asking-rent achievability than the comps imply.
- What's the recent tenant-quality profile in this submarket — average credit score on applications, eviction rate, late-payment / NSF rate, and stable-employment percentage? A property-management company in the area should have these aggregated.
- How much new for-sale + rental construction is in the pipeline within 1–3 miles? Heavy new supply typically softens prices + rents 12–24 months out; constrained supply supports both.
Investment metrics
- 1% rule
- 1.47% ✓
- Cap rate
- 12.35%
- Cash-on-cash
- 21.64%
- DSCR
- 1.96
- GRM
- 5.7
CMA / ARV
- ARV (median comp)
- $92,825
- List price
- $159,000
- Delta
- 71.29%
- Verdict
- OVERPRICED
- Comps
- 20 within 1.0 mi
Show comp detail 12 sales within ~0.75 mi
| Address | Dist | Beds/Ba | Sqft | Sold | Price | $/sf | Match |
|---|---|---|---|---|---|---|---|
| 5279 Gold Dust St NE #220 | 0.08mi | 3/2.0 | 1,512 (-7%) | 4mo | $130,000 | $86 | 82 |
| 5158 Silver Lp NE | 0.09mi | 3/2.0 | 1,724 (+6%) | 5mo | $149,900 | $87 | 81 |
| 5151 Copper Creek Loop #183 | 0.16mi | 3/2.0 | 1,512 (-7%) | 2mo | $130,000 | $86 | 80 |
| 5422 Portland Rd NE #139 | 0.28mi | 3/2.0 | 1,512 (-7%) | 3mo | $85,750 | $57 | 73 |
| 5422 Portland Rd NE #89 | 0.28mi | 3/2.0 | 1,536 (-5%) | 6mo | $104,000 | $68 | 73 |
| 4374 Larch Lp NE | 0.38mi | 2/2.0 (-1) | 1,536 (-5%) | 0mo | $99,900 | $65 | 68 |
| 5287 Gold Dust St #222 | 0.10mi | 4/2.0 (+1) | 1,404 (-13%) | 4mo | $136,850 | $97 | 65 |
| 5574 43rd Pl NE | 0.38mi | 3/2.0 | 1,512 (-7%) | 8mo | $127,000 | $84 | 65 |
| 5422 Portland Rd NE #24 | 0.28mi | 2/2.0 (-1) | 1,440 (-11%) | 1mo | $60,000 | $42 | 62 |
| 5422 Portland Rd #35 | 0.28mi | 3/2.0 | 1,404 (-13%) | 7mo | $73,000 | $52 | 59 |
| 4383 NE Larch Loop | 0.37mi | 2/2.0 (-1) | 1,440 (-11%) | 7mo | $50,000 | $35 | 53 |
| 4353 Lemon St NE | 0.43mi | 3/2.0 | 1,386 (-14%) | 4mo | $57,500 | $41 | 53 |
Match score weights: distance 35% · size 25% · config 20% · recency 20%. Top-matched comps best support the ARV.
Projected returns pro-forma
-3.0% appreciation · 3.0% rent growth · sell at horizon
- IRR
- 14.2%
- Equity multiple
- 1.57×
- Total profit
- $25,378
- Equity at exit
- $23,707
- IRR
- 23.0%
- Equity multiple
- 2.98×
- Total profit
- $87,961
- Equity at exit
- $13,747
Cash invested: $44,520 (down + closing). Projections, not guarantees.
Landlord ↔ Tenant lean methodology
- Overall (STATE)
- 28 Tenant-Leaning
- State Oregon
- 28 Tenant-Leaning · D+6
- County
- — inherits STATE
- City
- — inherits STATE
ZIP-level market 97305
- Active inventory
- 175
- Price-to-rent
- 5.7×
Monthly cashflow live
- Estimated rent
- $2,340 high interval (Pro) →
- Mortgage (P&I)
- −$834
- Tax from tax record
- −$145 /mo · $1,746/yr
- Insurance
- −$66
- HOA
- −$0
- Vacancy / Maint / Mgmt
- −$491
- Net cashflow
- $803
Break-even live
UW: 25.0% down · 7.5% · 30yr · 1.5% tax · 5.0% vac · 8.0% maint · 8.0% mgmt
Financing live
Cash to close
- Down payment
- $39,750
- Closing costs
- $4,770
- Reserves months
- —
- Total cash needed
- —
Loan-product check · same deal, 3 products live
Conventional
25% down · 7.5% · 30yr
- Down + closing
- —
- Monthly P&I
- —
- Monthly cashflow
- —
- DSCR
- —
- Eligible?
- —
Personal DTI + credit; lowest rate.
DSCR
20% down · 8.5% · 30yr
- Down + closing
- —
- Monthly P&I
- —
- Monthly cashflow
- —
- DSCR
- —
- Eligible?
- —
No personal income docs; deal must DSCR.
Hard money
10% down · 12.0% · 12mo
- Down + closing
- —
- Monthly P&I
- —
- Monthly cashflow
- —
- DSCR
- —
- Eligible?
- —
Short-term bridge; refi at stabilization.
Rent comps 15 comps
| Address | Beds | Baths | Sqft | Rent | $/sqft | DOM | Units | Dist |
|---|---|---|---|---|---|---|---|---|
| 5115 Countryside St NE Salem, OR | 3.0 | 1.0–2.0 | 876 | $2,260 | $2.58 | 14d | 20 | 0.21mi |
| 4707 Astronaut Ave NE Salem, OR | 4.0 | 2.5 | 2000 | $2,795 | $1.40 | 14d | 1 | 0.28mi |
| 4115 Geranium Loop NE Salem, OR | 3.0 | 2.5 | 1316 | $2,250 | $1.71 | 14d | 1 | 0.46mi |
| 4823 Settlers Dr NE Salem, OR | 3.0 | 2.0 | 1228 | $2,395 | $1.95 | 44d | 1 | 0.57mi |
| 4927 Orbit Ave NE Salem, OR | 3.0 | 2.5 | 1598 | $2,395 | $1.50 | 21d | 1 | 0.65mi |
| 4040 Hayesville Dr NE Salem, OR | 1.0–3.0 | 1.0–2.0 | 927 | $1,995 | $2.15 | 14d | 25 | 0.70mi |
| 5034 Armstrong Ave NE Salem, OR | 3.0 | 2.5 | 1400 | $2,550 | $1.82 | 44d | 1 | 0.76mi |
| 5150 Constellation Ave NE Salem, OR | 3.0 | 2.0 | 1869 | $2,795 | $1.50 | 14d | 1 | 0.89mi |
| 4473 47th Ave NE Salem, OR | 3.0 | 1.0 | 1244 | $2,200 | $1.77 | 44d | 1 | 0.98mi |
| 4334 Ward Pl NE Unit 1 Salem, OR | 3.0 | 1.5 | 1250 | $1,775 | $1.42 | 44d | 1 | 1.21mi |
| 4373 Hearth St NE Salem, OR | 4.0 | 3.0 | 2152 | $3,195 | $1.48 | 23d | 1 | 1.26mi |
| 4370 Fisher Rd NE Unit 203 Salem, OR | 2.0 | 2.0 | 1092 | $1,545 | $1.41 | 14d | 1 | 1.30mi |
| 4185 Lancaster Dr NE Salem, OR | 3.0 | 2.5 | 1672 | $2,095 | $1.25 | 44d | 1 | 1.38mi |
| 4116 Lancaster Dr NE Unit 4116 Salem, OR | 2.0 | 1.5 | 1100 | $1,295 | $1.18 | 23d | 1 | 1.45mi |
| 4114 Lancaster Dr NE Unit 4114 Salem, OR | 2.0 | 1.5 | 1100 | $1,295 | $1.18 | 44d | 1 | 1.45mi |
Listing history 15 events
-
2026-06-18days on market $159,000 Active 210 DOM
-
2026-06-17days on market $159,000 Active 209 DOM
-
2026-06-16days on market $159,000 Active 208 DOM
-
2026-06-15days on market $159,000 Active 207 DOM
-
2026-06-14days on market $159,000 Active 205 DOM
-
2026-06-10days on market $159,000 Active 202 DOM
-
2026-06-09days on market $159,000 Active 201 DOM
-
2026-06-08days on market $159,000 Active 200 DOM
-
2026-06-07days on market $159,000 Active 199 DOM
-
2026-06-03days on market $159,000 Active 195 DOM
-
2026-06-02days on market $159,000 Active 194 DOM
-
2026-06-01days on market $159,000 Active 193 DOM
-
2026-05-31days on market $159,000 Active 192 DOM
-
2026-05-30days on market $159,000 Active 191 DOM
-
2025-11-20$159,000 Active 454-char remark
Show marketing remark (454 chars)
Hard to find 4 bedroom in an all family park! The one owner home features great room style living with a beautiful kitchen! Great Workspace plus and eating island, black appliances and a farm style stainless sink! Vaulted living and dining area. Laminate floors with carpet in the bedrooms. Separate utility room with cabinets. Double sinks in the large primary! This home sits on a nice lot with room to play! Water and sewer are added to the base rent.
ⓘ Source: listings_history table (triggers on properties + properties_extension) + one-shot
backfill from property_details.listing_events for pre-trigger history.
Tax reassessment forecast OR · Resets to sale price
- Current annual tax
- $1,746 · $145/mo
- Projected year-2 tax
- $1,746 · $145/mo
- Expected delta
- $0/yr ($0/mo · 0.0%)
ⓘ Screening estimate from a state-policy table — verify with the county assessor before closing.
Climate risk First Street
- Flood 1/10 Low FEMA zone X (unshaded) · 0% chance over 30 yrs
- Wildfire 2/10 Low
- Heat 4/10 Moderate 7 d/yr ≥92°F today · 15 d/yr by 30 yrs out
- Wind 1/10 Low
- Air quality 10/10 Extreme 13 unhealthy d/yr today · 14 by 30 yrs out
Nearby sold comps map
Loading sold comps map…
Walkable amenities ~0.75 mi
Loading nearby amenities…
Taxation est. · year 1
- Rental income
- $28,079
- − Mortgage interest
- −$8,906
- − Property taxes
- −$1,746
- − Insurance
- −$795
- − Repairs & maintenance
- −$2,246
- − Management
- −$2,246
- − Depreciation
- −$4,625
- Taxable income
- $7,513
- Est. tax owed @ 24.0%
- −$1,803
- After-tax cash flow
- $7,832/yr
For passive investors: Depreciation is non-cash, so a rental often shows a tax loss while cash-flowing — sheltering income. Rental losses are passive: they offset passive income freely, and up to $25,000/yr can offset ordinary (W-2) income if you actively participate and your MAGI is under $100k (phasing out to $0 by $150k); unused losses carry forward. On sale, claimed depreciation is recaptured at up to 25%, and gains may owe capital-gains tax (a 1031 exchange can defer both). Figures are a year-1 estimate at your 24.0% rate — not tax advice; consult a CPA.
Schools (NCES district)
- District
- Salem-Keizer SD 24J
- NCES district ID
- 4110820
- Math proficiency
- 34% ▼ -1.00%
- Reading proficiency
- 47% ▼ -2.00%
- Median HH income
- $48,632
- Composite
- 37.16/100
- National rank
- #9017
- State rank
- #103 of 183 in OR
Livability — Salem
- Score
- 79/100
- State rank
- #59
- US rank
- #2084
Category grades
Schools grade is shown separately in the Schools card above.
Census & demographics
- Census place
- Salem, OR
- City population
- 193,601
- Population (ZIP)
- 45,044
Population outlook (Marion County) Hauer SSP2
- Today (2025)
- 360,940 people
- By 2030
- 375,178 · +3.9%
- By 2040
- 400,914 · +11.1%
- By 2050
- 422,187 · +17.0%
- By 2075
- 460,305 · +27.5%
- By 2100
- 464,025 · +28.6%
Race, ethnicity, and origin ACS 2023
- Neighborhood character
- Diverse neighborhood (Simpson 0.61)
- Race & ethnicity
- Hispanic / Latino 44% White 44% Two or more races 16% Asian 3% Pacific Islander 3% Native American 3% Black 1%
- Hispanic origin (detail)
- Mexican 41%
- Common ancestry
- Italian 2% Slovak 2% Scotch-Irish 2%
- Foreign-born
- 23% · Canada, China
- Languages at home
- 57% English-only · Spanish 35% Other Asian/Pacific 3% Russian/Polish/Slavic 2%
Political lean MEDSL · Marion
- 2024 margin
- Toss-up / Even · D 47.5% · R 49.5% · Other 3.0%
- 2008→2024 swing
- -4.2pp toward R · 2008: 2.2pp · 2024: -2.0pp
- All cycles
- 2024: R+2.0 2020: D+1.1 2016: R+5.0 2012: R+3.5 2008: D+2.2
Not yet ingested
- Civics
- —
Market trends
- HPI YoY
- ▼ -328.50%
- Current HPI
- 296.3428
- Rent YoY
- —
- Metro
- —
- State GDP YoY
- ▲ 2.05%
- F500 in state
- 2
Industry mix (Fortune 500 HQ in OR)
| Industry | F500 HQs | Revenue |
|---|---|---|
| Consumer Goods | 1 | $51B |
|
||
Price history
1 event — show timeline
- 2025-11-20 Listed $159,000 RMLS
Property tax history
+16.5%/yrLatest (2020): $1,746 · +16.5% YoY. Source: county tax records.
Cash-flow waterfall
monthlySold comps — $/sqft
last 12 mo · ≤1 miLoading sold comps…