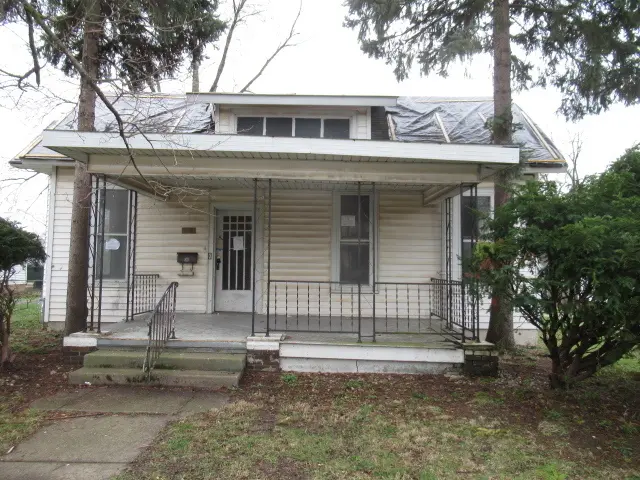
212 E Crawford St · Paris, IL
Flood risk 1/10 · Minimal
- FEMA flood zone
- X (unshaded)
- Chance of flooding over 30 yrs
- 0.0%
- Est. flood insurance / yr
- $473 – $860
Fire risk 1/10 · Minimal
- Est. fire insurance / yr
- $804 – $1,492
Heat risk 4/10 · Minor
- Hot days now (above 104°F)
- 7 days/yr
- Hot days in 30 yrs
- 19 days/yr
Wind risk 2/10 · Minimal
- Chance of severe wind over 30 yrs
- 1.0%
Air-quality risk 4/10 · Minor
- Unhealthy air days now
- 3 days/yr
- Unhealthy air days in 30 yrs
- 5 days/yr
Risk factors via First Street. Map © Google.
Why this score? — see what drove the B- grade
The composite is a weighted blend of 9 inputs, each scored 0–100. Each bar is that input's sub-score; the figure is the points it added to the 100-point composite (weight × sub-score).
- Cash flow +30.0/30.0
- 1% rule +10.0/10.0
- DSCR +10.0/10.0
- ARV discount +7.5/15.0
- Livability +3.6/5.0
- Schools +2.8/10.0
- Rent growth +2.5/5.0
- Condition / age +2.5/5.0
- Appreciation +0.0/10.0
$25,650
🖨 Deal sheet 📄 Offer letter ✓ Due diligence
Listing remarks MLS
Quaint cottage with welcoming front porch invites you to enter. A corner fireplace is the focal point of the living room. The spacious dining room a full corner of shelving with glass doors. It leads to the kitchen. Attractive glass front cabinets and an island add charm to the kitchen.
Key facts
- Front porch
- Glass front cabinets
- Island
Tags
Neighborhood map
What this means for you Summary
Snapshot
- This is a 2-bed/1.0-bath single-family listed at $26k.
Deal economics
- At list price, monthly cash flow is $593 ($7k/yr) — positive.
- The deal already cash-flows at list — no discount required.
- Meets the 1% rule at list price ($1k rent vs $26k).
- Recommended offer: $23k (9.0% below list) — sets the bar for market timing.
- Cap rate 34.1% vs local median 8.3% in Paris — top-decile yield for the area; either an underpriced asset or a hidden risk that comps aren't pricing in. Stress-test before assuming the spread holds.
Location & tenants
- Location reads 71/100 on livability (#342 in IL) — a middle-class / working-renter tenant base. Strengths: cost of living A+, housing A+, health & safety A+; Watch: employment D, crime F, amenities F.
- Paris-Union SD 95 (town): math 25% / reading 42% proficiency, ranked #227 of 620 in IL (top 37%) — families likely to look elsewhere, expect single-tenant / working-renter base with shorter leases.
- Market conditions: 82 active listings in the ZIP; 6 units permitted in Edgar County in 2024 (0 in 5+ unit buildings).
Forward outlook
- Local home prices are declining (-3.0%/yr); year-one equity from $178 of loan paydown is wiped out by about $770 of value loss. Plan a longer hold.
- Edgar County population projected at -30% by 2050 — secular population decline; favor cash flow + early exit over multi-decade hold.
- At projected returns (-3.0% appreciation + 3.0% rent growth), your $7k cash investment doubles in ~2 years — after that, you're playing with house money.
Negotiation context
- It's been on market 91 days — a 9% lower offer ($23k) is reasonable based on typical stale-listing flexibility.
Risks & watch-outs
- Watch-outs: property tax is 4.9% of price; built in 1905 — expect roof / HVAC / electrical / plumbing capex.
Questions for the listing agent
- It's been on market 91 days. Have you received any prior offers? Is the seller open to a 9% concession, seller financing, or rate buy-down credit?
- Built in 1905 — when were the roof, HVAC, electrical panel, plumbing, and water heater last replaced?
- Property tax is high relative to price — has the assessment been appealed recently, and will the sale trigger a re-assessment?
- Why hasn't it sold? Are there any deal-killer items the seller is aware of (foundation, flood, title, zoning, code violations)?
- Is there a deadline driving the sale (1031 exchange, divorce, estate, relocation)? That informs how much negotiation room exists.
- Crime grade is F in this area — have there been break-ins, vandalism, or insurance claims at this property in the last 3 years? What carrier currently insures it and at what premium?
- What's the average days-on-market for RENTAL listings here right now (not sales)? A rising rental-DOM trend means longer vacancies and softer asking-rent achievability than the comps imply.
- What's the recent tenant-quality profile in this submarket — average credit score on applications, eviction rate, late-payment / NSF rate, and stable-employment percentage? A property-management company in the area should have these aggregated.
- How much new for-sale + rental construction is in the pipeline within 1–3 miles? Heavy new supply typically softens prices + rents 12–24 months out; constrained supply supports both.
Investment metrics
- 1% rule
- 4.16% ✓
- Cap rate
- 34.06%
- Cash-on-cash
- 99.16%
- DSCR
- 5.41
- GRM
- 2.0
CMA / ARV
- ARV (median comp)
- $88,707
- List price
- $25,650
- Delta
- -71.08%
- Verdict
- UNDERPRICED
- Comps
- 20 within 1.0 mi
Show comp detail 12 sales within ~0.75 mi
| Address | Dist | Beds/Ba | Sqft | Sold | Price | $/sf | Match |
|---|---|---|---|---|---|---|---|
| 226 E Washington St | 0.18mi | 2/1.0 | 1,630 (+10%) | 12mo | $100,000 | $61 | 65 |
| 507 Alexander St | 0.41mi | 3/1.0 (+1) | 1,420 (-5%) | 8mo | $85,000 | $60 | 62 |
| 414 N Central Ave | 0.59mi | 2/1.0 | 1,438 (-3%) | 11mo | $70,000 | $49 | 58 |
| 308 E Adams St | 0.42mi | 2/1.0 | 1,326 (-11%) | 10mo | $86,000 | $65 | 54 |
| 5 Magnolia Mnr | 0.36mi | 3/2.0 (+1) | 1,646 (+11%) | 4mo | $136,000 | $83 | 53 |
| 305 W Crawford St | 0.35mi | 3/2.0 (+1) | 1,287 (-14%) | 2mo | $143,000 | $111 | 51 |
| 705 Hannah Ave | 0.28mi | 3/1.0 (+1) | 1,288 (-13%) | 11mo | $119,900 | $93 | 51 |
| 405 W Madison St | 0.43mi | 3/2.0 (+1) | 1,660 (+12%) | 3mo | $148,000 | $89 | 49 |
| 643 E Court St | 0.68mi | 2/1.0 | 1,313 (-12%) | 4mo | $150,000 | $114 | 45 |
| 104 N High St | 0.52mi | 3/1.5 (+1) | 1,624 (+9%) | 13mo | $137,500 | $85 | 43 |
| 507 W Washington St | 0.61mi | 3/1.0 (+1) | 1,607 (+8%) | 14mo | $30,000 | $19 | 42 |
| 302 S Jefferson St | 0.53mi | 3/1.5 (+1) | 1,640 (+10%) | 12mo | $149,900 | $91 | 41 |
Match score weights: distance 35% · size 25% · config 20% · recency 20%. Top-matched comps best support the ARV.
Projected returns pro-forma
-3.0% appreciation · 3.0% rent growth · sell at horizon
- IRR
- —
- Equity multiple
- 5.69×
- Total profit
- $33,701
- Equity at exit
- $3,824
- IRR
- —
- Equity multiple
- 11.90×
- Total profit
- $78,260
- Equity at exit
- $2,218
Cash invested: $7,182 (down + closing). Projections, not guarantees.
Landlord ↔ Tenant lean methodology
- Overall (STATE)
- 43 Moderately Tenant-Leaning
- State Illinois
- 43 Moderately Tenant-Leaning · D+7
- County
- — inherits STATE
- City
- — inherits STATE
ZIP-level market 61944
- Active inventory
- 82
- Price-to-rent
- 2.0×
Monthly cashflow live
- Estimated rent
- $1,066 medium interval (Pro) →
- Mortgage (P&I)
- −$135
- Tax from tax record
- −$104 /mo · $1,244/yr
- Insurance
- −$11
- HOA
- −$0
- Vacancy / Maint / Mgmt
- −$224
- Net cashflow
- $593
Break-even live
UW: 25.0% down · 7.5% · 30yr · 1.5% tax · 5.0% vac · 8.0% maint · 8.0% mgmt
Financing live
Cash to close
- Down payment
- $6,412
- Closing costs
- $770
- Reserves months
- —
- Total cash needed
- —
Loan-product check · same deal, 3 products live
Conventional
25% down · 7.5% · 30yr
- Down + closing
- —
- Monthly P&I
- —
- Monthly cashflow
- —
- DSCR
- —
- Eligible?
- —
Personal DTI + credit; lowest rate.
DSCR
20% down · 8.5% · 30yr
- Down + closing
- —
- Monthly P&I
- —
- Monthly cashflow
- —
- DSCR
- —
- Eligible?
- —
No personal income docs; deal must DSCR.
Hard money
10% down · 12.0% · 12mo
- Down + closing
- —
- Monthly P&I
- —
- Monthly cashflow
- —
- DSCR
- —
- Eligible?
- —
Short-term bridge; refi at stabilization.
Listing history 16 events
-
2026-06-15days on market $25,650 Active 91 DOM
-
2026-06-13days on market $25,650 Active 89 DOM
-
2026-06-12days on market $25,650 Active 88 DOM
-
2026-06-09days on market $25,650 Active 85 DOM
-
2026-06-08days on market $25,650 Active 84 DOM
-
2026-06-07days on market $25,650 Active 83 DOM
-
2026-06-07days on market $25,650 Active 82 DOM
-
2026-06-04days on market $25,650 Active 79 DOM
-
2026-06-02days on market $25,650 Active 78 DOM
-
2026-06-01days on market $25,650 Active 77 DOM
-
2026-05-31days on market $25,650 Active 76 DOM
-
2026-05-31days on market $25,650 Active 75 DOM
-
2026-04-30price $25,650 290-char remark
Show marketing remark (290 chars)
Quaint cottage with welcoming front porch invites you to enter. A corner fireplace is the focal point of the living room. The spacious dining room a full corner of shelving with glass doors. It leads to the kitchen. Attractive glass front cabinets and an island add charm to the kitchen.
-
2026-03-16$27,000 Active 290-char remark
Show marketing remark (290 chars)
Quaint cottage with welcoming front porch invites you to enter. A corner fireplace is the focal point of the living room. The spacious dining room a full corner of shelving with glass doors. It leads to the kitchen. Attractive glass front cabinets and an island add charm to the kitchen.
-
2009-05-13soldstatus $55,000
-
2008-08-19soldstatus $29,500
ⓘ Source: listings_history table (triggers on properties + properties_extension) + one-shot
backfill from property_details.listing_events for pre-trigger history.
Tax reassessment forecast IL · Partial reset (capped growth)
- Current annual tax
- $1,244 · $104/mo
- Projected year-2 tax
- $1,244 · $104/mo
- Expected delta
- $0/yr ($0/mo · 0.0%)
ⓘ Screening estimate from a state-policy table — verify with the county assessor before closing.
Climate risk First Street
- Flood 1/10 Low FEMA zone X (unshaded) · 0% chance over 30 yrs
- Wildfire 1/10 Low
- Heat 4/10 Moderate 7 d/yr ≥104°F today · 19 d/yr by 30 yrs out
- Wind 2/10 Low 100% chance of damaging wind over 30 yrs
- Air quality 4/10 Moderate 3 unhealthy d/yr today · 5 by 30 yrs out
Nearby sold comps map
Loading sold comps map…
Walkable amenities ~0.75 mi
Loading nearby amenities…
Taxation est. · year 1
- Rental income
- $12,795
- − Mortgage interest
- −$1,437
- − Property taxes
- −$1,244
- − Insurance
- −$128
- − Repairs & maintenance
- −$1,024
- − Management
- −$1,024
- − Depreciation
- −$746
- Taxable income
- $7,192
- Est. tax owed @ 24.0%
- −$1,726
- After-tax cash flow
- $5,395/yr
For passive investors: Depreciation is non-cash, so a rental often shows a tax loss while cash-flowing — sheltering income. Rental losses are passive: they offset passive income freely, and up to $25,000/yr can offset ordinary (W-2) income if you actively participate and your MAGI is under $100k (phasing out to $0 by $150k); unused losses carry forward. On sale, claimed depreciation is recaptured at up to 25%, and gains may owe capital-gains tax (a 1031 exchange can defer both). Figures are a year-1 estimate at your 24.0% rate — not tax advice; consult a CPA.
Schools (NCES district)
- District
- Paris-Union SD 95
- NCES district ID
- 1730750
- Math proficiency
- 25% ▼ -4.00%
- Reading proficiency
- 42% ▼ -7.00%
- Median HH income
- $36,294
- Composite
- 27.73/100
- National rank
- #6901
- State rank
- #227 of 620 in IL
Livability — Paris
- Score
- 71/100
- State rank
- #342
- US rank
- #6933
Category grades
Schools grade is shown separately in the Schools card above.
Census & demographics
- Census place
- Paris, IL
- City population
- 11,426
- Population (ZIP)
- 11,426
Population outlook (Edgar County) Hauer SSP2
- Today (2025)
- 15,960 people
- By 2030
- 14,978 · -6.2%
- By 2040
- 12,990 · -18.6%
- By 2050
- 11,087 · -30.5%
- By 2075
- 7,338 · -54.0%
- By 2100
- 4,526 · -71.6%
Race, ethnicity, and origin ACS 2023
- Neighborhood character
- Predominantly White (96%)
- Race & ethnicity
- White 96% Two or more races 3% Hispanic / Latino 1%
- Common ancestry
- Slovak 2% Serbian 2% Italian 1%
- Foreign-born
- 1%
- Languages at home
- 98% English-only · Spanish 1% Other Indo-European 1%
Political lean MEDSL · Edgar
- 2024 margin
- Solid R (+52.4) · D 23.0% · R 75.3% · Other 1.7%
- 2008→2024 swing
- -44.4pp toward R · 2008: -7.9pp · 2024: -52.4pp
- All cycles
- 2024: R+52.4 2020: R+52.5 2016: R+49.5 2012: R+32.8 2008: R+7.9
Not yet ingested
- Civics
- —
Market trends
- HPI YoY
- ▼ -66.48%
- Current HPI
- 108.1718
- Rent YoY
- —
- Metro
- —
- State GDP YoY
- ▲ 1.59%
- F500 in state
- 60
Industry mix (Fortune 500 HQ in IL)
| Industry | F500 HQs | Revenue |
|---|---|---|
| Insurance | 4 | $201B |
|
||
| Consumer Goods | 4 | $87B |
|
||
| Industrial Machinery | 3 | $64B |
|
||
| Healthcare | 2 | $55B |
|
||
| Retail / Pharmacy | 1 | $148B |
|
||
| Agriculture / Food | 1 | $86B |
|
||
Price history
-13.1% since first listed4 events — show timeline
- 2026-04-30 Price Changed $25,650 MRED as Distributed by MLS Grid
- 2026-03-16 Listed $27,000 MRED as Distributed by MLS Grid
- 2009-05-13 Sold (Public Records) $55,000 Public Records
- 2008-08-19 Sold (Public Records) $29,500 Public Records
Property tax history
+4.0%/yrLatest (2024): $1,244 · +24.5% YoY. Source: county tax records.
Cash-flow waterfall
monthlySold comps — $/sqft
last 12 mo · ≤1 miLoading sold comps…