3294 Bradbery Pl · Country Squire Lakes, IN
Flood risk 1/10 · Minimal
- FEMA flood zone
- X (unshaded)
- Chance of flooding over 30 yrs
- 0.0%
- Est. flood insurance / yr
- $507 – $1,088
Fire risk 1/10 · Minimal
- Est. fire insurance / yr
- $717 – $1,331
Heat risk 4/10 · Minor
- Hot days now (above 103°F)
- 7 days/yr
- Hot days in 30 yrs
- 19 days/yr
Wind risk 2/10 · Minimal
- Chance of severe wind over 30 yrs
- 1.0%
Air-quality risk 1/10 · Minimal
- Unhealthy air days now
- 0 days/yr
- Unhealthy air days in 30 yrs
- 0 days/yr
Risk factors via First Street. Map © Google.
Why this score? — see what drove the D+ grade
The composite is a weighted blend of 9 inputs, each scored 0–100. Each bar is that input's sub-score; the figure is the points it added to the 100-point composite (weight × sub-score).
- Cash flow +19.8/30.0
- ARV discount +7.5/15.0
- DSCR +6.3/10.0
- 1% rule +5.3/10.0
- Schools +3.0/10.0
- Livability +3.0/5.0
- Rent growth +2.5/5.0
- Condition / age +2.5/5.0
- Appreciation +0.0/10.0
$127,299
🖨 Deal sheet (PDF) 📄 Offer letter ✓ Due diligence
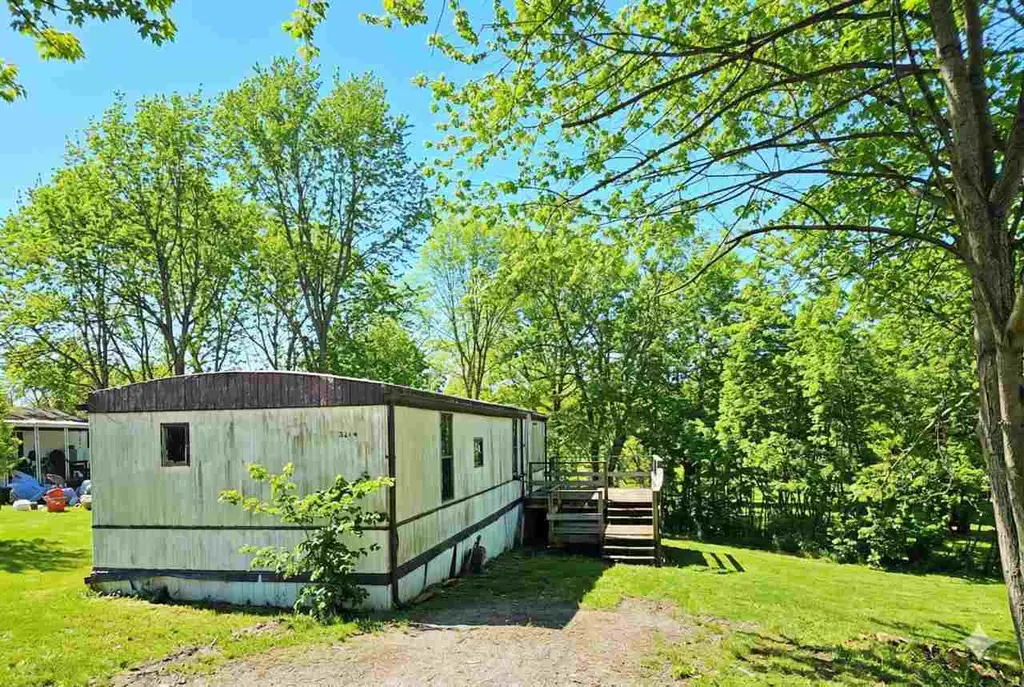
Listing remarks
SELLER FINANCING AVAILABLE! Discover the potential in this charming 2 bed, 2 bath fixer-upper nestled at 3294 Bradbury Place, North Vernon, IN. Boasting a spacious master suite, this home sits near a serene pond with breathtaking views, offering a perfect canvas for your creative touch. Sold as-is, it’s an ideal opportunity for those looking to transform a house into their dream home. Enjoy peaceful living with the beauty of nature right outside your door. Don’t miss this hidden gem—book a viewing today! Call Brian Ingle F. C. Tucker 765-960-0533.
Key facts
- Master suite
- Breathtaking views
- Serene pond
Tags
Property features AI
Finance
- Financial info: Annual tax amount approximately $100
Exterior
- Home design: Mobile home; Single-story
- Construction: Information not provided
- Exterior features: Zoned residential
Interior
- Bedrooms: Information not provided
- Bathrooms: 1 full bathroom
- Interior features: 5 total rooms
Neighborhood map
What this means for you Summary
Snapshot
- This is a 3-bed/1.0-bath manufactured listed at $127k.
Deal economics
- At list price, monthly cash flow is $152 ($2k/yr) — positive.
- The deal already cash-flows at list — no discount required.
- Meets the 1% rule at list price ($1k rent vs $127k).
- Recommended offer: $123k (3.0% below list) — sets the bar for market timing.
- Cap rate 7.7% vs local median 6.0% in Country Squire Lakes — meaningfully above typical; check what's discounted (condition, days-on-market, listing class) to confirm the premium yield is real.
Location & tenants
- Location reads 59/100 on livability (#566 in IN) — a working-class tenant base; expect higher turnover. Strengths: cost of living A+, housing A+, crime A-; Watch: health & safety D, amenities F, commute F.
- Jennings County School Corporation (rural): math 32% / reading 38% proficiency, ranked #194 of 301 in IN (top 64%) — families likely to look elsewhere, expect single-tenant / working-renter base with shorter leases.
- Zoned schools: Sand Creek Elementary School (math 33% / reading 29%, grade F, #682 of 994 statewide, top 69%, 389 students, 85% FRL); Jennings County Middle School (math 28% / reading 36%, grade F, #190 of 330 statewide, top 59%, 626 students, 62% FRL); Jennings County High School (math 26% / reading 62%, grade F, #189 of 369 statewide, top 51%, 1,184 students, 52% FRL) — zoned schools average 66% FRL vs 49% district-wide (18 pts higher); higher-poverty schools than district average — tighter screening recommended.
- Market conditions: 160 active listings in the ZIP; 84 units permitted in Jennings County in 2024 (0 in 5+ unit buildings).
Forward outlook
- Local home prices are declining (-3.0%/yr); year-one equity from $880 of loan paydown is wiped out by about $4k of value loss. Plan a longer hold.
- Jennings County population projected at -21% by 2050 — secular population decline; favor cash flow + early exit over multi-decade hold.
Negotiation context
- It's been on market 46 days — a 3% lower offer ($123k) is reasonable based on typical stale-listing flexibility.
Questions for the listing agent
- It's been on market 46 days. Have you received any prior offers? Is the seller open to a 3% concession, seller financing, or rate buy-down credit?
- Is there a deadline driving the sale (1031 exchange, divorce, estate, relocation)? That informs how much negotiation room exists.
- Schools are F-rated, which usually means shorter tenancies and higher turnover. Who's the typical renter profile here, and what's been the actual vacancy rate?
- The area grade is low — what's the realistic commute time and amenity access for the typical tenant pool here? Any planned neighborhood developments (good or bad) we should know about?
- What's the average days-on-market for RENTAL listings here right now (not sales)? A rising rental-DOM trend means longer vacancies and softer asking-rent achievability than the comps imply.
- What's the recent tenant-quality profile in this submarket — average credit score on applications, eviction rate, late-payment / NSF rate, and stable-employment percentage? A property-management company in the area should have these aggregated.
- How much new for-sale + rental construction is in the pipeline within 1–3 miles? Heavy new supply typically softens prices + rents 12–24 months out; constrained supply supports both.
Investment metrics
- 1% rule
- 1.03% ✓
- Cap rate
- 7.72%
- Cash-on-cash
- 5.10%
- DSCR
- 1.23
- GRM
- 8.1
CMA / ARV
- ARV (median comp)
- $65,374
- List price
- $127,299
- Delta
- 94.72%
- Verdict
- OVERPRICED
- Comps
- 3 within 2.0 mi
Show comp detail 2 sales within ~0.75 mi
| Address | Dist | Beds/Ba | Sqft | Sold | Price | $/sf | Match |
|---|---|---|---|---|---|---|---|
| 3503 Penny Ln | 0.53mi | 2/2.0 (-1) | 952 (+13%) | 12mo | $55,000 | $58 | 34 |
| 2171 Saxon Ct | 0.64mi | 2/1.0 (-1) | 756 (-10%) | 20mo | $40,000 | $53 | 32 |
Match score weights: distance 35% · size 25% · config 20% · recency 20%. Top-matched comps best support the ARV.
Projected returns pro-forma
-3.0% appreciation · 3.0% rent growth · sell at horizon
- IRR
- -8.4%
- Equity multiple
- 0.69×
- Total profit
- $-10,953
- Equity at exit
- $18,981
- IRR
- 1.2%
- Equity multiple
- 1.08×
- Total profit
- $2,975
- Equity at exit
- $11,006
Cash invested: $35,644 (down + closing). Projections, not guarantees.
Landlord ↔ Tenant lean methodology
- Overall (STATE)
- 90 Strongly Landlord-Friendly
- State Indiana
- 90 Strongly Landlord-Friendly · R+11
- County
- — inherits STATE
- City
- — inherits STATE
ZIP-level market 47265
- Home prices YoY
- -31.5%
- Active inventory
- 160
- Price-to-rent
- 8.1×
Monthly cashflow live
- Estimated rent
- $1,305 medium interval (Pro) →
- Mortgage (P&I)
- −$668
- Tax est. 1.5%
- −$159 /mo · $1,909/yr
- Insurance
- −$53
- HOA
- −$0
- Vacancy / Maint / Mgmt
- −$274
- Net cashflow
- $152
Break-even live
Sensitivity live
| Price | -10% $240 | -5% $196 | +0% $152 | +5% $108 | +10% $64 |
|---|---|---|---|---|---|
| Rent | -10% $48 | -5% $100 | +0% $152 | +5% $203 | +10% $255 |
| Rate | -1.0pp $216 | -0.5pp $184 | base $152 | +0.5pp $119 | +1.0pp $85 |
UW: 25.0% down · 7.5% · 30yr · 1.5% tax · 5.0% vac · 8.0% maint · 8.0% mgmt
Financing live
Cash to close
- Down payment
- $31,825
- Closing costs
- $3,819
- Reserves months
- —
- Total cash needed
- —
Loan-product check · same deal, 3 products live
Conventional
25% down · 7.5% · 30yr
- Down + closing
- —
- Monthly P&I
- —
- Monthly cashflow
- —
- DSCR
- —
- Eligible?
- —
Personal DTI + credit; lowest rate.
DSCR
20% down · 8.5% · 30yr
- Down + closing
- —
- Monthly P&I
- —
- Monthly cashflow
- —
- DSCR
- —
- Eligible?
- —
No personal income docs; deal must DSCR.
Hard money
10% down · 12.0% · 12mo
- Down + closing
- —
- Monthly P&I
- —
- Monthly cashflow
- —
- DSCR
- —
- Eligible?
- —
Short-term bridge; refi at stabilization.
Listing history 17 events
-
2026-06-19days on market $127,299 Active 46 DOM
-
2026-06-18days on market $127,299 Active 45 DOM
-
2026-06-17days on market $127,299 Active 44 DOM
-
2026-06-16days on market $127,299 Active 43 DOM
-
2026-06-15days on market $127,299 Active 42 DOM
-
2026-06-14days on market $127,299 Active 40 DOM
-
2026-06-12days on market $127,299 Active 39 DOM
-
2026-06-09days on market $127,299 Active 36 DOM
-
2026-06-08days on market $127,299 Active 35 DOM
-
2026-06-07days on market $127,299 Active 34 DOM
-
2026-06-02days on market $127,299 Active 29 DOM
-
2026-06-01days on market $127,299 Active 28 DOM
-
2026-05-31days on market $127,299 Active 27 DOM
-
2026-05-30days on market $127,299 Active 26 DOM
-
2026-05-04$127,299 Active 571-char remark
-
2025-11-18price $127,299
-
2025-10-01price $127,300
ⓘ Source: listings_history table (triggers on properties + properties_extension) + one-shot
backfill from property_details.listing_events for pre-trigger history.
Climate risk First Street
- Flood 1/10 Low FEMA zone X (unshaded) · 0% chance over 30 yrs
- Wildfire 1/10 Low
- Heat 4/10 Moderate 7 d/yr ≥103°F today · 19 d/yr by 30 yrs out
- Wind 2/10 Low 100% chance of damaging wind over 30 yrs
- Air quality 1/10 Low 0 unhealthy d/yr today · 0 by 30 yrs out
Nearby sold comps map
Loading sold comps map…
Walkable amenities ~0.75 mi
Loading nearby amenities…
Taxation est. · year 1
- Rental income
- $15,666
- − Mortgage interest
- −$7,131
- − Property taxes
- −$1,909
- − Insurance
- −$636
- − Repairs & maintenance
- −$1,253
- − Management
- −$1,253
- − Depreciation
- −$3,703
- Taxable loss
- −$221
- Est. tax savings @ 24.0%
- +$53
- After-tax cash flow
- $1,872/yr
For passive investors: Depreciation is non-cash, so a rental often shows a tax loss while cash-flowing — sheltering income. Rental losses are passive: they offset passive income freely, and up to $25,000/yr can offset ordinary (W-2) income if you actively participate and your MAGI is under $100k (phasing out to $0 by $150k); unused losses carry forward. On sale, claimed depreciation is recaptured at up to 25%, and gains may owe capital-gains tax (a 1031 exchange can defer both). Figures are a year-1 estimate at your 24.0% rate — not tax advice; consult a CPA.
Schools (NCES district)
- District
- Jennings County School Corporation
- NCES district ID
- 1805190
- Math proficiency
- 32% ▼ -11.00%
- Reading proficiency
- 38% ▼ -6.00%
- Median HH income
- $45,418
- Composite
- 29.89/100
- National rank
- #6394
- State rank
- #194 of 301 in IN
Livability — Country Squire Lakes
- Score
- 59/100
- State rank
- #566
- US rank
- #20238
Category grades
Schools grade is shown separately in the Schools card above.
Census & demographics
- Census place
- Country Squire Lakes, IN
- Population (ZIP)
- 20,981
Population outlook (Jennings County) Hauer SSP2
- Today (2025)
- 26,584 people
- By 2030
- 25,591 · -3.7%
- By 2040
- 23,423 · -11.9%
- By 2050
- 20,973 · -21.1%
- By 2075
- 15,445 · -41.9%
- By 2100
- 10,714 · -59.7%
Race, ethnicity, and origin ACS 2023
- Neighborhood character
- Predominantly White (92%)
- Race & ethnicity
- White 92% Hispanic / Latino 4% Two or more races 3%
- Common ancestry
- Slovak 2% Romanian 1% Italian 1%
- Foreign-born
- 1% · Canada
- Languages at home
- 96% English-only · Spanish 2% German/W. Germanic 1%
Political lean MEDSL · Jennings
- 2024 margin
- Solid R (+58.8) · D 19.7% · R 78.5% · Other 1.8%
- 2008→2024 swing
- -50.8pp toward R · 2008: -8.0pp · 2024: -58.8pp
- All cycles
- 2024: R+58.8 2020: R+56.9 2016: R+52.7 2012: R+22.4 2008: R+8.0
Not yet ingested
- Civics
- —
Market trends
- HPI YoY
- ▼ -107.36%
- Current HPI
- 233.0275
- Rent YoY
- —
- Metro
- —
- State GDP YoY
- ▲ 2.90%
- F500 in state
- 18
Industry mix (Fortune 500 HQ in IN)
| Industry | F500 HQs | Revenue |
|---|---|---|
| Industrial Machinery | 2 | $37B |
|
||
| Healthcare | 1 | $177B |
|
||
| Pharmaceuticals | 1 | $45B |
|
||
| Metals / Steel | 1 | $18B |
|
||
| Agriculture | 1 | $17B |
|
||
| Packaging | 1 | $12B |
|
||
Price history
-0.0% since first listed3 events — show timeline
- 2026-05-04 Listed $127,299 RRELMS
- 2025-11-18 Price Changed $127,299 RRELMS
- 2025-10-01 Price Changed $127,300 RRELMS
Property tax history
+2.6%/yrLatest (2024): $142 · +42.9% YoY. Source: county tax records.
Cash-flow waterfall
monthlySold comps — $/sqft
last 12 mo · ≤1 miLoading sold comps…