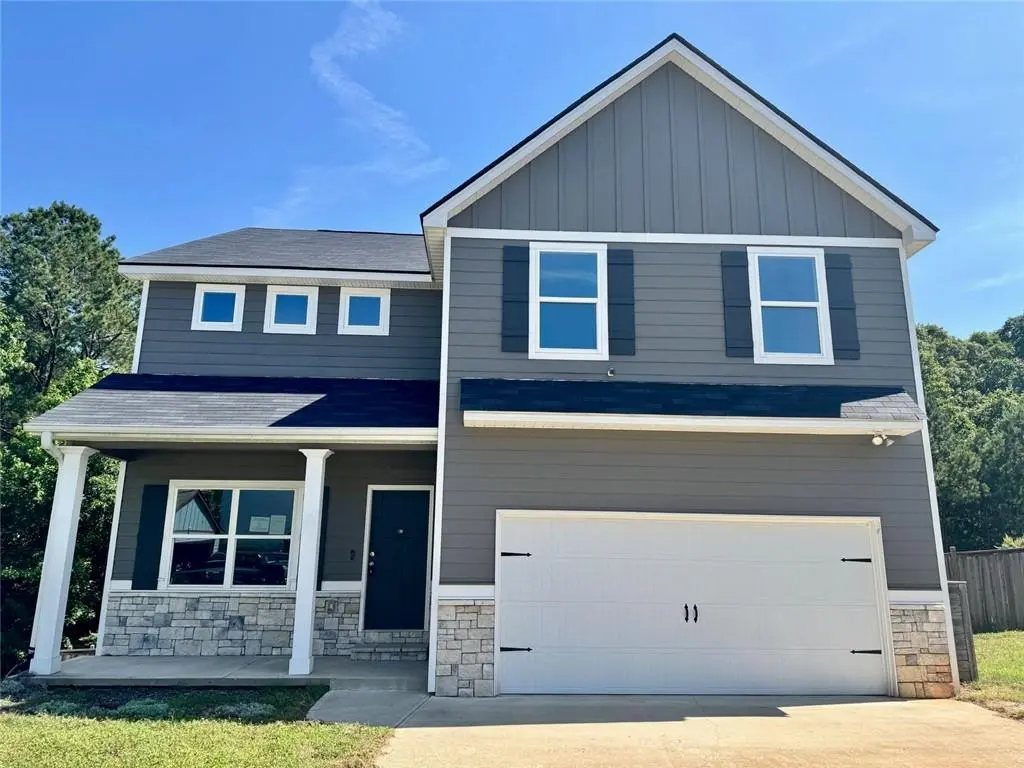
415 Splash Pointe · Temple, GA
Flood risk 1/10 · Minimal
- FEMA flood zone
- X (unshaded)
- Chance of flooding over 30 yrs
- 0.0%
- Est. flood insurance / yr
- $507 – $1,088
Fire risk 3/10 · Minor
- Est. fire insurance / yr
- $963 – $1,789
Heat risk 4/10 · Minor
- Hot days now (above 102°F)
- 7 days/yr
- Hot days in 30 yrs
- 17 days/yr
Wind risk 5/10 · Moderate
- Chance of severe wind over 30 yrs
- 25.0%
Air-quality risk 3/10 · Minor
- Unhealthy air days now
- 3 days/yr
- Unhealthy air days in 30 yrs
- 4 days/yr
Risk factors via First Street. Map © Google.
Why this score? — see what drove the D grade
The composite is a weighted blend of 9 inputs, each scored 0–100. Each bar is that input's sub-score; the figure is the points it added to the 100-point composite (weight × sub-score).
- Appreciation +10.0/10.0
- ARV discount +8.4/15.0
- Cash flow +7.7/30.0
- Schools +3.6/10.0
- Livability +3.6/5.0
- Rent growth +2.5/5.0
- Condition / age +2.5/5.0
- 1% rule +1.9/10.0
- DSCR +1.8/10.0
$327,000
🖨 Deal sheet (PDF) 📄 Offer letter ✓ Due diligence
Listing remarks
HUD asset #106-452442, managed by A-Team Realty and marketed by Real South Realty, is a spacious four-bedroom, two-and-a-half-bath, two-story home situated on a cul-de-sac lot. The kitchen and living room are open and just right for entertaining. A separate dining room and a half-bath complete the downstairs. Upstairs, you will find the oversized master suite, three additional bedrooms, and a bathroom. For added convenience, the laundry room is located on this level. There are endless possibilities in the unfinished basement that is already stubbed for an additional bathroom. The back deck and privacy fence provide the perfect setting for relaxing. This home is in FHA Insured status and qua
Key facts
- Cul-de-sac lot
- Separate dining room
- Unfinished basement
Tags
Property features AI
Exterior
- Parking: Detached garage with 2 spaces; Total of 2 parking spaces
- Utilities: Public water; Public sewer; Electricity available; Cable available; Underground utilities; Other electric service
- Home design: Two levels; Basement (full, unfinished, daylight, walk-out access, bath stubbed)
- Construction: HardiPlank-type and stone exterior; Shingle/composition roof; Slab foundation; Resale property
- Exterior features: Front porch; Deck; Privacy fencing; Other exterior features
Interior
- Kitchen: Pantry (walk-in); Solid surface counters; Open view to family room; Dishwasher; Electric range; Microwave
- Bedrooms: Four bedrooms on the upper level; Oversized master
- Flooring: Tile; Carpet; Luxury vinyl
- Bathrooms: Two full bathrooms; One half bathroom; Master bath with double vanity and separate tub and shower
- Heating & cooling: Central heating; Central air
- Interior features: Double vanity; Recessed lighting; Walk-in closets; Shutters; No common walls
- Laundry & utility: Laundry room located in hall; Electric water heater
Neighborhood map
What this means for you Summary
Snapshot
- This is a 4-bed/3.5-bath single-family listed at $327k.
Deal economics
- At list price, monthly cash flow is $-384 ($-5k/yr) — negative.
- To cash-flow at today's rent, offer at most $259k (20.7% below list).
- To meet the 1% rule (rent ≥ 1% of price), the offer needs to be $226k (30.8% below list).
- Recommended offer: $226k (30.8% below list) — sets the bar for 1% rule.
Location & tenants
- Location reads 72/100 on livability (#60 in GA) — a middle-class / working-renter tenant base. Strengths: crime A+, cost of living A+, housing A+; Watch: amenities F, commute F.
- Carroll County (rural): math 42% / reading 41% proficiency, ranked #38 of 174 in GA (top 22%) — families likely to look elsewhere, expect single-tenant / working-renter base with shorter leases.
- Zoned schools: Providence Elementary School (math 40% / reading 35%, grade F, #474 of 1,228 statewide, top 39%, 528 students, 56% FRL); Temple Middle School (math 31% / reading 36%, grade F, #206 of 470 statewide, top 45%, 621 students, 67% FRL); Temple High School (math 22% / reading 22%, grade F, #213 of 424 statewide, top 51%, 746 students, 62% FRL).
- Market conditions: 191 active listings in the ZIP; 9 comparable units currently listed for rent nearby; rentals at typical pace (median 22d on market — plan ~3-4 weeks tenant-placement turnaround); solid renter incomes; 876 units permitted in Carroll County in 2024 (150 in 5+ unit buildings).
- This rent runs 35% of the median local income ($77k/yr) — at the standard rent-burdened threshold; future hikes will face affordability resistance.
Forward outlook
- In year one you build about $35k of equity ($2k loan paydown + $33k appreciation (10.0% local appreciation)).
- Carroll County population projected at +12% by 2050 — modest demand growth; plan on rents tracking national, not racing it.
- By year 2, paydown + projected appreciation supports a ~$56k cash-out refi (75% LTV) — recoverable capital for the next deal without selling this one.
Negotiation context
- Only 13 days on market — expect competitive offers; lowballing is unlikely to land.
- 15 sale attempts since 4y ago with the ask held roughly flat each time — persistent listings suggest the price (not the market) is what's stuck; bring a comps-based counter.
Risks & watch-outs
- Climate carrying-cost: moderate wind risk, 25% chance of damaging wind over 30y — expect insurance premiums to compound above CPI over the hold.
Questions for the listing agent
- What do current leases actually rent for vs. the listed asking? Can we see a recent rent roll and the last 12 months of T-12 income?
- Is there a deadline driving the sale (1031 exchange, divorce, estate, relocation)? That informs how much negotiation room exists.
- Schools are D-rated, which usually means shorter tenancies and higher turnover. Who's the typical renter profile here, and what's been the actual vacancy rate?
- The area grade is low — what's the realistic commute time and amenity access for the typical tenant pool here? Any planned neighborhood developments (good or bad) we should know about?
- What's the average days-on-market for RENTAL listings here right now (not sales)? A rising rental-DOM trend means longer vacancies and softer asking-rent achievability than the comps imply.
- What's the recent tenant-quality profile in this submarket — average credit score on applications, eviction rate, late-payment / NSF rate, and stable-employment percentage? A property-management company in the area should have these aggregated.
- How much new for-sale + rental construction is in the pipeline within 1–3 miles? Heavy new supply typically softens prices + rents 12–24 months out; constrained supply supports both.
Investment metrics
- 1% rule
- 0.69% ✗
- Cap rate
- 4.89%
- Cash-on-cash
- -5.03%
- DSCR
- 0.78
- GRM
- 12.0
CMA / ARV
- ARV (on-the-fly)
- $333,984
- Comps found
- 12
Show comp detail 12 sales within ~0.75 mi
| Address | Dist | Beds/Ba | Sqft | Sold | Price | $/sf | Match |
|---|---|---|---|---|---|---|---|
| 167 Waters Edge Pkwy | 0.12mi | 4/2.5 | 2,257 (-4%) | 4mo | $317,000 | $140 | 80 |
| 248 Waters Edge Pkwy | 0.20mi | 4/2.5 | 2,290 (-3%) | 6mo | $324,900 | $142 | 78 |
| 238 James Allen Pl | 0.21mi | 4/2.0 | 2,576 (+10%) | 1mo | $320,000 | $124 | 68 |
| 105 Maplewood Dr | 0.26mi | 4/3.0 | 2,596 (+10%) | 5mo | $310,000 | $119 | 64 |
| 107 Deer Xing Lot 88 | 0.36mi | 4/2.5 | 2,204 (-6%) | 7mo | $292,900 | $133 | 63 |
| 171 Ivey Lake Pkwy | 0.19mi | 4/3.0 | 2,059 (-12%) | 7mo | $313,400 | $152 | 62 |
| 284 Ivey Lake Pkwy | 0.36mi | 4/2.0 | 2,227 (-5%) | 7mo | $335,000 | $150 | 62 |
| 408 Nottely Dr | 0.59mi | 5/3.0 (+1) | 2,463 (+5%) | 2mo | $343,000 | $139 | 56 |
| 121 Creek Crossing Ln | 0.42mi | 3/3.0 (-1) | 2,187 (-7%) | 8mo | $340,000 | $155 | 55 |
| 102 Streambank Ct | 0.54mi | 4/2.5 | 2,091 (-11%) | 4mo | $341,000 | $163 | 48 |
| 435 Nottely Dr | 0.51mi | 4/2.5 | 2,053 (-13%) | 8mo | $319,900 | $156 | 44 |
| 161 E 78 Hwy | 0.72mi | 3/2.0 (-1) | 2,691 (+14%) | 4mo | $270,000 | $100 | 28 |
Match score weights: distance 35% · size 25% · config 20% · recency 20%. Top-matched comps best support the ARV.
Projected returns pro-forma
10.0% appreciation · 3.0% rent growth · sell at horizon
- IRR
- 20.7%
- Equity multiple
- 2.68×
- Total profit
- $153,646
- Equity at exit
- $294,588
- IRR
- 18.8%
- Equity multiple
- 6.15×
- Total profit
- $471,631
- Equity at exit
- $635,289
Cash invested: $91,560 (down + closing). Projections, not guarantees.
Landlord ↔ Tenant lean methodology
- Overall (STATE)
- 90 Strongly Landlord-Friendly
- State Georgia
- 90 Strongly Landlord-Friendly · R+3
- County
- — inherits STATE
- City
- — inherits STATE
ZIP-level market 30179
- Home prices YoY
- 6.7%
- Active inventory
- 191
- Price-to-rent
- 12.0×
Monthly cashflow live
- Estimated rent
- $2,263 high interval (Pro) →
- Mortgage (P&I)
- −$1,715
- Tax from tax record
- −$320 /mo · $3,842/yr
- Insurance
- −$136
- HOA
- −$0
- Vacancy / Maint / Mgmt
- −$475
- Net cashflow
- $-384
Break-even live
Sensitivity live
| Price | -10% $-198 | -5% $-291 | +0% $-384 | +5% $-476 | +10% $-569 |
|---|---|---|---|---|---|
| Rent | -10% $-562 | -5% $-473 | +0% $-384 | +5% $-294 | +10% $-205 |
| Rate | -1.0pp $-219 | -0.5pp $-300 | base $-384 | +0.5pp $-468 | +1.0pp $-554 |
UW: 25.0% down · 7.5% · 30yr · 1.5% tax · 5.0% vac · 8.0% maint · 8.0% mgmt
Financing live
Cash to close
- Down payment
- $81,750
- Closing costs
- $9,810
- Reserves months
- —
- Total cash needed
- —
Loan-product check · same deal, 3 products live
Conventional
25% down · 7.5% · 30yr
- Down + closing
- —
- Monthly P&I
- —
- Monthly cashflow
- —
- DSCR
- —
- Eligible?
- —
Personal DTI + credit; lowest rate.
DSCR
20% down · 8.5% · 30yr
- Down + closing
- —
- Monthly P&I
- —
- Monthly cashflow
- —
- DSCR
- —
- Eligible?
- —
No personal income docs; deal must DSCR.
Hard money
10% down · 12.0% · 12mo
- Down + closing
- —
- Monthly P&I
- —
- Monthly cashflow
- —
- DSCR
- —
- Eligible?
- —
Short-term bridge; refi at stabilization.
Rent comps 9 comps
| Address | Beds | Baths | Sqft | Rent | $/sqft | DOM | Units | Dist |
|---|---|---|---|---|---|---|---|---|
| 142 Waters Edge Pkwy Temple, GA | 4.0 | 2.5 | 2185 | $1,999 | $0.91 | 45d | 1 | 0.04mi |
| 215 Waters Edge Pkwy Temple, GA | 4.0 | 2.5 | 2290 | $2,099 | $0.92 | 26d | 1 | 0.14mi |
| 280 Ivey Lake Pkwy Temple, GA | 4.0 | 2.5 | 2210 | $2,100 | $0.95 | 45d | 1 | 0.37mi |
| 321 Sue Ct Temple, GA | 4.0 | 3.0 | 1621 | $2,111 | $1.30 | 14d | 1 | 0.39mi |
| 116 Arborwood Way Temple, GA | 3.0 | 2.0 | 1782 | $1,905 | $1.07 | 14d | 1 | 0.56mi |
| 261 Stagecoach Pass Temple, GA | 3.0 | 2.0 | 2205 | $1,779 | $0.81 | 45d | 1 | 0.83mi |
| 121 Breckenridge Pt Temple, GA | 3.0 | 2.0 | 1687 | $1,800 | $1.07 | 21d | 1 | 1.01mi |
| 269 Villa Rosa Way Temple, GA | 3.0 | 2.0 | 1664 | $1,925 | $1.16 | 3d | 1 | 1.34mi |
| 273 Patriot Dr Temple, GA | 3.0 | 2.0 | 1720 | $2,100 | $1.22 | 14d | 1 | 1.48mi |
Listing history 8 events
-
2026-06-21days on market $327,000 Active 13 DOM
-
2026-06-18days on market $327,000 Active 10 DOM
-
2026-06-17days on market $327,000 Active 9 DOM
-
2026-06-16days on market $327,000 Active 8 DOM
-
2026-06-15days on market $327,000 Active 7 DOM
-
2026-06-13days on market $327,000 Active 5 DOM
-
2026-06-09remarks 699-char remark
-
2026-06-09$327,000 Active 1 DOM
ⓘ Source: listings_history table (triggers on properties + properties_extension) + one-shot
backfill from property_details.listing_events for pre-trigger history.
Tax reassessment forecast GA · Resets to sale price
- Current annual tax
- $3,842 · $320/mo
- Projected year-2 tax
- $3,842 · $320/mo
- Expected delta
- $0/yr ($0/mo · -0.0%)
ⓘ Screening estimate from a state-policy table — verify with the county assessor before closing.
Climate risk First Street
- Flood 1/10 Low FEMA zone X (unshaded) · 0% chance over 30 yrs
- Wildfire 3/10 Moderate
- Heat 4/10 Moderate 7 d/yr ≥102°F today · 17 d/yr by 30 yrs out
- Wind 5/10 Major 25% chance of damaging wind over 30 yrs
- Air quality 3/10 Moderate 3 unhealthy d/yr today · 4 by 30 yrs out
Nearby sold comps map
Loading sold comps map…
Walkable amenities ~0.75 mi
Loading nearby amenities…
Taxation est. · year 1
- Rental income
- $27,156
- − Mortgage interest
- −$18,317
- − Property taxes
- −$3,842
- − Insurance
- −$1,635
- − Repairs & maintenance
- −$2,172
- − Management
- −$2,172
- − Depreciation
- −$9,513
- Taxable loss
- −$10,496
- Est. tax savings @ 24.0%
- +$2,519
- After-tax cash flow
- $-2,083/yr
For passive investors: Depreciation is non-cash, so a rental often shows a tax loss while cash-flowing — sheltering income. Rental losses are passive: they offset passive income freely, and up to $25,000/yr can offset ordinary (W-2) income if you actively participate and your MAGI is under $100k (phasing out to $0 by $150k); unused losses carry forward. On sale, claimed depreciation is recaptured at up to 25%, and gains may owe capital-gains tax (a 1031 exchange can defer both). Figures are a year-1 estimate at your 24.0% rate — not tax advice; consult a CPA.
Schools (NCES district)
- District
- Carroll County
- NCES district ID
- 1300840
- Math proficiency
- 42% ▼ -7.00%
- Reading proficiency
- 41% ▼ -8.00%
- Median HH income
- $48,692
- Composite
- 35.62/100
- National rank
- #4888
- State rank
- #38 of 174 in GA
Livability — Temple
- Score
- 72/100
- State rank
- #60
- US rank
- #5802
Category grades
Schools grade is shown separately in the Schools card above.
Census & demographics
- Census place
- Temple, GA
- County
- Carroll County · 124,888 people
- City population
- 19,882
- Metro
- Atlanta-Sandy Springs-Alpharetta, GA
- Population (ZIP)
- 19,882
- Household income
- $76,571
- Rent vs Own
- Severe rent burden
- 396.0
Population outlook (Carroll County) Hauer SSP2
- Today (2025)
- 123,370 people
- By 2030
- 127,186 · +3.1%
- By 2040
- 133,534 · +8.2%
- By 2050
- 137,612 · +11.5%
- By 2075
- 142,892 · +15.8%
- By 2100
- 136,294 · +10.5%
Race, ethnicity, and origin ACS 2023
- Neighborhood character
- Predominantly White (77%)
- Race & ethnicity
- White 77% Black 15% Hispanic / Latino 5% Two or more races 4%
- Common ancestry
- Italian 1% Lithuanian 1% Serbian 1%
- Foreign-born
- 4% · Canada
- Languages at home
- 95% English-only · Spanish 4%
Political lean MEDSL · Carroll
- 2024 margin
- Solid R (+41.2) · D 29.1% · R 70.3%
- 2008→2024 swing
- -8.2pp toward R · 2008: -32.9pp · 2024: -41.2pp
- All cycles
- 2024: R+41.2 2020: R+39.0 2016: R+40.1 2012: R+37.7 2008: R+32.9
Not yet ingested
- Civics
- —
Market trends
- HPI YoY
- ▲ 27.16%
- Current HPI
- 435.3863
- Rent YoY
- —
- Metro
- Atlanta-Sandy Springs-Alpharetta, GA
- State GDP YoY
- ▲ 2.66%
- F500 in state
- 28
Industry mix (Fortune 500 HQ in GA)
| Industry | F500 HQs | Revenue |
|---|---|---|
| Paper / Packaging | 2 | $29B |
|
||
| Retail | 1 | $160B |
|
||
| Transportation / Logistics | 1 | $91B |
|
||
| Airlines | 1 | $62B |
|
||
| Consumer Goods | 1 | $47B |
|
||
| Utilities | 1 | $25B |
|
||
Price history
-3.8% since first listed42 events — show timeline
- 2026-06-06 Listed $327,000 FMLS
- 2025-07-31 Listing Removed — GAMLS
- 2025-07-31 Listing Removed — FMLS
- 2025-06-06 Relisted — GAMLS
- 2025-06-06 Price Changed $324,000 GAMLS
- 2025-06-06 Price Changed $324,000 FMLS
- 2025-05-31 Listing Removed — GAMLS
- 2025-05-22 Relisted — GAMLS
- 2025-05-22 Price Changed $325,000 GAMLS
- 2025-05-22 Price Changed $325,000 FMLS
- 2025-05-16 Listing Removed — GAMLS
- 2025-05-13 Price Changed $329,000 GAMLS
- 2025-05-13 Price Changed $329,000 FMLS
- 2025-05-07 Price Changed $330,000 FMLS
- 2025-05-07 Price Changed $330,000 GAMLS
- 2025-05-07 Relisted — FMLS
- 2025-05-06 Relisted — GAMLS
- 2025-05-06 Pending — FMLS
- 2025-05-06 Price Changed $350,000 GAMLS
- 2025-05-06 Price Changed $350,000 FMLS
- 2025-04-18 Listing Removed — GAMLS
- 2025-03-22 Relisted — FMLS
- 2025-03-05 Listed $330,000 GAMLS
- 2025-02-21 Listing Removed — GAMLS
- 2025-02-06 Relisted — FMLS
- 2025-02-06 Price Changed $330,000 GAMLS
- 2025-02-06 Price Changed $330,000 FMLS
- 2025-01-31 Listing Removed — FMLS
- 2024-12-10 Relisted — GAMLS
- 2024-11-21 Listing Removed — GAMLS
- 2024-11-15 Relisted — FMLS
- 2024-11-14 Listing Removed — FMLS
- 2024-09-19 Listed $359,900 GAMLS
- 2024-09-19 Listed $359,900 FMLS
- 2022-09-30 Sold (MLS) $342,914 GAMLS
- 2022-09-30 Sold (MLS) $342,914 FMLS
- 2022-09-06 Pending — GAMLS
- 2022-09-06 Pending — FMLS
- 2022-08-10 Listed $342,914 GAMLS
- 2022-08-10 Listed $342,914 FMLS
- 2022-07-26 Listing Removed — GAMLS
- 2022-07-05 Listed $339,914 GAMLS
Property tax history
+176.6%/yrLatest (2025): $3,842 · -0.9% YoY. Source: county tax records.
Cash-flow waterfall
monthlySold comps — $/sqft
last 12 mo · ≤1 miLoading sold comps…