 🌊 Lakefront
1225 NW 21st St Bldg 26 Unit 6-2608 · North River Shores, FL
Flood risk 3/10 · Minor
- FEMA flood zone
- X (unshaded)
- Chance of flooding over 30 yrs
- 0.12%
- Est. flood insurance / yr
- $507 – $1,088
Fire risk 1/10 · Minimal
- Est. fire insurance / yr
- $947 – $1,759
Heat risk 10/10 · Severe
- Hot days now (above 106°F)
- 7 days/yr
- Hot days in 30 yrs
- 25 days/yr
Wind risk 10/10 · Severe
- Chance of severe wind over 30 yrs
- 99.0%
Air-quality risk 2/10 · Minimal
- Unhealthy air days now
- 1 days/yr
- Unhealthy air days in 30 yrs
- 1 days/yr
Risk factors via First Street. Map © Google.
Why this score? — see what drove the C+ grade
The composite is a weighted blend of 9 inputs, each scored 0–100. Each bar is that input's sub-score; the figure is the points it added to the 100-point composite (weight × sub-score).
- Cash flow +24.8/30.0
- 1% rule +10.0/10.0
- DSCR +8.0/10.0
- ARV discount +7.5/15.0
- Schools +4.5/10.0
- Livability +3.7/5.0
- Condition / age +2.5/5.0
- Rent growth +2.3/5.0
- Appreciation +0.0/10.0
$124,999
🖨 Deal sheet 📄 Offer letter ✓ Due diligence
Listing remarks
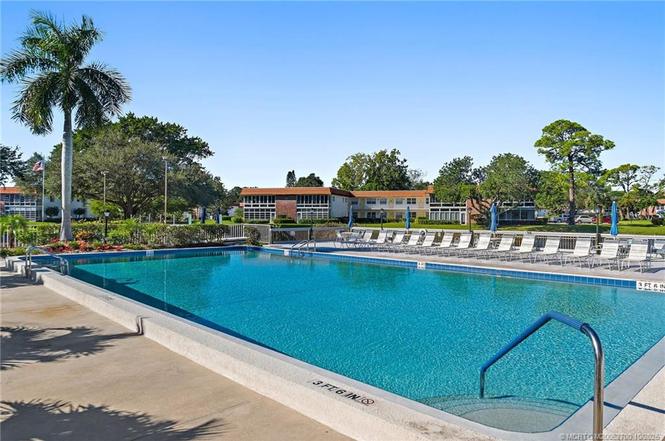
Step into classic Florida charm with this inviting 2BR/2BA furnished condo located in the active community of Vista Del Lago. This corner unit features a large living area flooded with natural light and a screened patio perfect for morning coffee. New Floors and fresh paint too! Recent updates include new luxury plank vinyl (LPV) flooring throughout, fresh interior paint, and a remodeled primary bathroom. While the kitchen and second bath still showcase their original vintage character, they offer an excellent opportunity to modernize and make it your own. Whether you’re looking for a full-time residence or a seasonal retreat, this condo has all the right fundamentals in a friendly
Key facts
- Screened patio
- Vintage character
- Clubhouse
Tags
Property features AI
Finance
- Financial info: Pets not allowed
- HOA & community: Homeowners association (fee applies); Association fee includes management, cable TV, structure maintenance, parking, pools, recreation facilities, reserve fund, road maintenance, sewer, trash, and water; Association fee listed; Community amenities: clubhouse, fitness center, laundry facilities, non-gated, on-site property manager, pool, shuffleboard, trails/paths; Senior community
Exterior
- Parking: Assigned parking
- Utilities: Public water; Public sewer; Sewer connected; Water connected
- Home design: 2-story property; Resale construction
- Construction: Block and concrete construction
- Exterior features: Balcony; Screened balcony/porch; Community pool
Interior
- Bathrooms: 2 full bathrooms
- Heating & cooling: Central heating; Central air; Ceiling fans
- Interior features: Furnished
Neighborhood map
What this means for you Summary
Snapshot
- This is a 2-bed/2.0-bath condo listed at $125k.
Deal economics
- At list price, monthly cash flow is $264 ($3k/yr) — positive.
- The deal already cash-flows at list — no discount required.
- Meets the 1% rule at list price ($2k rent vs $125k).
- Recommended offer: $110k (12.0% below list) — sets the bar for market timing.
- Cap rate 8.8% vs local median 5.7% in North River Shores — top-decile yield for the area; either an underpriced asset or a hidden risk that comps aren't pricing in. Stress-test before assuming the spread holds.
Location & tenants
- Location reads 74/100 on livability (#292 in FL, #4,906 nationally) — a middle-class / working-renter tenant base. Strengths: crime A+, housing A+, employment B+; Watch: schools D+, amenities F, commute F.
- Martin (suburban): math 52% / reading 53% proficiency, ranked #24 of 73 in FL (top 33%) — acceptable for families but not a draw, mixed tenant base, ~2y average lease.
- Market conditions: Rents soft (-0.7%/yr); 256 active listings in the ZIP; 31 comparable units currently listed for rent nearby; rentals at typical pace (median 24d on market — plan ~3-4 weeks tenant-placement turnaround); 737 units permitted in Martin County in 2024 (167 in 5+ unit buildings).
- This rent runs 39% of the median local income ($63k/yr) — at the standard rent-burdened threshold; future hikes will face affordability resistance.
Forward outlook
- Local home prices are declining (-3.0%/yr); year-one equity from $864 of loan paydown is wiped out by about $4k of value loss. Plan a longer hold.
- Martin County population projected at +19% by 2050 — long-run rental-demand tailwind backs the buy-and-hold thesis.
Negotiation context
- It's been on market 195 days — a 12% lower offer ($110k) is reasonable based on typical stale-listing flexibility.
- 2 sale attempts; this cycle's ask has dropped $10k (7%) from the opening price — seller is motivated, your offer sets the floor, not the list.
Risks & watch-outs
- Watch-outs: HOA is 24% of rent.
- Climate carrying-cost: severe wind risk, 99% chance of damaging wind over 30y; extreme-heat days projected 7→25/yr by 2055 (HVAC capex compounding) — expect insurance premiums to compound above CPI over the hold.
Questions for the listing agent
- It's been on market 195 days. Have you received any prior offers? Is the seller open to a 12% concession, seller financing, or rate buy-down credit?
- Built in 1978 — when were the roof, HVAC, electrical panel, plumbing, and water heater last replaced?
- What does the HOA fee cover, when was the last increase, and are there any pending special assessments or reserve-fund shortfalls?
- Any open or pending special assessments — roof, HVAC, plumbing, elevator, façade? What's the per-unit balance and payoff schedule, and is the seller paying it off at close or rolling it to the buyer?
- Why hasn't it sold? Are there any deal-killer items the seller is aware of (foundation, flood, title, zoning, code violations)?
- Is there a deadline driving the sale (1031 exchange, divorce, estate, relocation)? That informs how much negotiation room exists.
- Schools are D-rated, which usually means shorter tenancies and higher turnover. Who's the typical renter profile here, and what's been the actual vacancy rate?
- This sits on a lake — are riparian / water-frontage rights deeded with the parcel? Any dock permits, shoreline easements, or HOA water-use restrictions?
- What's the documented flood / surge / shoreline-erosion history here (FEMA AND non-FEMA — e.g., storm surge, creek backup, septic-field saturation)?
- Any water-quality or seasonal algae-bloom issues that affect tenant satisfaction or short-term-rental demand?
- What's the average days-on-market for RENTAL listings here right now (not sales)? A rising rental-DOM trend means longer vacancies and softer asking-rent achievability than the comps imply.
- What's the recent tenant-quality profile in this submarket — average credit score on applications, eviction rate, late-payment / NSF rate, and stable-employment percentage? A property-management company in the area should have these aggregated.
- How much new apartment / multifamily construction is in the pipeline within 1–3 miles? Heavy new supply (>2% of stock underway) typically softens rents 12–24 months out; light construction supports rent growth.
Investment metrics
- 1% rule
- 1.64% ✓
- Cap rate
- 8.83%
- Cash-on-cash
- 9.05%
- DSCR
- 1.40
- GRM
- 5.1
CMA / ARV
No comps found within radius.
Projected returns pro-forma
-3.0% appreciation · 0.0% rent growth · sell at horizon
- IRR
- -7.4%
- Equity multiple
- 0.74×
- Total profit
- $-9,124
- Equity at exit
- $18,638
- IRR
- -4.4%
- Equity multiple
- 0.77×
- Total profit
- $-8,204
- Equity at exit
- $10,808
Cash invested: $35,000 (down + closing). Projections, not guarantees.
Landlord ↔ Tenant lean methodology
- Overall (STATE)
- 87 Strongly Landlord-Friendly
- State Florida
- 87 Strongly Landlord-Friendly · R+3
- County
- — inherits STATE
- City
- — inherits STATE
ZIP-level market 34994
- Home prices YoY
- -27.1%
- Rents YoY
- -0.7%
- Active inventory
- 256
- Price-to-rent
- 5.1×
Monthly cashflow live
- Estimated rent
- $2,056 high interval (Pro) →
- Mortgage (P&I)
- −$656
- Tax est. 1.5%
- −$156 /mo · $1,875/yr
- Insurance
- −$52
- HOA
- −$496
- Vacancy / Maint / Mgmt
- −$432
- Net cashflow
- $264
Break-even live
Sensitivity live
| Price | -10% $350 | -5% $307 | +0% $264 | +5% $221 | +10% $178 |
|---|---|---|---|---|---|
| Rent | -10% $102 | -5% $183 | +0% $264 | +5% $345 | +10% $426 |
| Rate | -1.0pp $327 | -0.5pp $296 | base $264 | +0.5pp $232 | +1.0pp $199 |
UW: 25.0% down · 7.5% · 30yr · 1.5% tax · 5.0% vac · 8.0% maint · 8.0% mgmt
Financing live
Cash to close
- Down payment
- $31,250
- Closing costs
- $3,750
- Reserves months
- —
- Total cash needed
- —
Loan-product check · same deal, 3 products live
Conventional
25% down · 7.5% · 30yr
- Down + closing
- —
- Monthly P&I
- —
- Monthly cashflow
- —
- DSCR
- —
- Eligible?
- —
Personal DTI + credit; lowest rate.
DSCR
20% down · 8.5% · 30yr
- Down + closing
- —
- Monthly P&I
- —
- Monthly cashflow
- —
- DSCR
- —
- Eligible?
- —
No personal income docs; deal must DSCR.
Hard money
10% down · 12.0% · 12mo
- Down + closing
- —
- Monthly P&I
- —
- Monthly cashflow
- —
- DSCR
- —
- Eligible?
- —
Short-term bridge; refi at stabilization.
Rent comps 31 comps
| Address | Beds | Baths | Sqft | Rent | $/sqft | DOM | Units | Dist |
|---|---|---|---|---|---|---|---|---|
| 1225 NW 21st St Stuart, FL | 1.0 | 1.5 | 773 | $1,500 | $1.94 | 21d | 3 | 0.06mi |
| 1225 NW 21st St Stuart, FL | 1.0 | 1.5 | 773 | $1,350 | $1.75 | 14d | 1 | 0.06mi |
| 1225 NW 21st St Unit 35-3512 Stuart, FL | 1.0 | 1.5 | 747 | $1,395 | $1.87 | 24d | 1 | 0.06mi |
| 1225 NW 21st St Unit 36-3609 Stuart, FL | 2.0 | 2.0 | 1014 | $1,700 | $1.68 | 21d | 1 | 0.06mi |
| 1225 NW 21st St Unit 8-815 Stuart, FL | 2.0 | 2.0 | 1014 | $1,950 | $1.92 | 24d | 1 | 0.07mi |
| 1225 NW 21st St Unit 7-705 Stuart, FL | 1.0 | 1.5 | 747 | $1,550 | $2.07 | 14d | 1 | 0.07mi |
| 1900 NW Federal Hwy Stuart, FL | 1.0–2.0 | 1.0–2.0 | 1013 | $3,973 | $3.92 | 14d | 21 | 0.23mi |
| 2201 NW Federal Hwy Stuart, FL | 1.0–3.0 | 1.0–2.0 | 1080 | $2,530 | $2.34 | 14d | 18 | 0.28mi |
| 1010 NW Fresco Way Jensen Beach, FL | 1.0–3.0 | 1.0–2.0 | 1011 | $2,122 | $2.10 | 14d | 10 | 0.62mi |
| 2233 NW 22nd Ave #102 Stuart, FL | 2.0 | 2.0 | 1030 | $2,200 | $2.14 | 21d | 1 | 0.76mi |
| 2273 NW 22nd Ave #104 Stuart, FL | 3.0 | 3.0 | 1388 | $3,600 | $2.59 | 24d | 1 | 0.78mi |
| 2283 NW 22nd Ave #104 Stuart, FL | 2.0 | 2.0 | 1074 | $2,100 | $1.96 | 24d | 1 | 0.78mi |
| 974 NW Spruce Ridge Dr Stuart, FL | 2.0 | 2.0 | 1037 | $2,100 | $2.03 | 24d | 1 | 0.80mi |
| 964 NW Spruce Ridge Dr Unit D1 Stuart, FL | 2.0 | 2.0 | 1056 | $2,200 | $2.08 | 24d | 1 | 0.86mi |
| 1655 NW Fork Rd Stuart, FL | 2.0 | 2.0 | 1390 | $3,600 | $2.59 | 24d | 1 | 0.92mi |
| 800 NW Fork Rd Stuart, FL | 1.0–2.0 | 1.0–2.0 | 886 | $1,850 | $2.09 | 14d | 2 | 1.04mi |
| 25 NE 17th St Stuart, FL | 3.0 | 2.0 | 990 | $2,000 | $2.02 | 24d | 1 | 1.11mi |
| 1398 NW Cavendish Ct Stuart, FL | 2.0–3.0 | 2.5 | 1242 | $2,393 | $1.93 | 21d | 11 | 1.12mi |
| 975 NW Flagler Ave #307 Stuart, FL | 2.0 | 2.0 | 1226 | $2,750 | $2.24 | 24d | 1 | 1.29mi |
| 975 NW Flagler Ave #403 Stuart, FL | 2.0 | 2.0 | 1082 | $3,000 | $2.77 | 24d | 1 | 1.29mi |
| 975 NW Flagler Ave Stuart, FL | 2.0 | 2.0 | 1226 | $2,800 | $2.28 | 24d | 1 | 1.29mi |
| 975 NW Flagler Ave #306 Stuart, FL | 2.0 | 2.0 | 1182 | $2,500 | $2.12 | 24d | 1 | 1.29mi |
| 975 NW Flagler Ave #407 Stuart, FL | 2.0 | 2.0 | 1226 | $4,500 | $3.67 | 24d | 1 | 1.29mi |
| 875 NW Flagler Ave #302 Stuart, FL | 2.0 | 2.0 | 1082 | $2,900 | $2.68 | 14d | 1 | 1.32mi |
| 875 NW Flagler Ave #404 Stuart, FL | 2.0 | 2.0 | 1183 | $5,250 | $4.44 | 24d | 1 | 1.32mi |
| 64 NE Acacia Trl Jensen Beach, FL | 2.0 | 2.0 | 1000 | $3,000 | $3.00 | 24d | 1 | 1.37mi |
| 3624 NW Adriatic Ln Unit 308 Jensen Beach, FL | 1.0 | 1.0 | 781 | $1,659 | $2.12 | 24d | 1 | 1.46mi |
| 3751 NW Willow Creek Dr Jensen Beach, FL | 2.0 | 2.0 | 1467 | $2,900 | $1.98 | 24d | 1 | 1.46mi |
| 3781 NW Willow Creek Dr Jensen Beach, FL | 2.0 | 2.0 | 1330 | $2,700 | $2.03 | 24d | 1 | 1.48mi |
| 3617 NW Adriatic Ln Jensen Beach, FL | 1.0 | 1.0 | 802 | $1,595 | $1.99 | 24d | 1 | 1.48mi |
| 415 NW Flagler Ave #403 Stuart, FL | 2.0 | 2.0 | 1082 | $3,000 | $2.77 | 24d | 1 | 1.50mi |
HOA detail condo
- Monthly dues
- $496 · $5,952/yr
- Assessments
- None detected in remarks — confirm with the listing agent.
Listing history 7 events
-
2026-05-01status Pending
-
2026-04-24historical Active Under Contract
-
2026-03-12status Active
-
2026-03-03historical Active Under Contract
-
2026-02-08price $124,999
-
2025-12-29price $130,000
-
2025-10-17$135,000 Active
ⓘ Source: listings_history table (triggers on properties + properties_extension) + one-shot
backfill from property_details.listing_events for pre-trigger history.
Climate risk First Street
- Flood 3/10 Moderate FEMA zone X (unshaded) · 12% chance over 30 yrs
- Wildfire 1/10 Low
- Heat 10/10 Extreme 7 d/yr ≥106°F today · 25 d/yr by 30 yrs out
- Wind 10/10 Extreme 99% chance of damaging wind over 30 yrs
- Air quality 2/10 Low 1 unhealthy d/yr today · 1 by 30 yrs out
Nearby sold comps map
Loading sold comps map…
Walkable amenities ~0.75 mi
Loading nearby amenities…
Taxation est. · year 1
- Rental income
- $24,667
- − Mortgage interest
- −$7,002
- − Property taxes
- −$1,875
- − Insurance
- −$625
- − Repairs & maintenance
- −$1,973
- − Management
- −$1,973
- − HOA
- −$5,952
- − Depreciation
- −$3,636
- Taxable income
- $1,630
- Est. tax owed @ 24.0%
- −$391
- After-tax cash flow
- $2,778/yr
For passive investors: Depreciation is non-cash, so a rental often shows a tax loss while cash-flowing — sheltering income. Rental losses are passive: they offset passive income freely, and up to $25,000/yr can offset ordinary (W-2) income if you actively participate and your MAGI is under $100k (phasing out to $0 by $150k); unused losses carry forward. On sale, claimed depreciation is recaptured at up to 25%, and gains may owe capital-gains tax (a 1031 exchange can defer both). Figures are a year-1 estimate at your 24.0% rate — not tax advice; consult a CPA.
Schools (NCES district)
- District
- Martin
- NCES district ID
- 1201290
- Math proficiency
- 52% ▼ -14.00%
- Reading proficiency
- 53% ▼ -4.00%
- Median HH income
- $52,482
- Composite
- 45.1/100
- National rank
- #2690
- State rank
- #24 of 73 in FL
Livability — North River Shores
- Score
- 74/100
- State rank
- #292
- US rank
- #4906
Category grades
Schools grade is shown separately in the Schools card above.
Census & demographics
- Census place
- North River Shores, FL
- County
- Martin County · 165,223 people
- Metro
- Port St. Lucie, FL
- Population (ZIP)
- 18,737
- Household income
- $62,533
- Rent vs Own
- Severe rent burden
- 1408.0
Population outlook (Martin County) Hauer SSP2
- Today (2025)
- 172,383 people
- By 2030
- 180,192 · +4.5%
- By 2040
- 194,114 · +12.6%
- By 2050
- 204,992 · +18.9%
- By 2075
- 229,641 · +33.2%
- By 2100
- 232,146 · +34.7%
Race, ethnicity, and origin ACS 2023
- Neighborhood character
- Majority White (65%)
- Race & ethnicity
- White 65% Hispanic / Latino 21% Two or more races 12% Black 11%
- Hispanic origin (detail)
- Mexican 6% Puerto Rican 5% Cuban 1%
- Common ancestry
- Romanian 5% Lithuanian 3% Slovak 2%
- Foreign-born
- 12% · Canada
- Languages at home
- 80% English-only · Spanish 16% Russian/Polish/Slavic 2% Other Indo-European 1%
Political lean MEDSL · Martin
- 2024 margin
- Solid R (+31.1) · D 34.1% · R 65.2%
- 2008→2024 swing
- -17.5pp toward R · 2008: -13.6pp · 2024: -31.1pp
- All cycles
- 2024: R+31.1 2020: R+24.6 2016: R+26.9 2012: R+22.9 2008: R+13.6
Not yet ingested
- Civics
- —
Market trends
- HPI YoY
- ▼ -130.08%
- Current HPI
- 349.7061
- Rent YoY
- ▼ -0.69%
- Metro
- Port St. Lucie, FL
- State GDP YoY
- ▲ 3.28%
- F500 in state
- 36
Industry mix (Fortune 500 HQ in FL)
| Industry | F500 HQs | Revenue |
|---|---|---|
| Industrial Technology | 2 | $29B |
|
||
| Insurance | 2 | $17B |
|
||
| Retail | 1 | $60B |
|
||
| Technology Distribution | 1 | $58B |
|
||
| Homebuilding | 1 | $35B |
|
||
| Technology Manufacturing | 1 | $35B |
|
||
Price history
-7.4% since first listed7 events — show timeline
- 2026-05-01 Pending — MCRTC
- 2026-04-24 Contingent — MCRTC
- 2026-03-12 Relisted — MCRTC
- 2026-03-03 Contingent — MCRTC
- 2026-02-08 Price Changed $124,999 MCRTC
- 2025-12-29 Price Changed $130,000 MCRTC
- 2025-10-17 Listed $135,000 MCRTC
Cash-flow waterfall
monthlySold comps — $/sqft
last 12 mo · ≤1 miLoading sold comps…