 🏗️ New Construction
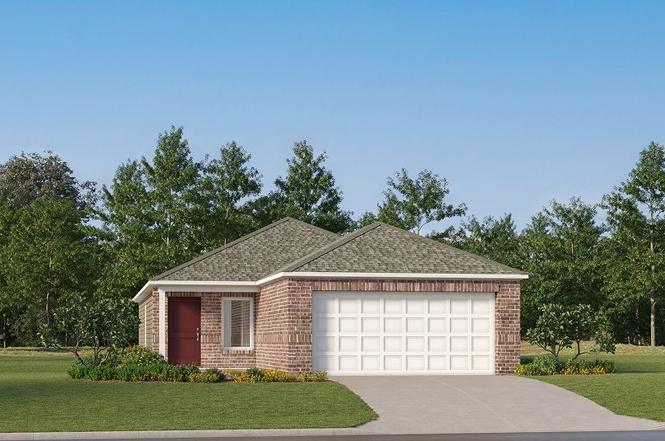
Kitson Plan · Edmond, OK
Flood risk No data
- FEMA flood zone
- —
- Chance of flooding over 30 yrs
- —
- Est. flood insurance / yr
- —
Fire risk No data
- Est. fire insurance / yr
- —
Heat risk No data
- Hot days now (above threshold)
- —
- Hot days in 30 yrs
- —
Wind risk No data
- Chance of severe wind over 30 yrs
- —
Air-quality risk No data
- Unhealthy air days now
- —
- Unhealthy air days in 30 yrs
- —
Risk factors via First Street. Map © Google.
Why this score? — see what drove the F grade
The composite is a weighted blend of 9 inputs, each scored 0–100. Each bar is that input's sub-score; the figure is the points it added to the 100-point composite (weight × sub-score).
- ARV discount +7.5/15.0
- Cash flow +6.8/30.0
- Condition / age +4.0/5.0
- Livability +3.9/5.0
- Schools +3.6/10.0
- Rent growth +2.8/5.0
- 1% rule +1.8/10.0
- DSCR +1.1/10.0
- Appreciation +0.0/10.0
$237,900
🖨 Deal sheet (PDF) 📄 Offer letter ✓ Due diligence
Listing remarks
This single-level home showcases a spacious open floorplan shared between the kitchen, dining area and family room for easy entertaining during gatherings. An owner's suite enjoys a private location in a rear corner of the home, complemented by an en-suite bathroom and walk-in closet. There are two secondary bedrooms along the side of the home, which are comfortable spaces for household members and overnight guests.
Key facts
- Walk-in closet
- Open floorplan
- Secondary bedrooms
Tags
Property features AI
Finance
- Financial info: List price $238,900
Exterior
- Parking: 2 total parking spaces; 2-car garage
- Home design: Single-family new construction (Kitson plan); Active listing
- Exterior features: Located on NW street prefix (NW 205th Terrace); Address: 2845 NW 205th Ter, Edmond, OK 73012
Interior
- Bedrooms: 3 bedrooms
- Bathrooms: 2 full bathrooms
- Interior features: New construction plan (Kitson); Living area approximately 1,402
Neighborhood map
What this means for you Summary
Snapshot
- This is a 3-bed/2.0-bath single-family listed at $238k. Condition is rated good.
Deal economics
- At list price, monthly cash flow is $-476 ($-6k/yr) — negative.
- The deal already cash-flows at list — no discount required.
- To meet the 1% rule (rent ≥ 1% of price), the offer needs to be $211k (11.4% below list).
- Recommended offer: $211k (11.4% below list) — sets the bar for 1% rule.
- Cap rate 4.4% vs local median 3.4% in Edmond — top-decile yield for the area; either an underpriced asset or a hidden risk that comps aren't pricing in. Stress-test before assuming the spread holds.
Location & tenants
- Location reads 78/100 on livability (#6 in OK, #2,383 nationally) — a middle-class / working-renter tenant base. Strengths: employment A+, housing A+, crime A-; Watch: health & safety C-, commute F.
- Edmond (suburban): math 38% / reading 40% proficiency, ranked #11 of 270 in OK (top 4%) — families likely to look elsewhere, expect single-tenant / working-renter base with shorter leases.
- Zoned schools: Frontier Es (math 42% / reading 48%, grade D-, #60 of 845 statewide, top 7%, 826 students, 0% FRL); Cheyenne Ms (math 34% / reading 42%, grade F, #13 of 345 statewide, top 4%, 851 students, 0% FRL); North Hs (math 47% / reading 57%, grade D+, #1 of 447 statewide, top 0%, 2,555 students, 0% FRL) — zoned schools average 0% FRL vs 22% district-wide (22 pts lower); this property's tenant base skews higher-income than the district average.
- Market conditions: Rents rising (+1.2%/yr); 647 active listings in the ZIP; 2 comparable units currently listed for rent nearby; high-income renter base; 5,365 units permitted in Oklahoma County in 2024 (569 in 5+ unit buildings).
Forward outlook
- Local home prices are declining (-3.0%/yr); year-one equity from $2k of loan paydown is wiped out by about $9k of value loss. Plan a longer hold.
- Oklahoma County population projected at +41% by 2050 — long-run rental-demand tailwind backs the buy-and-hold thesis.
Negotiation context
- Only 6 days on market — expect competitive offers; lowballing is unlikely to land.
Questions for the listing agent
- What do current leases actually rent for vs. the listed asking? Can we see a recent rent roll and the last 12 months of T-12 income?
- Is there a deadline driving the sale (1031 exchange, divorce, estate, relocation)? That informs how much negotiation room exists.
- Schools are A-rated — typically a magnet for longer-tenancy family renters. What's the average tenant stay here, and is there a school-zone premium baked into asking?
- The area grade is low — what's the realistic commute time and amenity access for the typical tenant pool here? Any planned neighborhood developments (good or bad) we should know about?
- What's the average days-on-market for RENTAL listings here right now (not sales)? A rising rental-DOM trend means longer vacancies and softer asking-rent achievability than the comps imply.
- What's the recent tenant-quality profile in this submarket — average credit score on applications, eviction rate, late-payment / NSF rate, and stable-employment percentage? A property-management company in the area should have these aggregated.
- How much new for-sale + rental construction is in the pipeline within 1–3 miles? Heavy new supply typically softens prices + rents 12–24 months out; constrained supply supports both.
Investment metrics
- 1% rule
- 0.68% ✗
- Cap rate
- 4.45%
- Cash-on-cash
- -6.59%
- DSCR
- 0.71
- GRM
- 12.2
CMA / ARV
- ARV (on-the-fly)
- $309,842
- Comps found
- 12
Show comp detail 12 sales within ~0.75 mi
| Address | Dist | Beds/Ba | Sqft | Sold | Price | $/sf | Match |
|---|---|---|---|---|---|---|---|
| 3316 Cookson Point Dr | 0.06mi | 3/2.0 | 1,400 (-0%) | 2mo | $306,990 | $219 | 95 |
| 3725 Lynne Ave | 0.07mi | 3/2.0 | 1,400 (-0%) | 4mo | $303,990 | $217 | 93 |
| 3909 Lynne Ave | 0.14mi | 3/2.0 | 1,427 (+2%) | 0mo | $296,500 | $208 | 90 |
| 3332 Cookson Point Dr | 0.03mi | 3/2.0 | 1,300 (-7%) | 2mo | $298,990 | $230 | 85 |
| 3324 Cookson Point Dr | 0.04mi | 3/2.0 | 1,500 (+7%) | 3mo | $348,825 | $233 | 84 |
| 3724 Lynne Ave | 0.08mi | 3/2.0 | 1,500 (+7%) | 3mo | $330,840 | $221 | 82 |
| 3800 Lynne Ave | 0.09mi | 3/2.0 | 1,550 (+11%) | 3mo | $341,840 | $221 | 76 |
| 3200 Cookson Point Dr | 0.11mi | 3/2.0 | 1,550 (+11%) | 1mo | $294,500 | $190 | 76 |
| 3709 Lynne Ave | 0.05mi | 4/2.0 (+1) | 1,565 (+12%) | 0mo | $322,490 | $206 | 73 |
| 3340 Cookson Point Dr | 0.04mi | 3/2.0 | 1,200 (-14%) | 3mo | $279,990 | $233 | 72 |
| 3717 Lynne Ave | 0.06mi | 3/2.0 | 1,200 (-14%) | 4mo | $279,990 | $233 | 70 |
| 3808 Lynne Ave | 0.09mi | 3/2.0 | 1,200 (-14%) | 7mo | $284,140 | $237 | 66 |
Match score weights: distance 35% · size 25% · config 20% · recency 20%. Top-matched comps best support the ARV.
Projected returns pro-forma
-3.0% appreciation · 1.21% rent growth · sell at horizon
- IRR
- -29.7%
- Equity multiple
- 0.03×
- Total profit
- $-84,229
- Equity at exit
- $46,198
- IRR
- -40.2%
- Equity multiple
- -0.46×
- Total profit
- $-127,026
- Equity at exit
- $26,789
Cash invested: $86,756 (down + closing). Projections, not guarantees.
Landlord ↔ Tenant lean methodology
- Overall (STATE)
- 83 Strongly Landlord-Friendly
- State Oklahoma
- 83 Strongly Landlord-Friendly · R+20
- County
- — inherits STATE
- City
- — inherits STATE
ZIP-level market 73012
- Home prices YoY
- -17.9%
- Rents YoY
- 1.2%
- Active inventory
- 647
- Price-to-rent
- 9.4×
Monthly cashflow live
- Estimated rent
- $2,108 medium interval (Pro) →
- Mortgage (P&I)
- −$1,625
- Tax est. 1.5%
- −$387 /mo · $4,648/yr
- Insurance
- −$129
- HOA
- −$0
- Vacancy / Maint / Mgmt
- −$443
- Net cashflow
- $-476
Break-even live
Sensitivity live
| Price | -10% $-262 | -5% $-369 | +0% $-476 | +5% $-583 | +10% $-690 |
|---|---|---|---|---|---|
| Rent | -10% $-643 | -5% $-559 | +0% $-476 | +5% $-393 | +10% $-310 |
| Rate | -1.0pp $-320 | -0.5pp $-397 | base $-476 | +0.5pp $-556 | +1.0pp $-638 |
UW: 25.0% down · 7.5% · 30yr · 1.5% tax · 5.0% vac · 8.0% maint · 8.0% mgmt
Financing live
Cash to close
- Down payment
- $77,460
- Closing costs
- $9,295
- Reserves months
- —
- Total cash needed
- —
Loan-product check · same deal, 3 products live
Conventional
25% down · 7.5% · 30yr
- Down + closing
- —
- Monthly P&I
- —
- Monthly cashflow
- —
- DSCR
- —
- Eligible?
- —
Personal DTI + credit; lowest rate.
DSCR
20% down · 8.5% · 30yr
- Down + closing
- —
- Monthly P&I
- —
- Monthly cashflow
- —
- DSCR
- —
- Eligible?
- —
No personal income docs; deal must DSCR.
Hard money
10% down · 12.0% · 12mo
- Down + closing
- —
- Monthly P&I
- —
- Monthly cashflow
- —
- DSCR
- —
- Eligible?
- —
Short-term bridge; refi at stabilization.
Rent comps 2 comps
| Address | Beds | Baths | Sqft | Rent | $/sqft | DOM | Units | Dist |
|---|---|---|---|---|---|---|---|---|
| 21925 Homesteaders Rd Edmond, OK | 3.0 | 2.0 | 1433 | $2,100 | $1.47 | 19d | 1 | 0.95mi |
| 2145 Scissortail Landing Dr Edmond, OK | 4.0 | 2.0 | 1800 | $1,795 | $1.00 | 3d | 1 | 1.00mi |
Listing history 6 events
-
2026-06-22price $237,900 Active 6 DOM
-
2026-06-21days on market $238,900 Active 6 DOM
-
2026-06-18days on market $238,900 Active 3 DOM
-
2026-06-17days on market $238,900 Active 2 DOM
-
2026-06-15remarks 419-char remark
-
2026-06-15$238,900 Active 1 DOM
ⓘ Source: listings_history table (triggers on properties + properties_extension) + one-shot
backfill from property_details.listing_events for pre-trigger history.
Nearby sold comps map
Loading sold comps map…
Walkable amenities ~0.75 mi
Loading nearby amenities…
Taxation est. · year 1
- Rental income
- $25,293
- − Mortgage interest
- −$17,356
- − Property taxes
- −$4,648
- − Insurance
- −$1,549
- − Repairs & maintenance
- −$2,023
- − Management
- −$2,023
- − Depreciation
- −$9,014
- Taxable loss
- −$11,320
- Est. tax savings @ 24.0%
- +$2,717
- After-tax cash flow
- $-2,996/yr
For passive investors: Depreciation is non-cash, so a rental often shows a tax loss while cash-flowing — sheltering income. Rental losses are passive: they offset passive income freely, and up to $25,000/yr can offset ordinary (W-2) income if you actively participate and your MAGI is under $100k (phasing out to $0 by $150k); unused losses carry forward. On sale, claimed depreciation is recaptured at up to 25%, and gains may owe capital-gains tax (a 1031 exchange can defer both). Figures are a year-1 estimate at your 24.0% rate — not tax advice; consult a CPA.
Condition & rehab AI · 12 photos
This single-level home is in good condition with a modern and well-maintained interior and exterior. It is move-in ready and would benefit from a fresh coat of paint on exterior trim and cleaning gutters to further enhance its curb appeal and rental value.
Value-add opportunities
- Resale Paint exterior trim — Fresh paint can enhance curb appeal and home value.
- Rental Clean gutters — Clean gutters improve drainage and reduce maintenance costs for tenants.
Renovation cost estimate screening
Value-add ROI direction
- Resale Paint exterior trim — Fresh paint can enhance curb appeal and home value. ↑
- Rental Clean gutters — Clean gutters improve drainage and reduce maintenance costs for tenants. ↑
ⓘ Cost ranges are severity-bucket heuristics (US national rule-of-thumb). Get contractor quotes + a written scope before underwriting a rehab budget.
Schools (NCES district)
- District
- Edmond
- NCES district ID
- 4010590
- Math proficiency
- 38% ▼ -12.00%
- Reading proficiency
- 40% ▼ -12.00%
- Median HH income
- $73,212
- Composite
- 35.88/100
- National rank
- #4814
- State rank
- #11 of 270 in OK
Livability — Edmond
- Score
- 78/100
- State rank
- #6
- US rank
- #2383
Category grades
Schools grade is shown separately in the Schools card above.
Census & demographics
- Census place
- Edmond, OK
- County
- Oklahoma County · 771,644 people
- City population
- 177,083
- Metro
- Oklahoma City, OK
- Population (ZIP)
- 46,993
- Household income
- $126,659
- Rent vs Own
- Severe rent burden
- 898.0
Population outlook (Oklahoma County) Hauer SSP2
- Today (2025)
- 911,875 people
- By 2030
- 982,413 · +7.7%
- By 2040
- 1,130,468 · +24.0%
- By 2050
- 1,288,422 · +41.3%
- By 2075
- 1,711,482 · +87.7%
- By 2100
- 2,088,448 · +129.0%
Race, ethnicity, and origin ACS 2023
- Neighborhood character
- Predominantly White (67%)
- Race & ethnicity
- White 67% Two or more races 10% Black 8% Asian 8% Hispanic / Latino 8% Native American 2%
- Hispanic origin (detail)
- Mexican 5%
- Common ancestry
- Italian 3% Slovak 2% Romanian 2%
- Foreign-born
- 11% · Canada, China, Vietnam
- Languages at home
- 86% English-only · Spanish 4% Other Indo-European 2% Chinese 2%
Political lean MEDSL · Oklahoma
- 2024 margin
- Toss-up / Even · D 48.0% · R 49.7% · Other 2.3%
- 2008→2024 swing
- +15.1pp toward D · 2008: -16.8pp · 2024: -1.7pp
- All cycles
- 2024: R+1.7 2020: R+1.1 2016: R+10.5 2012: R+16.7 2008: R+16.8
Not yet ingested
- Civics
- —
Market trends
- HPI YoY
- ▼ -44.41%
- Current HPI
- 203.1105
- Rent YoY
- ▲ 1.21%
- Metro
- Oklahoma City, OK
- State GDP YoY
- ▲ 1.55%
- F500 in state
- 6
Industry mix (Fortune 500 HQ in OK)
| Industry | F500 HQs | Revenue |
|---|---|---|
| Energy | 3 | $48B |
|
||
Cash-flow waterfall
monthlySold comps — $/sqft
last 12 mo · ≤1 miLoading sold comps…