 Multi-family
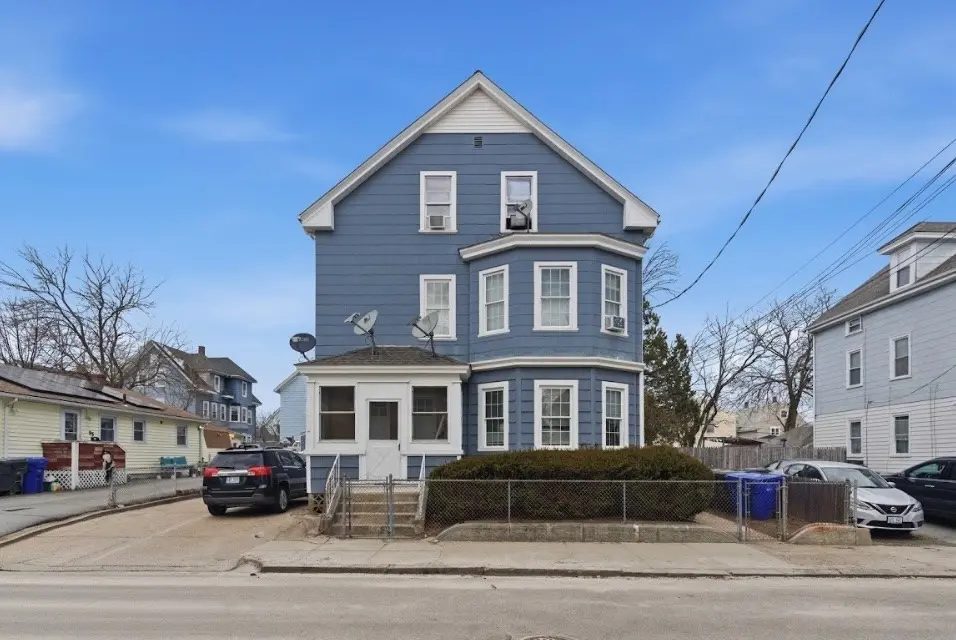
85 Hendricks St · Central Falls, RI
Flood risk 1/10 · Minimal
- FEMA flood zone
- X (unshaded)
- Chance of flooding over 30 yrs
- 0.0%
- Est. flood insurance / yr
- $473 – $860
Fire risk 1/10 · Minimal
- Est. fire insurance / yr
- $835 – $1,551
Heat risk 5/10 · Moderate
- Hot days now (above 96°F)
- 7 days/yr
- Hot days in 30 yrs
- 15 days/yr
Wind risk 6/10 · Moderate
- Chance of severe wind over 30 yrs
- 70.0%
Air-quality risk 2/10 · Minimal
- Unhealthy air days now
- 1 days/yr
- Unhealthy air days in 30 yrs
- 2 days/yr
Risk factors via First Street. Map © Google.
Why this score? — see what drove the D- grade
The composite is a weighted blend of 9 inputs, each scored 0–100. Each bar is that input's sub-score; the figure is the points it added to the 100-point composite (weight × sub-score).
- Cash flow +12.8/30.0
- Appreciation +7.3/10.0
- DSCR +3.8/10.0
- Livability +3.3/5.0
- 1% rule +3.0/10.0
- Rent growth +2.5/5.0
- Condition / age +2.5/5.0
- Schools +0.4/10.0
- ARV discount +0.0/15.0
$699,990
🖨 Deal sheet (PDF) 📄 Offer letter ✓ Due diligence
Multi-family units
County records classify this as Multi-Family (2-4 Unit). Listing-text estimate: 1 unit. estimate disagrees with records
Listing remarks MLS
Well maintained 3 family available now. All units are 3 bedroom apartments, 1 bath, dining room and living room. Home boasts a 2 car garage with an extra 4 off street parking spaces, and a large fenced in backyard. This property is situated on a quiet dead end street.
Key facts
- Large yard
- Multi-family home
- Off-street parking
Tags
Neighborhood map
What this means for you Summary
Snapshot
- This is a 9-bed/3.0-bath multifamily listed at $700k.
Deal economics
- At list price, monthly cash flow is $-59 ($-710/yr) — negative.
- To cash-flow at today's rent, offer at most $690k (1.5% below list).
- To meet the 1% rule (rent ≥ 1% of price), the offer needs to be $562k (19.7% below list).
- Recommended offer: $562k (19.7% below list) — sets the bar for 1% rule.
Location & tenants
- Location reads 66/100 on livability (#21 in RI) — a middle-class / working-renter tenant base. Strengths: health & safety A+, cost of living A, housing B; Watch: amenities F, commute F, employment F.
- Central Falls (suburban): math 2% / reading 8% proficiency, ranked #38 of 39 in RI (top 97%) — low school quality limits family demand, transient renter base, plan for 1-2y turnover; 78% free/reduced lunch — lower-income household profile, screen leases tightly.
- Zoned schools: Ella Risk School (math 2% / reading 12%, grade F, #158 of 167 statewide, top 97%, 430 students, 94% FRL); Calcutt Middle School (math 0% / reading 6%, grade F, #56 of 57 statewide, top 98%, 511 students, 97% FRL); Central Falls Sr High (math 2% / reading 12%, grade F, #53 of 58 statewide, top 96%, 811 students, 97% FRL) — zoned schools average 96% FRL vs 78% district-wide (18 pts higher); higher-poverty schools than district average — tighter screening recommended.
- Market conditions: 32 active listings in the ZIP; 776 units permitted in Providence County in 2024 (229 in 5+ unit buildings).
Forward outlook
- In year one you build about $37k of equity ($5k loan paydown + $32k appreciation (4.6% local appreciation)).
- Providence County population projected at +5% by 2050 — modest demand growth; plan on rents tracking national, not racing it.
- At projected returns (4.6% appreciation + 3.0% rent growth), your $196k cash investment doubles in ~5 years — after that, you're playing with house money.
- By year 2, paydown + projected appreciation supports a ~$59k cash-out refi (75% LTV) — recoverable capital for the next deal without selling this one.
Negotiation context
- It's been on market 22 days — a 2% lower offer ($689k) is reasonable based on typical stale-listing flexibility.
- 4 sale attempts since 25y ago with the ask held roughly flat each time — persistent listings suggest the price (not the market) is what's stuck; bring a comps-based counter.
- Current owner paid $515k; 36% above their basis — modest negotiation headroom, anchor on the comps not their cost.
Risks & watch-outs
- Watch-outs: built in 1895 — expect roof / HVAC / electrical / plumbing capex.
- Climate carrying-cost: major wind risk, 70% chance of damaging wind over 30y; extreme-heat days projected 7→15/yr by 2055 (HVAC capex compounding) — expect insurance premiums to compound above CPI over the hold.
Questions for the listing agent
- What do current leases actually rent for vs. the listed asking? Can we see a recent rent roll and the last 12 months of T-12 income?
- Built in 1895 — when were the roof, HVAC, electrical panel, plumbing, and water heater last replaced?
- Is there a deadline driving the sale (1031 exchange, divorce, estate, relocation)? That informs how much negotiation room exists.
- Schools are F-rated, which usually means shorter tenancies and higher turnover. Who's the typical renter profile here, and what's been the actual vacancy rate?
- The area grade is low — what's the realistic commute time and amenity access for the typical tenant pool here? Any planned neighborhood developments (good or bad) we should know about?
- What's the average days-on-market for RENTAL listings here right now (not sales)? A rising rental-DOM trend means longer vacancies and softer asking-rent achievability than the comps imply.
- What's the recent tenant-quality profile in this submarket — average credit score on applications, eviction rate, late-payment / NSF rate, and stable-employment percentage? A property-management company in the area should have these aggregated.
- How much new apartment / multifamily construction is in the pipeline within 1–3 miles? Heavy new supply (>2% of stock underway) typically softens rents 12–24 months out; light construction supports rent growth.
Investment metrics
- 1% rule
- 0.80% ✗
- Cap rate
- 6.19%
- Cash-on-cash
- -0.36%
- DSCR
- 0.98
- GRM
- 10.4
CMA / ARV
- ARV (on-the-fly)
- $581,030
- Comps found
- 12
Show comp detail 12 sales within ~0.75 mi
| Address | Dist | Beds/Ba | Sqft | Sold | Price | $/sf | Match |
|---|---|---|---|---|---|---|---|
| 124 Butler Ave | 0.38mi | 8/3.0 (-1) | 3,298 (+10%) | 0mo | $650,000 | $197 | 60 |
| 1126 Smithfield Ave | 0.43mi | 8/3.0 (-1) | 2,948 (-2%) | 20mo | $625,000 | $212 | 56 |
| 136 138 Earle St | 0.27mi | 8/4.0 (-1) | 3,100 (+4%) | 21mo | $567,000 | $183 | 55 |
| 431 Central St | 0.57mi | 8/3.0 (-1) | 2,976 (-1%) | 18mo | $577,000 | $194 | 52 |
| 476 Lonsdale Ave | 0.58mi | 9/3.0 | 2,917 (-3%) | 20mo | $705,000 | $242 | 52 |
| 241 Rand St | 0.48mi | 9/3.0 | 3,156 (+5%) | 21mo | $580,000 | $184 | 51 |
| 31-33 Garfield St | 0.58mi | 9/3.0 | 3,318 (+11%) | 6mo | $685,000 | $206 | 50 |
| 86 88 Rand St | 0.61mi | 9/3.0 | 3,298 (+10%) | 15mo | $600,000 | $182 | 43 |
| 38 Fletcher St | 0.73mi | 9/3.0 | 3,264 (+9%) | 12mo | $505,000 | $155 | 41 |
| 58 Perry St | 0.61mi | 9/5.0 | 3,120 (+4%) | 20mo | $569,000 | $182 | 40 |
| 301 Illinois St | 0.57mi | 8/3.0 (-1) | 3,243 (+8%) | 19mo | $630,000 | $194 | 39 |
| 122 Sylvian St | 0.73mi | 9/3.0 | 3,207 (+7%) | 22mo | $600,000 | $187 | 36 |
Match score weights: distance 35% · size 25% · config 20% · recency 20%. Top-matched comps best support the ARV.
Projected returns pro-forma
4.58% appreciation · 3.0% rent growth · sell at horizon
- IRR
- 11.5%
- Equity multiple
- 1.72×
- Total profit
- $140,570
- Equity at exit
- $378,719
- IRR
- 12.8%
- Equity multiple
- 3.23×
- Total profit
- $436,485
- Equity at exit
- $639,233
Cash invested: $195,997 (down + closing). Projections, not guarantees.
Landlord ↔ Tenant lean methodology
- Overall (STATE)
- 31 Tenant-Leaning
- State Rhode Island
- 31 Tenant-Leaning · D+8
- County
- — inherits STATE
- City
- — inherits STATE
ZIP-level market 02863
- Home prices YoY
- 1.2%
- Active inventory
- 32
- Price-to-rent
- 31.1×
Monthly cashflow live
- Estimated rent
- $5,623 high interval (Pro) →
- Mortgage (P&I)
- −$3,671
- Tax from tax record
- −$539 /mo · $6,466/yr
- Insurance
- −$292
- HOA
- −$0
- Vacancy / Maint / Mgmt
- −$1,181
- Net cashflow
- $-59
Break-even live
Sensitivity live
| Price | -10% $337 | -5% $139 | +0% $-59 | +5% $-257 | +10% $-455 |
|---|---|---|---|---|---|
| Rent | -10% $-503 | -5% $-281 | +0% $-59 | +5% $163 | +10% $385 |
| Rate | -1.0pp $293 | -0.5pp $119 | base $-59 | +0.5pp $-241 | +1.0pp $-425 |
3-unit breakdown (identical units grouped — click to expand)
| Units | Beds | Baths | Est. rent |
|---|---|---|---|
| 3× units | 3 | 1 | $5,622 |
| #1 | 3 | 1 | $1,874 |
| #2 | 3 | 1 | $1,874 |
| #3 | 3 | 1 | $1,874 |
| Total (3 units) | $5,623 | ||
UW: 25.0% down · 7.5% · 30yr · 1.5% tax · 5.0% vac · 8.0% maint · 8.0% mgmt
Financing live
Cash to close
- Down payment
- $174,998
- Closing costs
- $21,000
- Reserves months
- —
- Total cash needed
- —
Loan-product check · same deal, 3 products live
Conventional
25% down · 7.5% · 30yr
- Down + closing
- —
- Monthly P&I
- —
- Monthly cashflow
- —
- DSCR
- —
- Eligible?
- —
Personal DTI + credit; lowest rate.
DSCR
20% down · 8.5% · 30yr
- Down + closing
- —
- Monthly P&I
- —
- Monthly cashflow
- —
- DSCR
- —
- Eligible?
- —
No personal income docs; deal must DSCR.
Hard money
10% down · 12.0% · 12mo
- Down + closing
- —
- Monthly P&I
- —
- Monthly cashflow
- —
- DSCR
- —
- Eligible?
- —
Short-term bridge; refi at stabilization.
Listing history 11 events
-
2026-04-16status Pending
-
2026-04-14status Active
-
2026-04-06status Pending
-
2026-03-17$699,990 Active
-
2023-05-25soldstatus $515,000 Closed 268-char remark
Show marketing remark (268 chars)
Well maintained 3 family available now. All units are 3 bedroom apartments, 1 bath, dining room and living room. Home boasts a 2 car garage with an extra 4 off street parking spaces, and a large fenced in backyard. This property is situated on a quiet dead end street.
-
2023-05-25soldstatus $505,000
Show marketing remark (268 chars)
Well maintained 3 family available now. All units are 3 bedroom apartments, 1 bath, dining room and living room. Home boasts a 2 car garage with an extra 4 off street parking spaces, and a large fenced in backyard. This property is situated on a quiet dead end street.
-
2023-04-25status Pending 268-char remark
Show marketing remark (268 chars)
Well maintained 3 family available now. All units are 3 bedroom apartments, 1 bath, dining room and living room. Home boasts a 2 car garage with an extra 4 off street parking spaces, and a large fenced in backyard. This property is situated on a quiet dead end street.
-
2023-04-04$499,900 Active 268-char remark
Show marketing remark (268 chars)
Well maintained 3 family available now. All units are 3 bedroom apartments, 1 bath, dining room and living room. Home boasts a 2 car garage with an extra 4 off street parking spaces, and a large fenced in backyard. This property is situated on a quiet dead end street.
-
2001-10-27soldstatus $155,000 176-char remark
Show marketing remark (176 chars)
THIS UNBELIEVABLE 3 FAMILY IS IN IMMACULATE CONDITION! HUGE ROOMS. .THREE BEDS EACH UNIT. . PERFECT FOR AN INVESTOR OR FIRST TIME HOMEBUYER! A MUST SEE! CALL FOR MORE DETAILS!!
-
2001-08-30historical 176-char remark
Show marketing remark (176 chars)
THIS UNBELIEVABLE 3 FAMILY IS IN IMMACULATE CONDITION! HUGE ROOMS. .THREE BEDS EACH UNIT. . PERFECT FOR AN INVESTOR OR FIRST TIME HOMEBUYER! A MUST SEE! CALL FOR MORE DETAILS!!
-
2001-07-14$159,900 176-char remark
Show marketing remark (176 chars)
THIS UNBELIEVABLE 3 FAMILY IS IN IMMACULATE CONDITION! HUGE ROOMS. .THREE BEDS EACH UNIT. . PERFECT FOR AN INVESTOR OR FIRST TIME HOMEBUYER! A MUST SEE! CALL FOR MORE DETAILS!!
ⓘ Source: listings_history table (triggers on properties + properties_extension) + one-shot
backfill from property_details.listing_events for pre-trigger history.
Tax reassessment forecast RI · Partial reset (capped growth)
- Current annual tax
- $6,466 · $539/mo
- Projected year-2 tax
- $8,938 · $745/mo
- Expected delta
- +$2,472/yr (+$206/mo · 38.2%)
ⓘ Screening estimate from a state-policy table — verify with the county assessor before closing.
Climate risk First Street
- Flood 1/10 Low FEMA zone X (unshaded) · 0% chance over 30 yrs
- Wildfire 1/10 Low
- Heat 5/10 Major 7 d/yr ≥96°F today · 15 d/yr by 30 yrs out
- Wind 6/10 Major 70% chance of damaging wind over 30 yrs
- Air quality 2/10 Low 1 unhealthy d/yr today · 2 by 30 yrs out
Nearby sold comps map
Loading sold comps map…
Walkable amenities ~0.75 mi
Loading nearby amenities…
Taxation est. · year 1
- Rental income
- $67,476
- − Mortgage interest
- −$39,210
- − Property taxes
- −$6,466
- − Insurance
- −$3,500
- − Repairs & maintenance
- −$5,398
- − Management
- −$5,398
- − Depreciation
- −$20,363
- Taxable loss
- −$12,860
- Est. tax savings @ 24.0%
- +$3,086
- After-tax cash flow
- $2,377/yr
For passive investors: Depreciation is non-cash, so a rental often shows a tax loss while cash-flowing — sheltering income. Rental losses are passive: they offset passive income freely, and up to $25,000/yr can offset ordinary (W-2) income if you actively participate and your MAGI is under $100k (phasing out to $0 by $150k); unused losses carry forward. On sale, claimed depreciation is recaptured at up to 25%, and gains may owe capital-gains tax (a 1031 exchange can defer both). Figures are a year-1 estimate at your 24.0% rate — not tax advice; consult a CPA.
Schools (NCES district)
- District
- Central Falls
- NCES district ID
- 4400120
- Math proficiency
- 2% ▼ -6.00%
- Reading proficiency
- 8% ▼ -5.00%
- Median HH income
- $30,478
- Composite
- 3.59/100
- National rank
- #10071
- State rank
- #38 of 39 in RI
Livability — Central Falls
- Score
- 66/100
- State rank
- #21
- US rank
- #11321
Category grades
Schools grade is shown separately in the Schools card above.
Census & demographics
- Census place
- Central Falls, RI
- County
- Providence County · 548,917 people
- City population
- 22,701
- Metro
- Providence-Warwick, RI-MA
- Population (ZIP)
- 22,701
- Household income
- $49,285
- Rent vs Own
- Severe rent burden
- 1380.0
Population outlook (Providence County) Hauer SSP2
- Today (2025)
- 653,469 people
- By 2030
- 660,819 · +1.1%
- By 2040
- 672,747 · +3.0%
- By 2050
- 683,741 · +4.6%
- By 2075
- 720,435 · +10.2%
- By 2100
- 741,582 · +13.5%
Race, ethnicity, and origin ACS 2023
- Neighborhood character
- Predominantly Hispanic (69%)
- Race & ethnicity
- Hispanic / Latino 69% Two or more races 29% White 16% Black 8%
- Hispanic origin (detail)
- Mexican 6% Puerto Rican 15% Dominican 7%
- Common ancestry
- Lithuanian 4% Russian 4% Romanian 1%
- Foreign-born
- 40% · Canada, Jamaica
- Languages at home
- 29% English-only · Spanish 62% Other Indo-European 5% French/Haitian/Cajun 3%
Political lean MEDSL · Providence
- 2024 margin
- D (+14.4) · D 56.1% · R 41.7% · Other 2.2%
- 2008→2024 swing
- -20.0pp toward R · 2008: 34.4pp · 2024: 14.4pp
- All cycles
- 2024: D+14.4 2020: D+22.9 2016: D+21.2 2012: D+34.9 2008: D+34.4
Not yet ingested
- Civics
- —
Market trends
- HPI YoY
- ▲ 4.58%
- Current HPI
- 373.2598
- Rent YoY
- —
- Metro
- Providence-Warwick, RI-MA
- State GDP YoY
- ▲ 2.25%
- F500 in state
- 10
Industry mix (Fortune 500 HQ in RI)
| Industry | F500 HQs | Revenue |
|---|---|---|
| Healthcare | 1 | $373B |
|
||
| Food Distribution | 1 | $31B |
|
||
| Aerospace / Defense | 1 | $14B |
|
||
| Financial Services | 1 | $8B |
|
||
| Consumer Goods | 1 | $4B |
|
||
Price history
+337.8% since first listed11 events — show timeline
- 2026-04-16 Pending — RIS
- 2026-04-14 Relisted — RIS
- 2026-04-06 Pending — RIS
- 2026-03-17 Listed $699,990 RIS
- 2023-05-25 Sold (Public Records) $505,000 Public Records
- 2023-05-25 Sold (MLS) $515,000 RIS
- 2023-04-25 Pending — RIS
- 2023-04-04 Listed $499,900 RIS
- 2001-10-27 Sold (MLS) $155,000 RIS
- 2001-08-30 Listing Removed — RIS
- 2001-07-14 Listed $159,900 RIS
Property tax history
+5.6%/yrLatest (2025): $6,466 · +9.8% YoY. Source: county tax records.
Cash-flow waterfall
monthlySold comps — $/sqft
last 12 mo · ≤1 miLoading sold comps…