927 Miller Street Site #7 · Kewaunee, WI
Flood risk No data
- FEMA flood zone
- —
- Chance of flooding over 30 yrs
- —
- Est. flood insurance / yr
- —
Fire risk No data
- Est. fire insurance / yr
- —
Heat risk No data
- Hot days now (above threshold)
- —
- Hot days in 30 yrs
- —
Wind risk No data
- Chance of severe wind over 30 yrs
- —
Air-quality risk No data
- Unhealthy air days now
- —
- Unhealthy air days in 30 yrs
- —
Risk factors via First Street. Map © Google.
Why this score? — see what drove the D grade
The composite is a weighted blend of 9 inputs, each scored 0–100. Each bar is that input's sub-score; the figure is the points it added to the 100-point composite (weight × sub-score).
- Cash flow +15.0/30.0
- ARV discount +7.5/15.0
- 1% rule +5.0/10.0
- DSCR +5.0/10.0
- Livability +3.7/5.0
- Schools +2.9/10.0
- Rent growth +2.5/5.0
- Condition / age +2.0/5.0
- Appreciation +0.0/10.0
$20,800
🖨 Deal sheet 📄 Offer letter ✓ Due diligence
Listing remarks
* THIS IS A RESALE LISTING * You'll love living in this 3 bedroom, 1 bathroom home within a wonderful family-friendly community. Check out the awesome amenities your community has to offer such as community events, , , and more! This home won't be on the market long, so call us today for more information or to schedule a tour. Deposits & Fees are subject to change.
Key facts
- Built 2026
- Listed 6 days
Property features AI
Finance
- Financial info: List price $20,800
Exterior
- Utilities: Natural gas service
- Home design: Single-family property (spec build)
- Exterior features: Living area approximately 980 (listed)
Interior
- Bedrooms: 3 bedrooms
- Bathrooms: 1 full bathroom
- Heating & cooling: Natural gas heating
- Interior features: Spec new construction home
Neighborhood map
What this means for you Summary
Snapshot
- This is a 3-bed/1.0-bath manufactured listed at $21k. Condition is rated fair.
Deal economics
- At list price, monthly cash flow is $613 ($7k/yr) — positive.
- The deal already cash-flows at list — no discount required.
- Meets the 1% rule at list price ($958 rent vs $21k).
Location & tenants
- Location reads 73/100 on livability (#210 in WI) — a middle-class / working-renter tenant base. Strengths: crime A+, cost of living A+, housing A+; Watch: amenities F, commute F, health & safety D-.
- Kewaunee School District (town): math 34% / reading 31% proficiency, ranked #250 of 342 in WI (top 73%) — families likely to look elsewhere, expect single-tenant / working-renter base with shorter leases.
- Market conditions: 18 active listings in the ZIP; 58 units permitted in Kewaunee County in 2024 (0 in 5+ unit buildings).
Forward outlook
- Local home prices are declining (-3.0%/yr); year-one equity from $144 of loan paydown is wiped out by about $624 of value loss. Plan a longer hold.
- Kewaunee County population projected at -20% by 2050 — secular population decline; favor cash flow + early exit over multi-decade hold.
- At projected returns (-3.0% appreciation + 3.0% rent growth), your $6k cash investment doubles in ~1 year — after that, you're playing with house money.
Negotiation context
- Only 7 days on market — expect competitive offers; lowballing is unlikely to land.
Questions for the listing agent
- Have any recent inspections been done? Can we get a copy of the seller's disclosures and any deferred-maintenance estimates?
- Is there a deadline driving the sale (1031 exchange, divorce, estate, relocation)? That informs how much negotiation room exists.
- The area grade is low — what's the realistic commute time and amenity access for the typical tenant pool here? Any planned neighborhood developments (good or bad) we should know about?
- What's the average days-on-market for RENTAL listings here right now (not sales)? A rising rental-DOM trend means longer vacancies and softer asking-rent achievability than the comps imply.
- What's the recent tenant-quality profile in this submarket — average credit score on applications, eviction rate, late-payment / NSF rate, and stable-employment percentage? A property-management company in the area should have these aggregated.
- How much new for-sale + rental construction is in the pipeline within 1–3 miles? Heavy new supply typically softens prices + rents 12–24 months out; constrained supply supports both.
Investment metrics
- 1% rule
- 4.61% ✓
- Cap rate
- 41.67%
- Cash-on-cash
- 126.36%
- DSCR
- 6.62
- GRM
- 1.8
CMA / ARV
No comps found within radius.
Projected returns pro-forma
-3.0% appreciation · 3.0% rent growth · sell at horizon
- IRR
- —
- Equity multiple
- 7.13×
- Total profit
- $35,704
- Equity at exit
- $3,101
- IRR
- —
- Equity multiple
- 14.98×
- Total profit
- $81,446
- Equity at exit
- $1,798
Cash invested: $5,824 (down + closing). Projections, not guarantees.
Landlord ↔ Tenant lean methodology
- Overall (STATE)
- 73 Landlord-Friendly
- State Wisconsin
- 73 Landlord-Friendly · R+2
- County
- — inherits STATE
- City
- — inherits STATE
ZIP-level market 54216
- Home prices YoY
- -30.3%
- Active inventory
- 18
- Price-to-rent
- 1.8×
Monthly cashflow live
- Estimated rent
- $958 medium interval (Pro) →
- Mortgage (P&I)
- −$109
- Tax est. 1.5%
- −$26 /mo · $312/yr
- Insurance
- −$9
- HOA
- −$0
- Vacancy / Maint / Mgmt
- −$201
- Net cashflow
- $613
Break-even live
UW: 25.0% down · 7.5% · 30yr · 1.5% tax · 5.0% vac · 8.0% maint · 8.0% mgmt
Financing live
Cash to close
- Down payment
- $5,200
- Closing costs
- $624
- Reserves months
- —
- Total cash needed
- —
Loan-product check · same deal, 3 products live
Conventional
25% down · 7.5% · 30yr
- Down + closing
- —
- Monthly P&I
- —
- Monthly cashflow
- —
- DSCR
- —
- Eligible?
- —
Personal DTI + credit; lowest rate.
DSCR
20% down · 8.5% · 30yr
- Down + closing
- —
- Monthly P&I
- —
- Monthly cashflow
- —
- DSCR
- —
- Eligible?
- —
No personal income docs; deal must DSCR.
Hard money
10% down · 12.0% · 12mo
- Down + closing
- —
- Monthly P&I
- —
- Monthly cashflow
- —
- DSCR
- —
- Eligible?
- —
Short-term bridge; refi at stabilization.
Listing history 7 events
-
2026-06-19days on market $20,800 Active 7 DOM
-
2026-06-18days on market $20,800 Active 6 DOM
-
2026-06-17days on market $20,800 Active 5 DOM
-
2026-06-16days on market $20,800 Active 4 DOM
-
2026-06-15days on market $20,800 Active 3 DOM
-
2026-06-12remarks 372-char remark
-
2026-06-12$20,800 Active 1 DOM
ⓘ Source: listings_history table (triggers on properties + properties_extension) + one-shot
backfill from property_details.listing_events for pre-trigger history.
Nearby sold comps map
Loading sold comps map…
Walkable amenities ~0.75 mi
Loading nearby amenities…
Taxation est. · year 1
- Rental income
- $11,499
- − Mortgage interest
- −$1,165
- − Property taxes
- −$312
- − Insurance
- −$104
- − Repairs & maintenance
- −$920
- − Management
- −$920
- − Depreciation
- −$605
- Taxable income
- $7,473
- Est. tax owed @ 24.0%
- −$1,794
- After-tax cash flow
- $5,566/yr
For passive investors: Depreciation is non-cash, so a rental often shows a tax loss while cash-flowing — sheltering income. Rental losses are passive: they offset passive income freely, and up to $25,000/yr can offset ordinary (W-2) income if you actively participate and your MAGI is under $100k (phasing out to $0 by $150k); unused losses carry forward. On sale, claimed depreciation is recaptured at up to 25%, and gains may owe capital-gains tax (a 1031 exchange can defer both). Figures are a year-1 estimate at your 24.0% rate — not tax advice; consult a CPA.
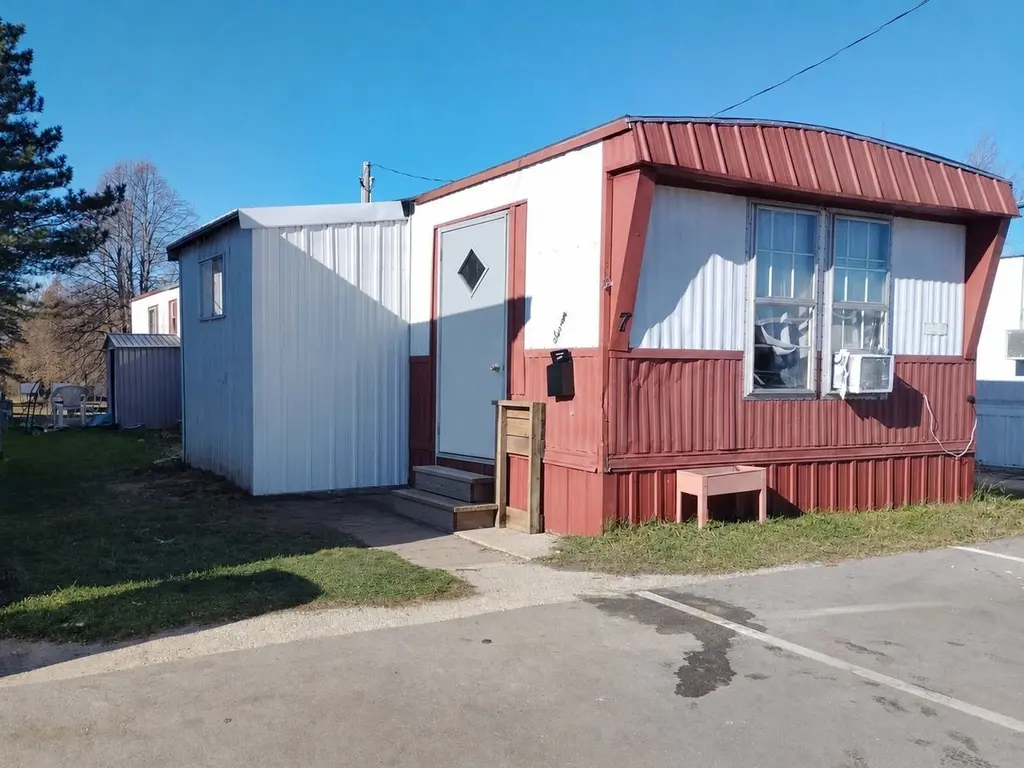
Condition & rehab AI · 1 photo
This manufactured home requires significant exterior repairs and maintenance to improve its condition and value.
Repairs flagged
- Major roof — Significant rust and wear
- Major exterior siding — Severe weathering and rust
Value-add opportunities
- Both repair and paint exterior siding — Enhances curb appeal and value
- Both repair roof — Critical to home's structural integrity and value
Renovation cost estimate screening
| Repair item | Severity | Est. cost |
|---|---|---|
| roof · Significant rust and wear | Major | $15,000–50,000 |
| exterior siding · Severe weathering and rust | Major | $15,000–50,000 |
| Total estimated repair cost · 2 items | $30,000–100,000 |
Value-add ROI direction
- Both repair and paint exterior siding — Enhances curb appeal and value ↑
- Both repair roof — Critical to home's structural integrity and value ↑
ⓘ Cost ranges are severity-bucket heuristics (US national rule-of-thumb). Get contractor quotes + a written scope before underwriting a rehab budget.
Schools (NCES district)
- District
- Kewaunee School District
- NCES district ID
- 5507410
- Math proficiency
- 34% ▼ -6.00%
- Reading proficiency
- 31% ▼ -9.00%
- Median HH income
- $54,703
- Composite
- 28.75/100
- National rank
- #6674
- State rank
- #250 of 342 in WI
Livability — Kewaunee
- Score
- 73/100
- State rank
- #210
- US rank
- #5523
Category grades
Schools grade is shown separately in the Schools card above.
Census & demographics
- Census place
- Kewaunee, WI
- Population (ZIP)
- 6,146
Population outlook (Kewaunee County) Hauer SSP2
- Today (2025)
- 19,723 people
- By 2030
- 19,156 · -2.9%
- By 2040
- 17,646 · -10.5%
- By 2050
- 15,786 · -20.0%
- By 2075
- 11,927 · -39.5%
- By 2100
- 8,358 · -57.6%
Race, ethnicity, and origin ACS 2023
- Neighborhood character
- Predominantly White (93%)
- Race & ethnicity
- White 93% Hispanic / Latino 5% Two or more races 4%
- Common ancestry
- Romanian 9% English 7% Iranian 2%
- Foreign-born
- 3% · Canada, China
- Languages at home
- 95% English-only · Spanish 4% German/W. Germanic 1%
Political lean MEDSL · Kewaunee
- 2024 margin
- Solid R (+33.8) · D 32.6% · R 66.3% · Other 1.1%
- 2008→2024 swing
- -44.8pp toward R · 2008: 11.0pp · 2024: -33.8pp
- All cycles
- 2024: R+33.8 2020: R+32.7 2016: R+27.9 2012: R+5.4 2008: D+11.0
Not yet ingested
- Civics
- —
Market trends
- HPI YoY
- ▼ -91.91%
- Current HPI
- 211.0654
- Rent YoY
- —
- Metro
- —
- State GDP YoY
- ▲ 2.10%
- F500 in state
- 20
Industry mix (Fortune 500 HQ in WI)
| Industry | F500 HQs | Revenue |
|---|---|---|
| Industrial Machinery | 4 | $23B |
|
||
| Industrial Technology | 2 | $36B |
|
||
| Insurance | 1 | $36B |
|
||
| Professional Services | 1 | $19B |
|
||
| Utilities | 1 | $9B |
|
||
| Consumer Goods | 1 | $3B |
|
||
Cash-flow waterfall
monthlySold comps — $/sqft
last 12 mo · ≤1 miLoading sold comps…