1937 Aves Glen Ln · Forney, TX
Flood risk No data
- FEMA flood zone
- —
- Chance of flooding over 30 yrs
- —
- Est. flood insurance / yr
- —
Fire risk No data
- Est. fire insurance / yr
- —
Heat risk No data
- Hot days now (above threshold)
- —
- Hot days in 30 yrs
- —
Wind risk No data
- Chance of severe wind over 30 yrs
- —
Air-quality risk No data
- Unhealthy air days now
- —
- Unhealthy air days in 30 yrs
- —
Risk factors via First Street. Map © Google.
Why this score? — see what drove the D- grade
The composite is a weighted blend of 9 inputs, each scored 0–100. Each bar is that input's sub-score; the figure is the points it added to the 100-point composite (weight × sub-score).
- ARV discount +9.9/15.0
- Cash flow +8.1/30.0
- 1% rule +4.2/10.0
- Schools +4.0/10.0
- Livability +3.8/5.0
- Rent growth +2.9/5.0
- Condition / age +2.5/5.0
- DSCR +2.1/10.0
- Appreciation +0.0/10.0
$229,900
🖨 Deal sheet (PDF) 📄 Offer letter ✓ Due diligence
Listing remarks MLS
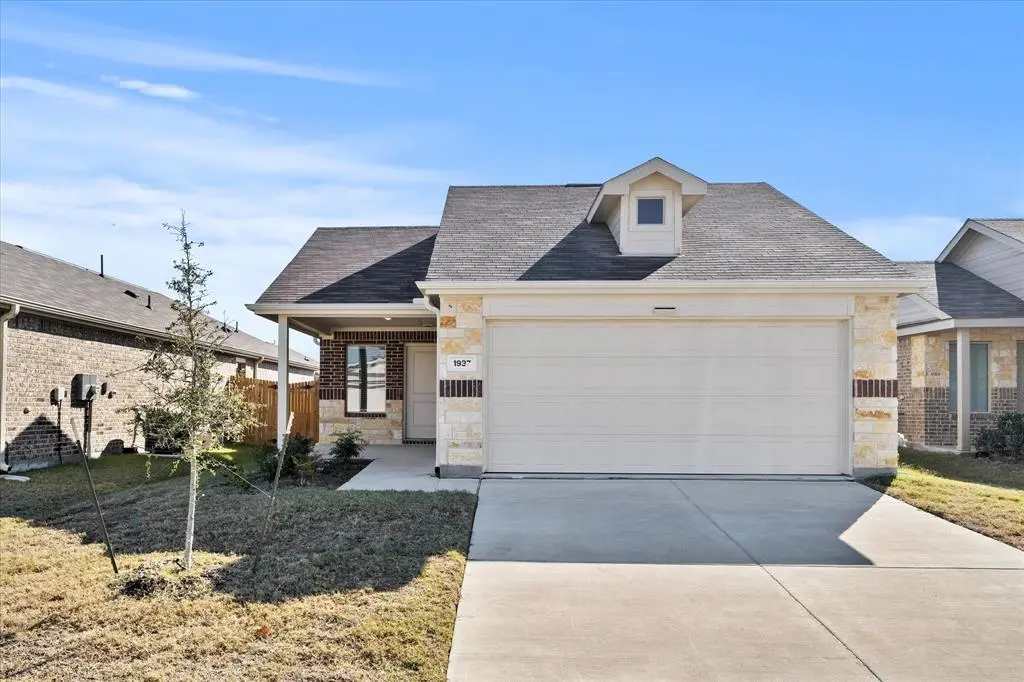
Built in 2024, this charming single-level home has that fresh, move-in ready feel. With an open floorplan, its perfect for entertaining, as well as everyday living. The covered front porch is the perfect, sit with your coffee, spot. The primary suite features a walk-in closet and comfy en suite bathroom, and the 2-car garage gives you plenty of space for cars and storage. Out back, is the perfect backyard for pets, plants, people or all three. The only thing this home is missing is someone to make it theirs! (Please see list of all the great upgrades in the attachments).
Key facts
- Covered front porch
- En suite bathroom
- Walk-in closet
Tags
Neighborhood map
What this means for you Summary
Snapshot
- This is a 3-bed/2.0-bath land listed at $230k.
Deal economics
- At list price, monthly cash flow is $-223 ($-3k/yr) — negative.
- To cash-flow at today's rent, offer at most $190k (17.1% below list).
- To meet the 1% rule (rent ≥ 1% of price), the offer needs to be $211k (8.1% below list).
- Recommended offer: $190k (17.1% below list) — sets the bar for cash-flow.
- Cap rate 5.1% vs local median 4.1% in Forney — meaningfully above typical; check what's discounted (condition, days-on-market, listing class) to confirm the premium yield is real.
Location & tenants
- Location reads 76/100 on livability (#98 in TX, #3,339 nationally) — a middle-class / working-renter tenant base. Strengths: crime A+, employment A+, cost of living A+; Watch: amenities C-, commute F.
- Forney ISD (rural): math 41% / reading 44% proficiency, ranked #234 of 826 in TX (top 28%) — families likely to look elsewhere, expect single-tenant / working-renter base with shorter leases.
- Market conditions: Rents rising (+1.4%/yr); 2200 active listings in the ZIP; 40 comparable units currently listed for rent nearby; rentals at typical pace (median 26d on market — plan ~3-4 weeks tenant-placement turnaround); 45% of comp listings sitting > 30 days — soft ceiling on asking rent; solid renter incomes; 1,747 units permitted in Kaufman County in 2024 (180 in 5+ unit buildings).
Forward outlook
- Local home prices are declining (-3.0%/yr); year-one equity from $2k of loan paydown is wiped out by about $7k of value loss. Plan a longer hold.
- Kaufman County population projected at +43% by 2050 — long-run rental-demand tailwind backs the buy-and-hold thesis.
Negotiation context
- It's been on market 198 days — a 12% lower offer ($202k) is reasonable based on typical stale-listing flexibility.
Risks & watch-outs
- Watch-outs: property tax is 2.9% of price.
Questions for the listing agent
- What do current leases actually rent for vs. the listed asking? Can we see a recent rent roll and the last 12 months of T-12 income?
- It's been on market 198 days. Have you received any prior offers? Is the seller open to a 17% concession, seller financing, or rate buy-down credit?
- Property tax is high relative to price — has the assessment been appealed recently, and will the sale trigger a re-assessment?
- What does the HOA fee cover, when was the last increase, and are there any pending special assessments or reserve-fund shortfalls?
- Why hasn't it sold? Are there any deal-killer items the seller is aware of (foundation, flood, title, zoning, code violations)?
- Is there a deadline driving the sale (1031 exchange, divorce, estate, relocation)? That informs how much negotiation room exists.
- Schools are B-rated — typically a magnet for longer-tenancy family renters. What's the average tenant stay here, and is there a school-zone premium baked into asking?
- The area grade is low — what's the realistic commute time and amenity access for the typical tenant pool here? Any planned neighborhood developments (good or bad) we should know about?
- What's the average days-on-market for RENTAL listings here right now (not sales)? A rising rental-DOM trend means longer vacancies and softer asking-rent achievability than the comps imply.
- What's the recent tenant-quality profile in this submarket — average credit score on applications, eviction rate, late-payment / NSF rate, and stable-employment percentage? A property-management company in the area should have these aggregated.
- How much new for-sale + rental construction is in the pipeline within 1–3 miles? Heavy new supply typically softens prices + rents 12–24 months out; constrained supply supports both.
Investment metrics
- 1% rule
- 0.92% ✗
- Cap rate
- 5.13%
- Cash-on-cash
- -4.16%
- DSCR
- 0.81
- GRM
- 9.1
CMA / ARV
- ARV (median comp)
- $242,729
- List price
- $229,900
- Delta
- -5.29%
- Verdict
- FAIR
- Comps
- 20 within 1.0 mi
Projected returns pro-forma
-3.0% appreciation · 1.42% rent growth · sell at horizon
- IRR
- -25.4%
- Equity multiple
- 0.15×
- Total profit
- $-54,551
- Equity at exit
- $34,279
- IRR
- -28.3%
- Equity multiple
- -0.21×
- Total profit
- $-78,053
- Equity at exit
- $19,878
Cash invested: $64,372 (down + closing). Projections, not guarantees.
Landlord ↔ Tenant lean methodology
- Overall (STATE)
- 87 Strongly Landlord-Friendly
- State Texas
- 87 Strongly Landlord-Friendly · R+5
- County
- — inherits STATE
- City
- — inherits STATE
ZIP-level market 75126
- Rents YoY
- 1.4%
- Active inventory
- 2200
- Price-to-rent
- 9.1×
Monthly cashflow live
- Estimated rent
- $2,112 high interval (Pro) →
- Mortgage (P&I)
- −$1,206
- Tax from tax record
- −$548 /mo · $6,575/yr
- Insurance
- −$96
- HOA
- −$42
- Vacancy / Maint / Mgmt
- −$443
- Net cashflow
- $-223
Break-even live
Sensitivity live
| Price | -10% $-93 | -5% $-158 | +0% $-223 | +5% $-288 | +10% $-353 |
|---|---|---|---|---|---|
| Rent | -10% $-390 | -5% $-307 | +0% $-223 | +5% $-140 | +10% $-56 |
| Rate | -1.0pp $-107 | -0.5pp $-165 | base $-223 | +0.5pp $-283 | +1.0pp $-343 |
UW: 25.0% down · 7.5% · 30yr · 1.5% tax · 5.0% vac · 8.0% maint · 8.0% mgmt
Financing live
Cash to close
- Down payment
- $57,475
- Closing costs
- $6,897
- Reserves months
- —
- Total cash needed
- —
Loan-product check · same deal, 3 products live
Conventional
25% down · 7.5% · 30yr
- Down + closing
- —
- Monthly P&I
- —
- Monthly cashflow
- —
- DSCR
- —
- Eligible?
- —
Personal DTI + credit; lowest rate.
DSCR
20% down · 8.5% · 30yr
- Down + closing
- —
- Monthly P&I
- —
- Monthly cashflow
- —
- DSCR
- —
- Eligible?
- —
No personal income docs; deal must DSCR.
Hard money
10% down · 12.0% · 12mo
- Down + closing
- —
- Monthly P&I
- —
- Monthly cashflow
- —
- DSCR
- —
- Eligible?
- —
Short-term bridge; refi at stabilization.
Rent comps 40 comps
| Address | Beds | Baths | Sqft | Rent | $/sqft | DOM | Units | Dist |
|---|---|---|---|---|---|---|---|---|
| 1947 Aves Glen Ln Forney, TX | 3.0 | 2.0 | 1411 | $2,195 | $1.56 | 25d | 1 | 0.01mi |
| 1728 High Perch Ln Forney, TX | 3.0 | 2.0 | 1474 | $1,800 | $1.22 | 20d | 1 | 0.08mi |
| 1729 High Perch Ln Forney, TX | 4.0 | 2.0 | 1720 | $2,350 | $1.37 | 45d | 1 | 0.08mi |
| 1631 Rosy Finch Dr Heath, TX | 4.0 | 2.0 | 1665 | $2,600 | $1.56 | 18d | 1 | 0.13mi |
| 1158 Barbary Fields St Forney, TX | 4.0 | 2.0 | 1780 | $2,200 | $1.24 | 0d | 1 | 0.13mi |
| 2003 Pine Stone Ln Forney, TX | 3.0 | 2.0 | 1488 | $2,000 | $1.34 | 45d | 1 | 0.13mi |
| 1355 Wedgeleaf Ln Forney, TX | 3.0 | 2.0 | 1461 | $2,200 | $1.51 | 45d | 1 | 0.14mi |
| 1625 Rosy Finch Dr Forney, TX | 4.0 | 2.0 | 1667 | $2,095 | $1.26 | 45d | 1 | 0.15mi |
| 1429 Dovekie Dr Forney, TX | 3.0 | 2.0 | 1311 | $2,500 | $1.91 | 3d | 1 | 0.16mi |
| 1622 Rosy Finch Dr Forney, TX | 4.0 | 2.0 | 1665 | $2,195 | $1.32 | 45d | 1 | 0.16mi |
| 1147 Barbary Fields St Forney, TX | 3.0 | 2.0 | 1522 | $2,200 | $1.45 | 0d | 1 | 0.18mi |
| 2330 Aspen Hill Dr Forney, TX | 3.0 | 2.0 | 1498 | $1,795 | $1.20 | 20d | 1 | 0.18mi |
| 2111 River Pine Rd Forney, TX | 3.0 | 2.0 | 1496 | $1,950 | $1.30 | 45d | 1 | 0.21mi |
| 1727 Crossbill St Forney, TX | 3.0 | 2.0 | 1311 | $1,750 | $1.33 | 20d | 1 | 0.22mi |
| 1725 Crossbill St Forney, TX | 3.0 | 2.0 | 1451 | $1,785 | $1.23 | 45d | 1 | 0.23mi |
| 1723 Crossbill St Forney, TX | 3.0 | 2.0 | 1461 | $1,785 | $1.22 | 45d | 1 | 0.23mi |
| 1719 Crossbill St Forney, TX | 3.0 | 2.0 | 1474 | $1,795 | $1.22 | 23d | 1 | 0.25mi |
| 1720 Crossbill St Forney, TX | 3.0 | 2.0 | 1461 | $1,785 | $1.22 | 45d | 1 | 0.26mi |
| 1715 Crossbill St Forney, TX | 3.0 | 2.0 | 1522 | $1,785 | $1.17 | 23d | 1 | 0.26mi |
| 1718 Crossbill St Forney, TX | 3.0 | 2.0 | 1311 | $1,730 | $1.32 | 23d | 1 | 0.26mi |
| 1318 Canyon Wren Dr Forney, TX | 3.0 | 2.0 | 1411 | $1,699 | $1.20 | 23d | 1 | 0.27mi |
| 1716 Crossbill St Forney, TX | 3.0 | 2.0 | 1451 | $1,785 | $1.23 | 45d | 1 | 0.27mi |
| 1650 Briar Hunt Dr Forney, TX | 3.0 | 2.0 | 1559 | $1,995 | $1.28 | 25d | 1 | 0.29mi |
| 1405 Merlin Bluff St Forney, TX | 3.0 | 2.0 | 1500 | $2,400 | $1.60 | 7d | 1 | 0.29mi |
| 1708 Crossbill St Forney, TX | 3.0 | 2.0 | 1760 | $1,840 | $1.05 | 16d | 1 | 0.30mi |
| 1419 Merlin Bluff St Forney, TX | 3.0 | 2.0 | 1454 | $1,900 | $1.31 | 14d | 1 | 0.30mi |
| 1231 Canyon Wren Dr Forney, TX | 3.0 | 2.0 | 1451 | $1,785 | $1.23 | 45d | 1 | 0.33mi |
| 1426 Merlin Bluff St Forney, TX | 3.0 | 2.0 | 1522 | $1,785 | $1.17 | 23d | 1 | 0.33mi |
| 1229 Canyon Wren Dr Forney, TX | 3.0 | 2.0 | 1461 | $1,785 | $1.22 | 45d | 1 | 0.34mi |
| 1227 Canyon Wren Dr Forney, TX | 4.0 | 2.0 | 1474 | $1,995 | $1.35 | 45d | 1 | 0.34mi |
| 1228 Canyon Wren Dr Forney, TX | 3.0 | 2.0 | 1451 | $1,785 | $1.23 | 45d | 1 | 0.35mi |
| 1223 Canyon Wren Dr Forney, TX | 3.0 | 2.0 | 1522 | $1,800 | $1.18 | 45d | 1 | 0.35mi |
| 1611 Sparrow Hawk Rd Forney, TX | 3.0 | 2.0 | 1522 | $1,800 | $1.18 | 45d | 1 | 0.35mi |
| 1621 Sparrow Hawk Rd Forney, TX | 3.0 | 2.0 | 1522 | $1,785 | $1.17 | 23d | 1 | 0.36mi |
| 1222 Canyon Wren Dr Forney, TX | 3.0 | 2.0 | 1302 | $1,775 | $1.36 | 45d | 1 | 0.37mi |
| 1220 Canyon Wren Dr Forney, TX | 3.0 | 2.0 | 1720 | $1,815 | $1.06 | 8d | 1 | 0.37mi |
| 1289 Wedgeleaf Ln Forney, TX | 3.0 | 2.0 | 1522 | $1,785 | $1.17 | 23d | 1 | 0.39mi |
| 1211 Canyon Wren Dr Forney, TX | 4.0 | 2.0 | 1656 | $2,400 | $1.45 | 23d | 1 | 0.39mi |
| 1285 Wedgeleaf Ln Forney, TX | 3.0 | 2.0 | 1522 | $1,800 | $1.18 | 45d | 1 | 0.41mi |
| 1281 Wedgeleaf Ln Forney, TX | 3.0 | 2.0 | 1522 | $1,805 | $1.19 | 14d | 1 | 0.42mi |
HOA detail
- Monthly dues
- $42 · $504/yr
Listing history 18 events
-
2026-06-21days on market $229,900 Active 198 DOM
-
2026-06-18days on market $229,900 Active 195 DOM
-
2026-06-17days on market $229,900 Active 194 DOM
-
2026-06-16days on market $229,900 Active 193 DOM
-
2026-06-15days on market $229,900 Active 192 DOM
-
2026-06-13days on market $229,900 Active 190 DOM
-
2026-06-13days on market $229,900 Active 189 DOM
-
2026-06-09days on market $229,900 Active 186 DOM
-
2026-06-08days on market $229,900 Active 185 DOM
-
2026-06-07days on market $229,900 Active 184 DOM
-
2026-06-04days on market $229,900 Active 181 DOM
-
2026-06-03days on market $229,900 Active 180 DOM
-
2026-06-02days on market $229,900 Active 179 DOM
-
2026-06-02price $229,900 Active 178 DOM
-
2026-06-01days on market $240,000 Active 178 DOM
-
2026-05-31days on market $240,000 Active 177 DOM
-
2026-04-14price $240,000 579-char remark
Show marketing remark (579 chars)
Built in 2024, this charming single-level home has that fresh, move-in ready feel. With an open floorplan, its perfect for entertaining, as well as everyday living. The covered front porch is the perfect, sit with your coffee, spot. The primary suite features a walk-in closet and comfy en suite bathroom, and the 2-car garage gives you plenty of space for cars and storage. Out back, is the perfect backyard for pets, plants, people or all three. The only thing this home is missing is someone to make it theirs! (Please see list of all the great upgrades in the attachments).
-
2025-12-05$245,500 Active 579-char remark
Show marketing remark (579 chars)
Built in 2024, this charming single-level home has that fresh, move-in ready feel. With an open floorplan, its perfect for entertaining, as well as everyday living. The covered front porch is the perfect, sit with your coffee, spot. The primary suite features a walk-in closet and comfy en suite bathroom, and the 2-car garage gives you plenty of space for cars and storage. Out back, is the perfect backyard for pets, plants, people or all three. The only thing this home is missing is someone to make it theirs! (Please see list of all the great upgrades in the attachments).
ⓘ Source: listings_history table (triggers on properties + properties_extension) + one-shot
backfill from property_details.listing_events for pre-trigger history.
Tax reassessment forecast TX · Resets to sale price
- Current annual tax
- $6,575 · $548/mo
- Projected year-2 tax
- $6,575 · $548/mo
- Expected delta
- $0/yr ($0/mo · 0.0%)
ⓘ Screening estimate from a state-policy table — verify with the county assessor before closing.
Nearby sold comps map
Loading sold comps map…
Walkable amenities ~0.75 mi
Loading nearby amenities…
Taxation est. · year 1
- Rental income
- $25,340
- − Mortgage interest
- −$12,878
- − Property taxes
- −$6,575
- − Insurance
- −$1,150
- − Repairs & maintenance
- −$2,027
- − Management
- −$2,027
- − HOA
- −$504
- − Depreciation
- −$6,688
- Taxable loss
- −$6,509
- Est. tax savings @ 24.0%
- +$1,562
- After-tax cash flow
- $-1,115/yr
For passive investors: Depreciation is non-cash, so a rental often shows a tax loss while cash-flowing — sheltering income. Rental losses are passive: they offset passive income freely, and up to $25,000/yr can offset ordinary (W-2) income if you actively participate and your MAGI is under $100k (phasing out to $0 by $150k); unused losses carry forward. On sale, claimed depreciation is recaptured at up to 25%, and gains may owe capital-gains tax (a 1031 exchange can defer both). Figures are a year-1 estimate at your 24.0% rate — not tax advice; consult a CPA.
Schools (NCES district)
- District
- Forney ISD
- NCES district ID
- 4819560
- Math proficiency
- 41% ▼ -20.00%
- Reading proficiency
- 44% ▼ -12.00%
- Median HH income
- $86,679
- Composite
- 40.07/100
- National rank
- #3812
- State rank
- #234 of 826 in TX
Livability — Forney
- Score
- 76/100
- State rank
- #98
- US rank
- #3339
Category grades
Schools grade is shown separately in the Schools card above.
Census & demographics
- County
- Kaufman County · 122,338 people
- City population
- 84,799
- Metro
- Dallas-Fort Worth-Arlington, TX
- Population (ZIP)
- 84,799
- Household income
- $103,673
- Rent vs Own
- Severe rent burden
- 1306.0
Population outlook (Kaufman County) Hauer SSP2
- Today (2025)
- 138,716 people
- By 2030
- 150,815 · +8.7%
- By 2040
- 174,877 · +26.1%
- By 2050
- 198,020 · +42.8%
- By 2075
- 251,908 · +81.6%
- By 2100
- 285,325 · +105.7%
Race, ethnicity, and origin ACS 2023
- Neighborhood character
- Diverse neighborhood (Simpson 0.68)
- Race & ethnicity
- White 45% Black 25% Hispanic / Latino 23% Two or more races 14% Asian 3%
- Hispanic origin (detail)
- Mexican 18% Puerto Rican 1%
- Common ancestry
- Italian 2% Slovak 1% Portuguese 1%
- Foreign-born
- 12% · Canada, Vietnam
- Languages at home
- 79% English-only · Spanish 14% Arabic 1% Vietnamese 1%
Political lean MEDSL · Kaufman
- 2024 margin
- Strong R (+27.9) · D 35.6% · R 63.5%
- 2008→2024 swing
- +7.9pp toward D · 2008: -35.8pp · 2024: -27.9pp
- All cycles
- 2024: R+27.9 2020: R+33.9 2016: R+47.0 2012: R+44.4 2008: R+35.8
Not yet ingested
- Civics
- —
Market trends
- HPI YoY
- ▼ -102.93%
- Current HPI
- 148.5749
- Rent YoY
- ▲ 1.42%
- Metro
- Dallas-Fort Worth-Arlington, TX
- State GDP YoY
- ▲ 3.95%
- F500 in state
- 110
Industry mix (Fortune 500 HQ in TX)
| Industry | F500 HQs | Revenue |
|---|---|---|
| Energy | 16 | $1,198B |
|
||
| Technology | 5 | $198B |
|
||
| Engineering / Construction | 4 | $72B |
|
||
| Energy Services | 3 | $60B |
|
||
| Utilities | 3 | $41B |
|
||
| Healthcare | 2 | $330B |
|
||
Price history
-2.2% since first listed2 events — show timeline
- 2026-04-14 Price Changed $240,000 NTREIS
- 2025-12-05 Listed $245,500 NTREIS
Property tax history
+469.3%/yrLatest (2025): $6,575 · +469.3% YoY. Source: county tax records.
Cash-flow waterfall
monthlySold comps — $/sqft
last 12 mo · ≤1 miLoading sold comps…