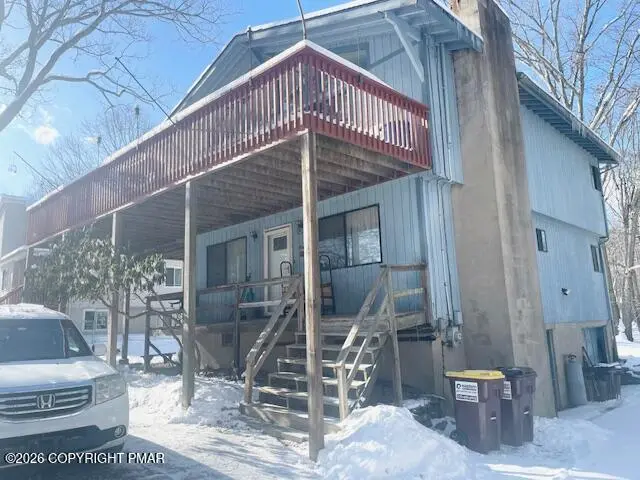
127 Skyview Rd · Pocono Ranch Lands, PA
Flood risk 1/10 · Minimal
- FEMA flood zone
- X (unshaded)
- Chance of flooding over 30 yrs
- 0.0%
- Est. flood insurance / yr
- $473 – $860
Fire risk 4/10 · Minor
- Est. fire insurance / yr
- $511 – $949
Heat risk 3/10 · Minor
- Hot days now (above 95°F)
- 7 days/yr
- Hot days in 30 yrs
- 15 days/yr
Wind risk 4/10 · Minor
- Chance of severe wind over 30 yrs
- 8.0%
Air-quality risk 2/10 · Minimal
- Unhealthy air days now
- 1 days/yr
- Unhealthy air days in 30 yrs
- 2 days/yr
Risk factors via First Street. Map © Google.
Why this score? — see what drove the B grade
The composite is a weighted blend of 9 inputs, each scored 0–100. Each bar is that input's sub-score; the figure is the points it added to the 100-point composite (weight × sub-score).
- Cash flow +19.6/30.0
- ARV discount +15.0/15.0
- Appreciation +10.0/10.0
- 1% rule +6.8/10.0
- DSCR +6.2/10.0
- Schools +4.7/10.0
- Livability +3.3/5.0
- Rent growth +2.5/5.0
- Condition / age +2.5/5.0
$180,000
🖨 Deal sheet 📄 Offer letter ✓ Due diligence
Listing remarks MLS
BACK ON THE MARKET - NO FAULT OF THE SELLER! Needs TLC - great investment!! This SPACIOUS 4 bed/ 2 bath / 2 car garage home with circular driveway is positioned in a private location with vacant neighboring lots. This home offers a nice sized kitchen, beautiful sunroom, TWO FIREPLACES, and work space in the basement.
Key facts
- 0.29 acre lot
- 2 garage spots
- Community pool
Neighborhood map
What this means for you Summary
Snapshot
- This is a 4-bed/2.0-bath single-family listed at $180k.
Deal economics
- At list price, monthly cash flow is $208 ($2k/yr) — positive.
- The deal already cash-flows at list — no discount required.
- Meets the 1% rule at list price ($2k rent vs $180k).
- Recommended offer: $158k (12.0% below list) — sets the bar for market timing.
- Cap rate 7.7% vs local median 4.4% in Pocono Ranch Lands — top-decile yield for the area; either an underpriced asset or a hidden risk that comps aren't pricing in. Stress-test before assuming the spread holds.
Location & tenants
- Location reads 66/100 on livability (#1,037 in PA) — a middle-class / working-renter tenant base. Strengths: crime A+, cost of living A+, housing A; Watch: employment D, health & safety D, schools F.
- Delaware Valley SD (rural): math 41% / reading 66% proficiency, ranked #121 of 539 in PA (top 22%) — acceptable for families but not a draw, mixed tenant base, ~2y average lease.
- Market conditions: 211 active listings in the ZIP; 2 comparable units currently listed for rent nearby; 213 units permitted in Pike County in 2024 (0 in 5+ unit buildings).
Forward outlook
- In year one you build about $19k of equity ($1k loan paydown + $18k appreciation (10.0% local appreciation)).
- Pike County population projected at -25% by 2050 — secular population decline; favor cash flow + early exit over multi-decade hold.
- At projected returns (10.0% appreciation + 3.0% rent growth), your $50k cash investment doubles in ~3 years — after that, you're playing with house money.
- By year 2, paydown + projected appreciation supports a ~$31k cash-out refi (75% LTV) — recoverable capital for the next deal without selling this one.
Negotiation context
- It's been on market 121 days — a 12% lower offer ($158k) is reasonable based on typical stale-listing flexibility.
- 2 sale attempts; this cycle's ask has dropped $30k (14%) from the opening price — seller is motivated, your offer sets the floor, not the list.
- Current owner paid $54k; list at $180k implies a 231% gain — meaningful room to come down on a strong offer.
Questions for the listing agent
- It's been on market 121 days. Have you received any prior offers? Is the seller open to a 12% concession, seller financing, or rate buy-down credit?
- Built in 1975 — when were the roof, HVAC, electrical panel, plumbing, and water heater last replaced?
- What does the HOA fee cover, when was the last increase, and are there any pending special assessments or reserve-fund shortfalls?
- Why hasn't it sold? Are there any deal-killer items the seller is aware of (foundation, flood, title, zoning, code violations)?
- Is there a deadline driving the sale (1031 exchange, divorce, estate, relocation)? That informs how much negotiation room exists.
- Schools are F-rated, which usually means shorter tenancies and higher turnover. Who's the typical renter profile here, and what's been the actual vacancy rate?
- What's the average days-on-market for RENTAL listings here right now (not sales)? A rising rental-DOM trend means longer vacancies and softer asking-rent achievability than the comps imply.
- What's the recent tenant-quality profile in this submarket — average credit score on applications, eviction rate, late-payment / NSF rate, and stable-employment percentage? A property-management company in the area should have these aggregated.
- How much new for-sale + rental construction is in the pipeline within 1–3 miles? Heavy new supply typically softens prices + rents 12–24 months out; constrained supply supports both.
Investment metrics
- 1% rule
- 1.18% ✓
- Cap rate
- 7.68%
- Cash-on-cash
- 4.94%
- DSCR
- 1.22
- GRM
- 7.0
CMA / ARV
- ARV (median comp)
- $283,408
- List price
- $180,000
- Delta
- -36.49%
- Verdict
- UNDERPRICED
- Comps
- 20 within 1.0 mi
Show comp detail 12 sales within ~0.75 mi
| Address | Dist | Beds/Ba | Sqft | Sold | Price | $/sf | Match |
|---|---|---|---|---|---|---|---|
| 115 Ridge Rd | 0.19mi | 3/3.0 (-1) | 1,956 (+1%) | 14mo | $365,000 | $187 | 69 |
| 149 Heather Hill Rd | 0.13mi | 4/2.0 | 1,728 (-11%) | 11mo | $309,900 | $179 | 67 |
| 129 Skyview Rd | 0.01mi | 3/3.0 (-1) | 1,703 (-12%) | 10mo | $325,000 | $191 | 62 |
| 121 Lilac Ct | 0.60mi | 3/1.5 (-1) | 1,964 (+1%) | 5mo | $252,000 | $128 | 59 |
| 116 Stroud Ct | 0.61mi | 3/2.0 (-1) | 1,904 (-2%) | 13mo | $263,000 | $138 | 53 |
| 144 Westwood | 0.56mi | 3/2.5 (-1) | 2,132 (+10%) | 1mo | $300,000 | $141 | 50 |
| 122 Fairview Dr | 0.38mi | 4/2.5 | 1,680 (-14%) | 11mo | $260,000 | $155 | 48 |
| 157 Mountain Lake Dr | 0.54mi | 3/2.0 (-1) | 2,206 (+14%) | 0mo | $550,000 | $249 | 47 |
| 123 Lakeview Dr | 0.51mi | 3/2.0 (-1) | 2,164 (+11%) | 10mo | $249,000 | $115 | 44 |
| 157 Westwood Dr | 0.56mi | 3/2.0 (-1) | 2,134 (+10%) | 12mo | $275,000 | $129 | 43 |
| 139 Westwood Dr | 0.52mi | 3/3.0 (-1) | 2,200 (+13%) | 8mo | $335,000 | $152 | 38 |
| 136 Hilltop Dr | 0.65mi | 5/2.0 (+1) | 2,100 (+8%) | 16mo | $295,000 | $140 | 38 |
Match score weights: distance 35% · size 25% · config 20% · recency 20%. Top-matched comps best support the ARV.
Projected returns pro-forma
10.0% appreciation · 3.0% rent growth · sell at horizon
- IRR
- 27.9%
- Equity multiple
- 3.21×
- Total profit
- $111,434
- Equity at exit
- $162,158
- IRR
- 24.3%
- Equity multiple
- 7.31×
- Total profit
- $318,099
- Equity at exit
- $349,700
Cash invested: $50,400 (down + closing). Projections, not guarantees.
Landlord ↔ Tenant lean methodology
- Overall (STATE)
- 62 Landlord-Friendly
- State Pennsylvania
- 62 Landlord-Friendly · EVEN
- County
- — inherits STATE
- City
- — inherits STATE
ZIP-level market 18328
- Home prices YoY
- 18.1%
- Active inventory
- 211
- Price-to-rent
- 7.0×
Monthly cashflow live
- Estimated rent
- $2,129 medium interval (Pro) →
- Mortgage (P&I)
- −$944
- Tax from tax record
- −$363 /mo · $4,360/yr
- Insurance
- −$75
- HOA
- −$92
- Vacancy / Maint / Mgmt
- −$447
- Net cashflow
- $208
Break-even live
UW: 25.0% down · 7.5% · 30yr · 1.5% tax · 5.0% vac · 8.0% maint · 8.0% mgmt
Financing live
Cash to close
- Down payment
- $45,000
- Closing costs
- $5,400
- Reserves months
- —
- Total cash needed
- —
Loan-product check · same deal, 3 products live
Conventional
25% down · 7.5% · 30yr
- Down + closing
- —
- Monthly P&I
- —
- Monthly cashflow
- —
- DSCR
- —
- Eligible?
- —
Personal DTI + credit; lowest rate.
DSCR
20% down · 8.5% · 30yr
- Down + closing
- —
- Monthly P&I
- —
- Monthly cashflow
- —
- DSCR
- —
- Eligible?
- —
No personal income docs; deal must DSCR.
Hard money
10% down · 12.0% · 12mo
- Down + closing
- —
- Monthly P&I
- —
- Monthly cashflow
- —
- DSCR
- —
- Eligible?
- —
Short-term bridge; refi at stabilization.
Rent comps 2 comps
| Address | Beds | Baths | Sqft | Rent | $/sqft | DOM | Units | Dist |
|---|---|---|---|---|---|---|---|---|
| 159 Spring Dr Dingmans Ferry, PA | 3.0 | 2.0 | 1920 | $2,000 | $1.04 | 5d | 1 | 0.17mi |
| 368 Wild Acres Dr Dingmans Ferry, PA | 4.0 | 3.0 | 2262 | $3,000 | $1.33 | 1d | 1 | 1.00mi |
HOA detail
- Monthly dues
- $92 · $1,104/yr
Listing history 7 events
-
2026-05-08price $180,000 320-char remark
Show marketing remark (320 chars)
BACK ON THE MARKET - NO FAULT OF THE SELLER! Needs TLC - great investment!! This SPACIOUS 4 bed/ 2 bath / 2 car garage home with circular driveway is positioned in a private location with vacant neighboring lots. This home offers a nice sized kitchen, beautiful sunroom, TWO FIREPLACES, and work space in the basement.
-
2026-05-08status Active 320-char remark
Show marketing remark (320 chars)
BACK ON THE MARKET - NO FAULT OF THE SELLER! Needs TLC - great investment!! This SPACIOUS 4 bed/ 2 bath / 2 car garage home with circular driveway is positioned in a private location with vacant neighboring lots. This home offers a nice sized kitchen, beautiful sunroom, TWO FIREPLACES, and work space in the basement.
-
2026-05-06status Pending 320-char remark
Show marketing remark (320 chars)
BACK ON THE MARKET - NO FAULT OF THE SELLER! Needs TLC - great investment!! This SPACIOUS 4 bed/ 2 bath / 2 car garage home with circular driveway is positioned in a private location with vacant neighboring lots. This home offers a nice sized kitchen, beautiful sunroom, TWO FIREPLACES, and work space in the basement.
-
2026-04-08price $194,999 320-char remark
Show marketing remark (320 chars)
BACK ON THE MARKET - NO FAULT OF THE SELLER! Needs TLC - great investment!! This SPACIOUS 4 bed/ 2 bath / 2 car garage home with circular driveway is positioned in a private location with vacant neighboring lots. This home offers a nice sized kitchen, beautiful sunroom, TWO FIREPLACES, and work space in the basement.
-
2026-03-18price $204,900 320-char remark
Show marketing remark (320 chars)
BACK ON THE MARKET - NO FAULT OF THE SELLER! Needs TLC - great investment!! This SPACIOUS 4 bed/ 2 bath / 2 car garage home with circular driveway is positioned in a private location with vacant neighboring lots. This home offers a nice sized kitchen, beautiful sunroom, TWO FIREPLACES, and work space in the basement.
-
2026-01-21$209,999 Active 320-char remark
Show marketing remark (320 chars)
BACK ON THE MARKET - NO FAULT OF THE SELLER! Needs TLC - great investment!! This SPACIOUS 4 bed/ 2 bath / 2 car garage home with circular driveway is positioned in a private location with vacant neighboring lots. This home offers a nice sized kitchen, beautiful sunroom, TWO FIREPLACES, and work space in the basement.
-
2019-01-31soldstatus $54,413
ⓘ Source: listings_history table (triggers on properties + properties_extension) + one-shot
backfill from property_details.listing_events for pre-trigger history.
Tax reassessment forecast PA · Partial reset (capped growth)
- Current annual tax
- $4,360 · $363/mo
- Projected year-2 tax
- $4,360 · $363/mo
- Expected delta
- $0/yr ($0/mo · 0.0%)
ⓘ Screening estimate from a state-policy table — verify with the county assessor before closing.
Climate risk First Street
- Flood 1/10 Low FEMA zone X (unshaded) · 0% chance over 30 yrs
- Wildfire 4/10 Moderate
- Heat 3/10 Moderate 7 d/yr ≥95°F today · 15 d/yr by 30 yrs out
- Wind 4/10 Moderate 8% chance of damaging wind over 30 yrs
- Air quality 2/10 Low 1 unhealthy d/yr today · 2 by 30 yrs out
Nearby sold comps map
Loading sold comps map…
Walkable amenities ~0.75 mi
Loading nearby amenities…
Taxation est. · year 1
- Rental income
- $25,549
- − Mortgage interest
- −$10,083
- − Property taxes
- −$4,360
- − Insurance
- −$900
- − Repairs & maintenance
- −$2,044
- − Management
- −$2,044
- − HOA
- −$1,104
- − Depreciation
- −$5,236
- Taxable loss
- −$222
- Est. tax savings @ 24.0%
- +$53
- After-tax cash flow
- $2,546/yr
For passive investors: Depreciation is non-cash, so a rental often shows a tax loss while cash-flowing — sheltering income. Rental losses are passive: they offset passive income freely, and up to $25,000/yr can offset ordinary (W-2) income if you actively participate and your MAGI is under $100k (phasing out to $0 by $150k); unused losses carry forward. On sale, claimed depreciation is recaptured at up to 25%, and gains may owe capital-gains tax (a 1031 exchange can defer both). Figures are a year-1 estimate at your 24.0% rate — not tax advice; consult a CPA.
Schools (NCES district)
- District
- Delaware Valley SD
- NCES district ID
- 4207530
- Math proficiency
- 41% ▼ -12.00%
- Reading proficiency
- 66% ▼ -9.00%
- Median HH income
- $64,202
- Composite
- 46.95/100
- National rank
- #2359
- State rank
- #121 of 539 in PA
Livability — Pocono Ranch Lands
- Score
- 66/100
- State rank
- #1037
- US rank
- #11566
Category grades
Schools grade is shown separately in the Schools card above.
Census & demographics
- Population (ZIP)
- 8,061
Population outlook (Pike County) Hauer SSP2
- Today (2025)
- 53,548 people
- By 2030
- 51,622 · -3.6%
- By 2040
- 46,490 · -13.2%
- By 2050
- 40,372 · -24.6%
- By 2075
- 31,951 · -40.3%
- By 2100
- 26,821 · -49.9%
Race, ethnicity, and origin ACS 2023
- Neighborhood character
- Predominantly White (85%)
- Race & ethnicity
- White 85% Hispanic / Latino 10% Two or more races 8%
- Hispanic origin (detail)
- Puerto Rican 5%
- Common ancestry
- Scotch-Irish 6% Romanian 6% Iranian 4%
- Foreign-born
- 9% · Canada, Jamaica
- Languages at home
- 86% English-only · Spanish 6% Russian/Polish/Slavic 5% Other Indo-European 2%
Political lean MEDSL · Pike
- 2024 margin
- Strong R (+24.1) · D 37.6% · R 61.6%
- 2008→2024 swing
- -19.8pp toward R · 2008: -4.2pp · 2024: -24.1pp
- All cycles
- 2024: R+24.1 2020: R+19.0 2016: R+26.0 2012: R+11.0 2008: R+4.2
Not yet ingested
- Civics
- —
Market trends
- HPI YoY
- ▲ 38.13%
- Current HPI
- 248.4494
- Rent YoY
- —
- Metro
- —
- State GDP YoY
- ▲ 1.68%
- F500 in state
- 34
Industry mix (Fortune 500 HQ in PA)
| Industry | F500 HQs | Revenue |
|---|---|---|
| Healthcare | 2 | $309B |
|
||
| Insurance | 2 | $27B |
|
||
| Telecommunications / Media | 1 | $124B |
|
||
| Industrial Distribution | 1 | $22B |
|
||
| Financial Services | 1 | $20B |
|
||
| Chemicals / Materials | 1 | $18B |
|
||
Price history
+230.8% since first listed7 events — show timeline
- 2026-05-08 Price Changed $180,000 PMAR
- 2026-05-08 Relisted — PMAR
- 2026-05-06 Pending — PMAR
- 2026-04-08 Price Changed $194,999 PMAR
- 2026-03-18 Price Changed $204,900 PMAR
- 2026-01-21 Listed $209,999 PMAR
- 2019-01-31 Sold (Public Records) $54,413 Public Records
Property tax history
+1.7%/yrLatest (2026): $4,360 · +1.5% YoY. Source: county tax records.
Cash-flow waterfall
monthlySold comps — $/sqft
last 12 mo · ≤1 miLoading sold comps…