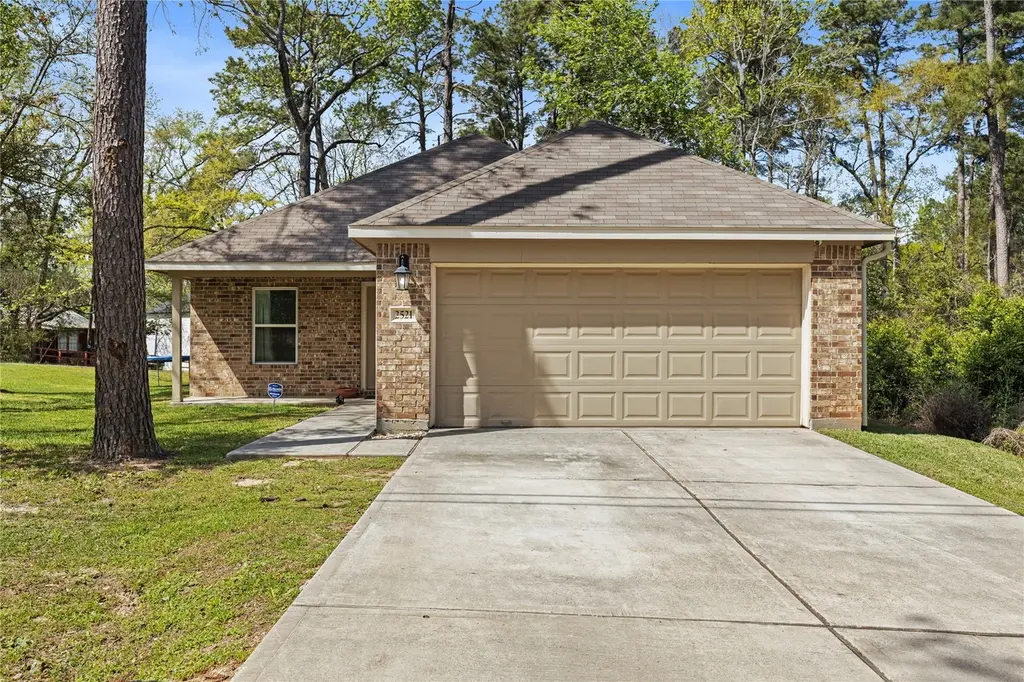
2521 Papoose Trl · Willis, TX
Flood risk 1/10 · Minimal
- FEMA flood zone
- X (unshaded)
- Chance of flooding over 30 yrs
- 0.0%
- Est. flood insurance / yr
- $507 – $1,088
Fire risk 5/10 · Moderate
- Est. fire insurance / yr
- $1,222 – $2,270
Heat risk 8/10 · Major
- Hot days now (above 111°F)
- 7 days/yr
- Hot days in 30 yrs
- 22 days/yr
Wind risk 8/10 · Major
- Chance of severe wind over 30 yrs
- 99.0%
Air-quality risk 2/10 · Minimal
- Unhealthy air days now
- 1 days/yr
- Unhealthy air days in 30 yrs
- 1 days/yr
Risk factors via First Street. Map © Google.
Why this score? — see what drove the D+ grade
The composite is a weighted blend of 9 inputs, each scored 0–100. Each bar is that input's sub-score; the figure is the points it added to the 100-point composite (weight × sub-score).
- Cash flow +14.8/30.0
- ARV discount +13.2/15.0
- DSCR +4.5/10.0
- 1% rule +4.4/10.0
- Schools +3.2/10.0
- Livability +3.1/5.0
- Rent growth +2.7/5.0
- Condition / age +2.5/5.0
- Appreciation +0.9/10.0
$189,999
🖨 Deal sheet 📄 Offer letter ✓ Due diligence
Listing remarks MLS
Charming 3-bedroom, 2-bath home featuring a bright open-concept living area that seamlessly connects the kitchen, dining, and living spaces, perfect for both everyday living and entertaining. The cozy bedrooms offer a comfortable retreat, while the spacious primary suite includes a private ensuite bath for added convenience and relaxation. This home boasts a warm and inviting layout with great natural light and functional flow throughout. Whether you're hosting guests or enjoying a quiet night in, this property offers the perfect blend of comfort and livability. A wonderful place to call home, don’t miss it!
Key facts
- 8,102 sq ft lot
- 2 garage spots
- Built 2019
Neighborhood map
What this means for you Summary
Snapshot
- This is a 3-bed/2.0-bath single-family listed at $190k.
Deal economics
- At list price, monthly cash flow is $53 ($634/yr) — positive.
- The deal already cash-flows at list — no discount required.
- To meet the 1% rule (rent ≥ 1% of price), the offer needs to be $179k (5.6% below list).
- Recommended offer: $179k (6.0% below list) — sets the bar for market timing.
- Cap rate 6.6% vs local median 4.7% in Willis — top-decile yield for the area; either an underpriced asset or a hidden risk that comps aren't pricing in. Stress-test before assuming the spread holds.
Location & tenants
- Location reads 62/100 on livability (#933 in TX) — a middle-class / working-renter tenant base. Strengths: cost of living A+, housing A+; Watch: crime C-, schools D+, employment D+.
- Willis ISD (rural): math 33% / reading 40% proficiency, ranked #458 of 826 in TX (top 55%) — families likely to look elsewhere, expect single-tenant / working-renter base with shorter leases.
- Market conditions: Rents flat; 710 active listings in the ZIP; 1 comparable units currently listed for rent nearby; 13,259 units permitted in Montgomery County in 2024 (1,402 in 5+ unit buildings).
- This rent runs 30% of the median local income ($71k/yr) — at the standard rent-burdened threshold; future hikes will face affordability resistance.
Forward outlook
- Local home prices are declining (-3.0%/yr); year-one equity from $1k of loan paydown is wiped out by about $6k of value loss. Plan a longer hold.
- Montgomery County population projected at +65% by 2050 — long-run rental-demand tailwind backs the buy-and-hold thesis.
Negotiation context
- It's been on market 87 days — a 6% lower offer ($179k) is reasonable based on typical stale-listing flexibility.
- 2 sale attempts since 7y ago; this cycle's ask has dropped $20k (10%) from the opening price — seller is motivated, your offer sets the floor, not the list.
Risks & watch-outs
- Climate carrying-cost: severe wind risk, 99% chance of damaging wind over 30y; moderate wildfire risk; extreme-heat days projected 7→22/yr by 2055 (HVAC capex compounding) — expect insurance premiums to compound above CPI over the hold.
Questions for the listing agent
- It's been on market 87 days. Have you received any prior offers? Is the seller open to a 6% concession, seller financing, or rate buy-down credit?
- What does the HOA fee cover, when was the last increase, and are there any pending special assessments or reserve-fund shortfalls?
- Why hasn't it sold? Are there any deal-killer items the seller is aware of (foundation, flood, title, zoning, code violations)?
- Is there a deadline driving the sale (1031 exchange, divorce, estate, relocation)? That informs how much negotiation room exists.
- Schools are D-rated, which usually means shorter tenancies and higher turnover. Who's the typical renter profile here, and what's been the actual vacancy rate?
- The area grade is low — what's the realistic commute time and amenity access for the typical tenant pool here? Any planned neighborhood developments (good or bad) we should know about?
- What's the average days-on-market for RENTAL listings here right now (not sales)? A rising rental-DOM trend means longer vacancies and softer asking-rent achievability than the comps imply.
- What's the recent tenant-quality profile in this submarket — average credit score on applications, eviction rate, late-payment / NSF rate, and stable-employment percentage? A property-management company in the area should have these aggregated.
- How much new for-sale + rental construction is in the pipeline within 1–3 miles? Heavy new supply typically softens prices + rents 12–24 months out; constrained supply supports both.
Investment metrics
- 1% rule
- 0.94% ✗
- Cap rate
- 6.63%
- Cash-on-cash
- 1.19%
- DSCR
- 1.05
- GRM
- 8.8
CMA / ARV
- ARV (median comp)
- $217,534
- List price
- $189,999
- Delta
- -12.66%
- Verdict
- UNDERPRICED
- Comps
- 20 within 1.0 mi
Show comp detail 12 sales within ~0.75 mi
| Address | Dist | Beds/Ba | Sqft | Sold | Price | $/sf | Match |
|---|---|---|---|---|---|---|---|
| 115 Indian Creek Cir | 0.14mi | 3/2.0 | 1,250 (+1%) | 6mo | $217,000 | $174 | 86 |
| 15123 Arrowhead Loop E | 0.21mi | 3/2.0 | 1,200 (-3%) | 1mo | $218,800 | $182 | 85 |
| 3507 Sam Houston Rd | 0.40mi | 3/2.0 | 1,230 (-0%) | 1mo | $219,999 | $179 | 80 |
| 15119 Arrowhead Loop Rd E | 0.21mi | 3/2.0 | 1,300 (+5%) | 3mo | $232,600 | $179 | 79 |
| 14882 Big Springs Cir | 0.16mi | 3/2.0 | 1,341 (+9%) | 4mo | $228,888 | $171 | 74 |
| 14951 Colt Ln | 0.30mi | 3/2.0 | 1,140 (-8%) | 4mo | $200,000 | $175 | 71 |
| 2442 Mohawk Bnd | 0.43mi | 3/2.0 | 1,303 (+6%) | 4mo | $229,900 | $176 | 68 |
| 15451 Arrowhead Loop Dr W | 0.45mi | 3/2.5 | 1,324 (+7%) | 3mo | $219,900 | $166 | 62 |
| 15255 Austin Rd | 0.60mi | 2/2.0 (-1) | 1,200 (-3%) | 3mo | $200,000 | $167 | 60 |
| 3435 Sam Houston Rd | 0.38mi | 3/2.0 | 1,378 (+12%) | 5mo | $250,000 | $181 | 59 |
| 3975 Sam Houston Rd | 0.60mi | 3/2.5 | 1,341 (+9%) | 1mo | $219,600 | $164 | 54 |
| 15113 Austin | 0.54mi | 3/2.0 | 1,383 (+12%) | 1mo | $239,900 | $173 | 54 |
Match score weights: distance 35% · size 25% · config 20% · recency 20%. Top-matched comps best support the ARV.
Projected returns pro-forma
-3.0% appreciation · 0.98% rent growth · sell at horizon
- IRR
- -16.7%
- Equity multiple
- 0.42×
- Total profit
- $-30,940
- Equity at exit
- $28,329
- IRR
- -12.9%
- Equity multiple
- 0.31×
- Total profit
- $-36,458
- Equity at exit
- $16,428
Cash invested: $53,200 (down + closing). Projections, not guarantees.
Landlord ↔ Tenant lean methodology
- Overall (STATE)
- 87 Strongly Landlord-Friendly
- State Texas
- 87 Strongly Landlord-Friendly · R+5
- County
- — inherits STATE
- City
- — inherits STATE
ZIP-level market 77378
- Home prices YoY
- -3.0%
- Rents YoY
- 1.0%
- Active inventory
- 710
- Price-to-rent
- 8.8×
Monthly cashflow live
- Estimated rent
- $1,794 medium interval (Pro) →
- Mortgage (P&I)
- −$996
- Tax from tax record
- −$279 /mo · $3,351/yr
- Insurance
- −$79
- HOA
- −$10
- Vacancy / Maint / Mgmt
- −$377
- Net cashflow
- $53
Break-even live
UW: 25.0% down · 7.5% · 30yr · 1.5% tax · 5.0% vac · 8.0% maint · 8.0% mgmt
Financing live
Cash to close
- Down payment
- $47,500
- Closing costs
- $5,700
- Reserves months
- —
- Total cash needed
- —
Loan-product check · same deal, 3 products live
Conventional
25% down · 7.5% · 30yr
- Down + closing
- —
- Monthly P&I
- —
- Monthly cashflow
- —
- DSCR
- —
- Eligible?
- —
Personal DTI + credit; lowest rate.
DSCR
20% down · 8.5% · 30yr
- Down + closing
- —
- Monthly P&I
- —
- Monthly cashflow
- —
- DSCR
- —
- Eligible?
- —
No personal income docs; deal must DSCR.
Hard money
10% down · 12.0% · 12mo
- Down + closing
- —
- Monthly P&I
- —
- Monthly cashflow
- —
- DSCR
- —
- Eligible?
- —
Short-term bridge; refi at stabilization.
Rent comps 1 comps
| Address | Beds | Baths | Sqft | Rent | $/sqft | DOM | Units | Dist |
|---|---|---|---|---|---|---|---|---|
| 15309 Coaltown Rd Willis, TX | 3.0 | 2.0 | 1200 | $1,445 | $1.20 | 24d | 1 | 0.31mi |
HOA detail
- Monthly dues
- $10 · $120/yr
Listing history 23 events
-
2026-06-18status $189,999 Pending 87 DOM
-
2026-06-18days on market $189,999 Active 87 DOM
-
2026-06-17days on market $189,999 Active 86 DOM
-
2026-06-16days on market $189,999 Active 85 DOM
-
2026-06-15days on market $189,999 Active 84 DOM
-
2026-06-13pricedays on market $189,999 Active 82 DOM
-
2026-06-09days on market $199,999 Active 78 DOM
-
2026-06-08days on market $199,999 Active 77 DOM
-
2026-06-07days on market $199,999 Active 76 DOM
-
2026-06-04days on market $199,999 Active 73 DOM
-
2026-06-03days on market $199,999 Active 72 DOM
-
2026-06-02days on market $199,999 Active 71 DOM
-
2026-06-01days on market $199,999 Active 70 DOM
-
2026-05-31days on market $199,999 Active 69 DOM
-
2026-04-16price $199,999 621-char remark
Show marketing remark (621 chars)
Charming 3-bedroom, 2-bath home featuring a bright open-concept living area that seamlessly connects the kitchen, dining, and living spaces, perfect for both everyday living and entertaining. The cozy bedrooms offer a comfortable retreat, while the spacious primary suite includes a private ensuite bath for added convenience and relaxation. This home boasts a warm and inviting layout with great natural light and functional flow throughout. Whether you're hosting guests or enjoying a quiet night in, this property offers the perfect blend of comfort and livability. A wonderful place to call home, don’t miss it!
-
2026-03-23$210,000 Active 621-char remark
Show marketing remark (621 chars)
Charming 3-bedroom, 2-bath home featuring a bright open-concept living area that seamlessly connects the kitchen, dining, and living spaces, perfect for both everyday living and entertaining. The cozy bedrooms offer a comfortable retreat, while the spacious primary suite includes a private ensuite bath for added convenience and relaxation. This home boasts a warm and inviting layout with great natural light and functional flow throughout. Whether you're hosting guests or enjoying a quiet night in, this property offers the perfect blend of comfort and livability. A wonderful place to call home, don’t miss it!
-
2020-01-31soldstatus Sold 68-char remark
Show marketing remark (68 chars)
Call Today for limited New ASGi Homes in Willis! READY MID-NOVEMBER!
-
2019-12-03status Pending 68-char remark
Show marketing remark (68 chars)
Call Today for limited New ASGi Homes in Willis! READY MID-NOVEMBER!
-
2019-11-14price $156,200 68-char remark
Show marketing remark (68 chars)
Call Today for limited New ASGi Homes in Willis! READY MID-NOVEMBER!
-
2019-10-31price $155,000 68-char remark
Show marketing remark (68 chars)
Call Today for limited New ASGi Homes in Willis! READY MID-NOVEMBER!
-
2019-08-06$150,000 Active 68-char remark
Show marketing remark (68 chars)
Call Today for limited New ASGi Homes in Willis! READY MID-NOVEMBER!
-
2018-12-11soldstatus
-
1992-03-01soldstatus
ⓘ Source: listings_history table (triggers on properties + properties_extension) + one-shot
backfill from property_details.listing_events for pre-trigger history.
Tax reassessment forecast TX · Resets to sale price
- Current annual tax
- $3,351 · $279/mo
- Projected year-2 tax
- $3,477 · $290/mo
- Expected delta
- +$126/yr (+$10/mo · 3.8%)
ⓘ Screening estimate from a state-policy table — verify with the county assessor before closing.
Climate risk First Street
- Flood 1/10 Low FEMA zone X (unshaded) · 0% chance over 30 yrs
- Wildfire 5/10 Major
- Heat 8/10 Severe 7 d/yr ≥111°F today · 22 d/yr by 30 yrs out
- Wind 8/10 Severe 99% chance of damaging wind over 30 yrs
- Air quality 2/10 Low 1 unhealthy d/yr today · 1 by 30 yrs out
Nearby sold comps map
Loading sold comps map…
Walkable amenities ~0.75 mi
Loading nearby amenities…
Taxation est. · year 1
- Rental income
- $21,534
- − Mortgage interest
- −$10,643
- − Property taxes
- −$3,351
- − Insurance
- −$950
- − Repairs & maintenance
- −$1,723
- − Management
- −$1,723
- − HOA
- −$120
- − Depreciation
- −$5,527
- Taxable loss
- −$2,503
- Est. tax savings @ 24.0%
- +$601
- After-tax cash flow
- $1,235/yr
For passive investors: Depreciation is non-cash, so a rental often shows a tax loss while cash-flowing — sheltering income. Rental losses are passive: they offset passive income freely, and up to $25,000/yr can offset ordinary (W-2) income if you actively participate and your MAGI is under $100k (phasing out to $0 by $150k); unused losses carry forward. On sale, claimed depreciation is recaptured at up to 25%, and gains may owe capital-gains tax (a 1031 exchange can defer both). Figures are a year-1 estimate at your 24.0% rate — not tax advice; consult a CPA.
Schools (NCES district)
- District
- Willis ISD
- NCES district ID
- 4845900
- Math proficiency
- 33% ▼ -15.00%
- Reading proficiency
- 40% ▼ -2.00%
- Median HH income
- $57,828
- Composite
- 32.32/100
- National rank
- #5746
- State rank
- #458 of 826 in TX
Livability — Willis
- Score
- 62/100
- State rank
- #933
- US rank
- #16579
Category grades
Schools grade is shown separately in the Schools card above.
Census & demographics
- County
- Montgomery County · 663,713 people
- City population
- 38,421
- Metro
- Houston-The Woodlands-Sugar Land, TX
- Population (ZIP)
- 17,629
- Household income
- $71,143
- Rent vs Own
- Severe rent burden
- 402.0
Population outlook (Montgomery County) Hauer SSP2
- Today (2025)
- 713,896 people
- By 2030
- 805,263 · +12.8%
- By 2040
- 992,708 · +39.1%
- By 2050
- 1,179,590 · +65.2%
- By 2075
- 1,628,084 · +128.1%
- By 2100
- 1,937,880 · +171.5%
Race, ethnicity, and origin ACS 2023
- Neighborhood character
- Diverse neighborhood (Simpson 0.55)
- Race & ethnicity
- White 58% Hispanic / Latino 32% Two or more races 14% Black 7% Native American 1%
- Hispanic origin (detail)
- Mexican 27%
- Common ancestry
- Romanian 2% Slovak 2% Serbian 1%
- Foreign-born
- 12% · Canada
- Languages at home
- 80% English-only · Spanish 19%
Political lean MEDSL · Montgomery
- 2024 margin
- Solid R (+45.5) · D 26.8% · R 72.3%
- 2008→2024 swing
- +7.2pp toward D · 2008: -52.7pp · 2024: -45.5pp
- All cycles
- 2024: R+45.5 2020: R+43.8 2016: R+51.4 2012: R+60.7 2008: R+52.7
Not yet ingested
- Civics
- —
Market trends
- HPI YoY
- ▼ -8.25%
- Current HPI
- 261.9673
- Rent YoY
- ▲ 0.98%
- Metro
- Houston-The Woodlands-Sugar Land, TX
- State GDP YoY
- ▲ 3.95%
- F500 in state
- 110
Industry mix (Fortune 500 HQ in TX)
| Industry | F500 HQs | Revenue |
|---|---|---|
| Energy | 16 | $1,198B |
|
||
| Technology | 5 | $198B |
|
||
| Engineering / Construction | 4 | $72B |
|
||
| Energy Services | 3 | $60B |
|
||
| Utilities | 3 | $41B |
|
||
| Healthcare | 2 | $330B |
|
||
Price history
+33.3% since first listed9 events — show timeline
- 2026-04-16 Price Changed $199,999 HARMLS
- 2026-03-23 Listed $210,000 HARMLS
- 2020-01-31 Sold (MLS) — HARMLS
- 2019-12-03 Pending — HARMLS
- 2019-11-14 Price Changed $156,200 HARMLS
- 2019-10-31 Price Changed $155,000 HARMLS
- 2019-08-06 Listed $150,000 HARMLS
- 2018-12-11 Sold (Public Records) — Public Records
- 1992-03-01 Sold (Public Records) — Public Records
Property tax history
+30.6%/yrLatest (2025): $3,351 · -1.5% YoY. Source: county tax records.
Cash-flow waterfall
monthlySold comps — $/sqft
last 12 mo · ≤1 miLoading sold comps…