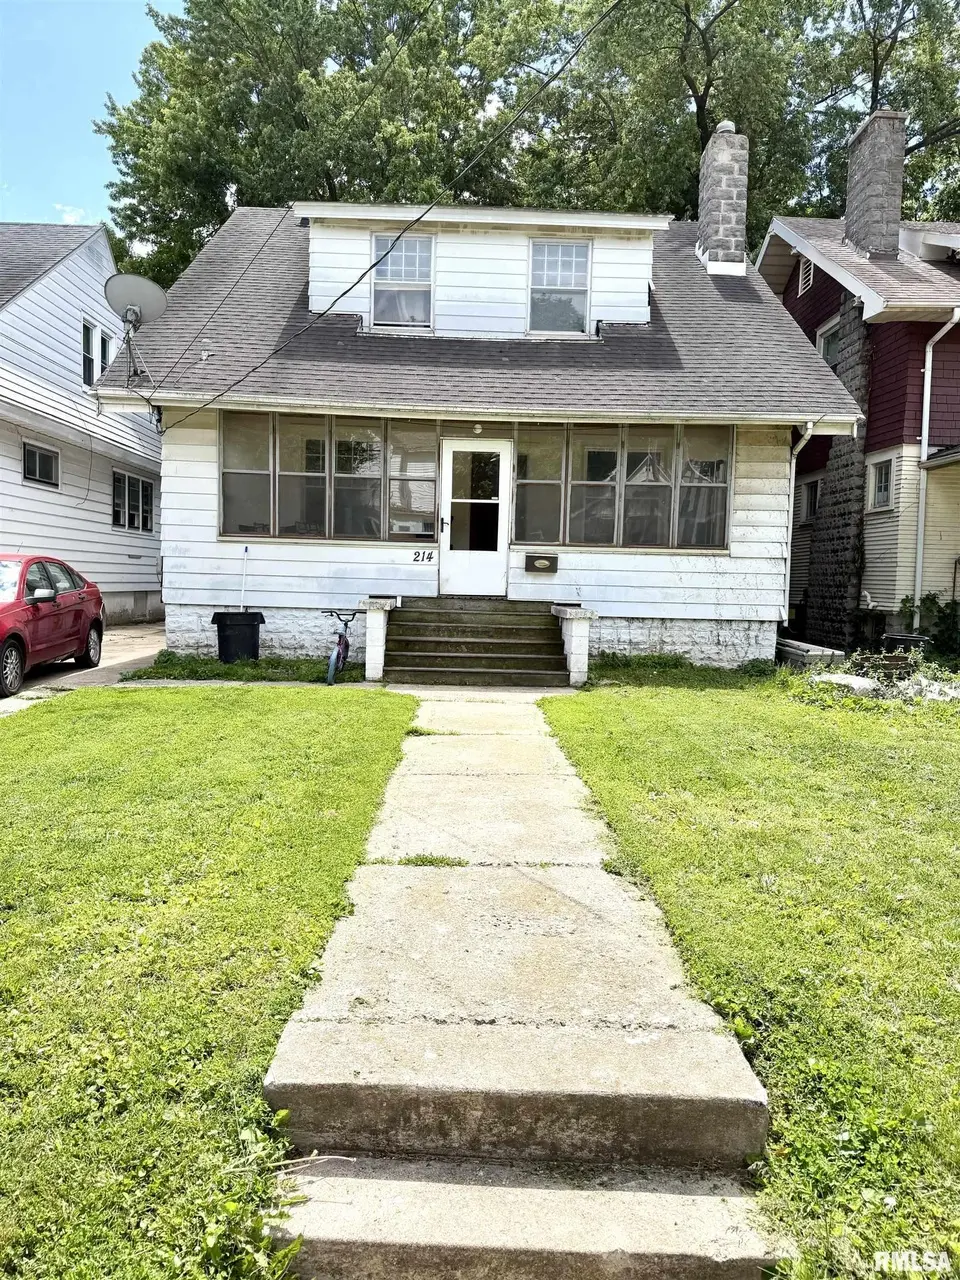
214 E Thrush Ave · Peoria, IL
Flood risk 6/10 · Moderate
- FEMA flood zone
- X
- Chance of flooding over 30 yrs
- 0.69%
- Est. flood insurance / yr
- $473 – $860
Fire risk 1/10 · Minimal
- Est. fire insurance / yr
- $804 – $1,492
Heat risk 3/10 · Minor
- Hot days now (above 105°F)
- 7 days/yr
- Hot days in 30 yrs
- 18 days/yr
Wind risk 2/10 · Minimal
- Chance of severe wind over 30 yrs
- 1.0%
Air-quality risk 3/10 · Minor
- Unhealthy air days now
- 1 days/yr
- Unhealthy air days in 30 yrs
- 3 days/yr
Risk factors via First Street. Map © Google.
Why this score? — see what drove the B- grade
The composite is a weighted blend of 9 inputs, each scored 0–100. Each bar is that input's sub-score; the figure is the points it added to the 100-point composite (weight × sub-score).
- Cash flow +30.0/30.0
- 1% rule +10.0/10.0
- DSCR +10.0/10.0
- ARV discount +7.0/15.0
- Livability +3.7/5.0
- Rent growth +3.4/5.0
- Condition / age +2.5/5.0
- Schools +1.1/10.0
- Appreciation +0.0/10.0
$50,500
🖨 Deal sheet 📄 Offer letter ✓ Due diligence
Listing remarks
Generous sized three bedroom in Peoria's East Bluff. One being on the main floor. No closet. Natural wood floors and stained glass windows. Featuring a bountiful yard and an enclosed front porch. This property also has a dry basement, providing additional options. Ideal for buyers seeking home ownership at costs comparable or lower than rent or a savvy investor. Call your agent! Seller will provide credit for paint and or flooring with acceptable offer.
Key facts
- Natural wood floors
- Bountiful yard
- Enclosed front porch
Tags
Property features AI
Exterior
- Parking: Detached parking; On-street parking available; Alley access
- Utilities: Public water; Public sewer
- Home design: Single-family residence; Approximately 1,600 total building area; Built in 1924
- Construction: Shingle roof; Full basement
- Exterior features: Shingle roof; Level lot; Lot dimensions approximately 34 x 146
Interior
- Kitchen: Refrigerator; Microwave
- Bedrooms: Three bedrooms: Bedroom 1 (upper level, ~15 x 12, carpet, egress window), Bedroom 2 (upper level, ~13 x 11, carpet, egress window), Bedroom 3 (main level, ~11 x 10, carpet, egress window)
- Flooring: Hardwood in living and dining areas; Tile in kitchen; Carpet in bedrooms; Other flooring in basement laundry
- Bathrooms: One full bathroom; One half bathroom
- Heating & cooling: Gas water heater; No central cooling
- Interior features: Cable available; Ceiling fan(s); High-speed internet; Wood-burning fireplace (1)
- Laundry & utility: Washer; Dryer; Basement laundry area
Neighborhood map
What this means for you Summary
Snapshot
- This is a 3-bed/1.5-bath single-family listed at $50k.
Deal economics
- At list price, monthly cash flow is $498 ($6k/yr) — positive.
- The deal already cash-flows at list — no discount required.
- Meets the 1% rule at list price ($1k rent vs $50k).
- Recommended offer: $49k (3.0% below list) — sets the bar for market timing.
- Cap rate 18.1% vs local median 5.6% in Peoria — top-decile yield for the area; either an underpriced asset or a hidden risk that comps aren't pricing in. Stress-test before assuming the spread holds.
Location & tenants
- Location reads 73/100 on livability (#270 in IL) — a middle-class / working-renter tenant base. Strengths: commute A+, cost of living A+, housing A+; Watch: employment D+, crime F.
- Peoria SD 150 (urban): math 11% / reading 14% proficiency, ranked #554 of 620 in IL (top 89%) — low school quality limits family demand, transient renter base, plan for 1-2y turnover; 70% free/reduced lunch — lower-income household profile, screen leases tightly.
- Zoned schools: Glen Oak Comm Learning Cntr (math 0% / reading 0%, grade F, #2,056 of 2,056 statewide, top 100%, 709 students, 0% FRL); Peoria High School (math 4% / reading 7%, grade F, #609 of 693 statewide, top 88%, 1,447 students, 0% FRL) — zoned schools average 0% FRL vs 70% district-wide (70 pts lower); this property's tenant base skews higher-income than the district average.
- Market conditions: Rents rising (+3.5%/yr); 104 active listings in the ZIP; 24 comparable units currently listed for rent nearby; rentals at typical pace (median 22d on market — plan ~3-4 weeks tenant-placement turnaround); lower-income renter base — watch delinquency; 73 units permitted in Peoria County in 2024 (0 in 5+ unit buildings).
- This rent runs 32% of the median local income ($42k/yr) — at the standard rent-burdened threshold; future hikes will face affordability resistance.
Forward outlook
- Local home prices are declining (-3.0%/yr); year-one equity from $349 of loan paydown is wiped out by about $2k of value loss. Plan a longer hold.
- Peoria County population projected at -11% by 2050 — secular population decline; favor cash flow + early exit over multi-decade hold.
- At projected returns (-3.0% appreciation + 3.5% rent growth), your $14k cash investment doubles in ~3 years — after that, you're playing with house money.
Negotiation context
- It's been on market 37 days — a 3% lower offer ($49k) is reasonable based on typical stale-listing flexibility.
- 2 sale attempts since 25y ago; this cycle's ask has dropped $7k (12%) from the opening price — seller is motivated, your offer sets the floor, not the list.
Risks & watch-outs
- Watch-outs: built in 1924 — expect roof / HVAC / electrical / plumbing capex.
- Climate carrying-cost: major flood risk — expect insurance premiums to compound above CPI over the hold.
Questions for the listing agent
- It's been on market 37 days. Have you received any prior offers? Is the seller open to a 3% concession, seller financing, or rate buy-down credit?
- Built in 1924 — when were the roof, HVAC, electrical panel, plumbing, and water heater last replaced?
- Is there a deadline driving the sale (1031 exchange, divorce, estate, relocation)? That informs how much negotiation room exists.
- Schools are F-rated, which usually means shorter tenancies and higher turnover. Who's the typical renter profile here, and what's been the actual vacancy rate?
- Crime grade is F in this area — have there been break-ins, vandalism, or insurance claims at this property in the last 3 years? What carrier currently insures it and at what premium?
- What's the average days-on-market for RENTAL listings here right now (not sales)? A rising rental-DOM trend means longer vacancies and softer asking-rent achievability than the comps imply.
- What's the recent tenant-quality profile in this submarket — average credit score on applications, eviction rate, late-payment / NSF rate, and stable-employment percentage? A property-management company in the area should have these aggregated.
- How much new for-sale + rental construction is in the pipeline within 1–3 miles? Heavy new supply typically softens prices + rents 12–24 months out; constrained supply supports both.
Investment metrics
- 1% rule
- 2.19% ✓
- Cap rate
- 18.14%
- Cash-on-cash
- 42.30%
- DSCR
- 2.88
- GRM
- 3.8
CMA / ARV
- ARV (median comp)
- $49,940
- List price
- $50,500
- Delta
- 1.12%
- Verdict
- FAIR
- Comps
- 20 within 1.0 mi
Show comp detail 12 sales within ~0.75 mi
| Address | Dist | Beds/Ba | Sqft | Sold | Price | $/sf | Match |
|---|---|---|---|---|---|---|---|
| 2206 N Wisconsin Ave | 0.41mi | 3/2.0 | 1,217 (+1%) | 0mo | $30,000 | $25 | 77 |
| 908 E Behrends Ave | 0.60mi | 3/1.5 | 1,240 (+3%) | 1mo | $65,000 | $52 | 67 |
| 510 W Gift Ave | 0.60mi | 3/1.0 | 1,224 (+2%) | 2mo | $115,575 | $94 | 66 |
| 718 E Behrends Ave | 0.49mi | 3/1.0 | 1,140 (-5%) | 2mo | $71,000 | $62 | 65 |
| 2208 N Ellis St | 0.54mi | 3/2.0 | 1,261 (+5%) | 3mo | $44,000 | $35 | 63 |
| 2312 N Ellis St | 0.55mi | 3/1.0 | 1,258 (+4%) | 3mo | $44,000 | $35 | 63 |
| 2136 N Delaware St | 0.49mi | 3/1.0 | 1,130 (-6%) | 3mo | $47,500 | $42 | 62 |
| 2211 N Ellis St | 0.56mi | 3/1.0 | 1,127 (-6%) | 1mo | $33,000 | $29 | 60 |
| 308 E Corrington Ave | 0.54mi | 2/1.0 (-1) | 1,284 (+7%) | 2mo | $94,600 | $74 | 55 |
| 2635 N Peoria Ave | 0.41mi | 3/1.0 | 1,366 (+13%) | 2mo | $93,000 | $68 | 55 |
| 504 W Archer Ave | 0.52mi | 3/1.0 | 1,344 (+12%) | 3mo | $26,000 | $19 | 52 |
| 518 W Willcox Ave | 0.69mi | 3/1.0 | 1,334 (+11%) | 3mo | $107,500 | $81 | 45 |
Match score weights: distance 35% · size 25% · config 20% · recency 20%. Top-matched comps best support the ARV.
Projected returns pro-forma
-3.0% appreciation · 3.49% rent growth · sell at horizon
- IRR
- 39.6%
- Equity multiple
- 2.71×
- Total profit
- $24,143
- Equity at exit
- $7,530
- IRR
- 46.2%
- Equity multiple
- 5.55×
- Total profit
- $64,302
- Equity at exit
- $4,366
Cash invested: $14,140 (down + closing). Projections, not guarantees.
Landlord ↔ Tenant lean methodology
- Overall (STATE)
- 43 Moderately Tenant-Leaning
- State Illinois
- 43 Moderately Tenant-Leaning · D+7
- County
- — inherits STATE
- City
- — inherits STATE
ZIP-level market 61603
- Home prices YoY
- -31.8%
- Rents YoY
- 3.5%
- Active inventory
- 104
- Price-to-rent
- 3.8×
Monthly cashflow live
- Estimated rent
- $1,105 high interval (Pro) →
- Mortgage (P&I)
- −$265
- Tax from tax record
- −$89 /mo · $1,068/yr
- Insurance
- −$21
- HOA
- −$0
- Vacancy / Maint / Mgmt
- −$232
- Net cashflow
- $498
Break-even live
UW: 25.0% down · 7.5% · 30yr · 1.5% tax · 5.0% vac · 8.0% maint · 8.0% mgmt
Financing live
Cash to close
- Down payment
- $12,625
- Closing costs
- $1,515
- Reserves months
- —
- Total cash needed
- —
Loan-product check · same deal, 3 products live
Conventional
25% down · 7.5% · 30yr
- Down + closing
- —
- Monthly P&I
- —
- Monthly cashflow
- —
- DSCR
- —
- Eligible?
- —
Personal DTI + credit; lowest rate.
DSCR
20% down · 8.5% · 30yr
- Down + closing
- —
- Monthly P&I
- —
- Monthly cashflow
- —
- DSCR
- —
- Eligible?
- —
No personal income docs; deal must DSCR.
Hard money
10% down · 12.0% · 12mo
- Down + closing
- —
- Monthly P&I
- —
- Monthly cashflow
- —
- DSCR
- —
- Eligible?
- —
Short-term bridge; refi at stabilization.
Rent comps 24 comps
| Address | Beds | Baths | Sqft | Rent | $/sqft | DOM | Units | Dist |
|---|---|---|---|---|---|---|---|---|
| 2210 Knoxville Ave #2212 Peoria, IL | 2.0 | 1.0 | 1284 | $950 | $0.74 | 44d | 1 | 0.11mi |
| 308 E Archer Ave Peoria, IL | 3.0 | 1.0 | 1444 | $950 | $0.66 | 13d | 1 | 0.16mi |
| 505 E Virginia Ave Peoria, IL | 2.0 | 2.0 | 1204 | $758 | $0.63 | 13d | 1 | 0.37mi |
| 737 E Gift Ave Unit 737 Peoria, IL | 2.0 | 1.0 | 800 | $1,125 | $1.41 | 44d | 1 | 0.55mi |
| 2207 N Ellis St Peoria, IL | 2.0 | 1.0 | 864 | $999 | $1.16 | 13d | 1 | 0.55mi |
| 901 NE Glen Oak Ave Unit 2 Peoria, IL | 3.0 | 1.0 | 1120 | $1,200 | $1.07 | 21d | 1 | 0.71mi |
| 812 W Macqueen Ave Peoria, IL | 2.0 | 1.0 | 822 | $795 | $0.97 | 44d | 1 | 0.74mi |
| 2121 N Prospect Rd Peoria, IL | 3.0 | 1.0 | 946 | $802 | $0.85 | 13d | 1 | 0.76mi |
| 814 W McClure Ave Peoria, IL | 3.0 | 1.0 | 1148 | $1,100 | $0.96 | 44d | 1 | 0.77mi |
| 903 W Brons Ave Peoria, IL | 3.0 | 1.0 | 971 | $995 | $1.02 | 44d | 1 | 0.78mi |
| 905 W Thrush Ave Peoria, IL | 2.0 | 1.0 | 750 | $950 | $1.27 | 21d | 1 | 0.79mi |
| 913 W McClure Ave Peoria, IL | 3.0 | 1.0 | 1400 | $1,200 | $0.86 | 21d | 1 | 0.86mi |
| 501 W Columbia Ter Unit 3 Peoria, IL | 3.0 | 1.0 | 1500 | $1,400 | $0.93 | 44d | 1 | 0.86mi |
| 2023 N Underhill St Peoria, IL | 3.0 | 1.0 | 1050 | $1,200 | $1.14 | 13d | 1 | 1.03mi |
| 506 Caroline St Unit B Peoria, IL | 2.0 | 1.0 | 1000 | $900 | $0.90 | 13d | 1 | 1.09mi |
| 416 W Main St Unit A Peoria, IL | 2.0 | 1.0 | 1050 | $950 | $0.90 | 44d | 1 | 1.09mi |
| 3108 N Parish Ave Peoria, IL | 3.0 | 1.5 | 967 | $1,750 | $1.81 | 44d | 1 | 1.20mi |
| 911 N Sheridan Rd Unit A4 Peoria, IL | 2.0 | 1.0 | 825 | $850 | $1.03 | 44d | 1 | 1.25mi |
| 911 N Sheridan Rd Unit a1 Peoria, IL | 2.0 | 1.0 | 825 | $850 | $1.03 | 13d | 1 | 1.25mi |
| 1413 W Gilbert Ave Peoria, IL | 2.0 | 2.0 | 1428 | $1,500 | $1.05 | 13d | 1 | 1.35mi |
| 2302 NE Monroe St Peoria, IL | 3.0 | 1.0 | 1100 | $875 | $0.80 | 13d | 1 | 1.38mi |
| 123 SW Jefferson Ave Unit E6W Peoria, IL | 2.0 | 1.0 | 868 | $1,495 | $1.72 | 21d | 1 | 1.46mi |
| 123 SW Jefferson Ave Unit E15SW Peoria, IL | 2.0 | 2.0 | 1100 | $1,750 | $1.59 | 13d | 1 | 1.46mi |
| 123 SW Jefferson Ave Unit E16 NE Peoria, IL | 2.0 | 2.0 | 1199 | $2,250 | $1.88 | 21d | 1 | 1.46mi |
Listing history 24 events
-
2026-06-19days on market $50,500 Active 37 DOM
-
2026-06-18days on market $50,500 Active 36 DOM
-
2026-06-17days on market $50,500 Active 35 DOM
-
2026-06-16days on market $50,500 Active 34 DOM
-
2026-06-15days on market $50,500 Active 33 DOM
-
2026-06-14days on market $50,500 Active 31 DOM
-
2026-06-13days on market $50,500 Active 30 DOM
-
2026-06-10days on market $50,500 Active 28 DOM
-
2026-06-09days on market $50,500 Active 27 DOM
-
2026-06-08days on market $50,500 Active 26 DOM
-
2026-06-07days on market $50,500 Active 25 DOM
-
2026-06-03days on market $50,500 Active 21 DOM
-
2026-06-02days on market $50,500 Active 20 DOM
-
2026-06-01days on market $50,500 Active 19 DOM
-
2026-05-31days on market $50,500 Active 18 DOM
-
2026-05-30days on market $50,500 Active 17 DOM
-
2026-05-18price $52,500 382-char remark
-
2026-05-13$57,500 Active 382-char remark
-
2026-04-09historical
-
2026-04-03historical
-
2022-03-31historical
-
2021-08-06historical
-
2002-05-17soldstatus $45,000
-
2001-07-30$45,000
ⓘ Source: listings_history table (triggers on properties + properties_extension) + one-shot
backfill from property_details.listing_events for pre-trigger history.
Tax reassessment forecast IL · Partial reset (capped growth)
- Current annual tax
- $1,068 · $89/mo
- Projected year-2 tax
- $1,107 · $92/mo
- Expected delta
- +$39/yr (+$3/mo · 3.7%)
ⓘ Screening estimate from a state-policy table — verify with the county assessor before closing.
Climate risk First Street
- Flood 6/10 Major FEMA zone X · 69% chance over 30 yrs
- Wildfire 1/10 Low
- Heat 3/10 Moderate 7 d/yr ≥105°F today · 18 d/yr by 30 yrs out
- Wind 2/10 Low 100% chance of damaging wind over 30 yrs
- Air quality 3/10 Moderate 1 unhealthy d/yr today · 3 by 30 yrs out
Nearby sold comps map
Loading sold comps map…
Walkable amenities ~0.75 mi
Loading nearby amenities…
Taxation est. · year 1
- Rental income
- $13,265
- − Mortgage interest
- −$2,829
- − Property taxes
- −$1,068
- − Insurance
- −$252
- − Repairs & maintenance
- −$1,061
- − Management
- −$1,061
- − Depreciation
- −$1,469
- Taxable income
- $5,525
- Est. tax owed @ 24.0%
- −$1,326
- After-tax cash flow
- $4,655/yr
For passive investors: Depreciation is non-cash, so a rental often shows a tax loss while cash-flowing — sheltering income. Rental losses are passive: they offset passive income freely, and up to $25,000/yr can offset ordinary (W-2) income if you actively participate and your MAGI is under $100k (phasing out to $0 by $150k); unused losses carry forward. On sale, claimed depreciation is recaptured at up to 25%, and gains may owe capital-gains tax (a 1031 exchange can defer both). Figures are a year-1 estimate at your 24.0% rate — not tax advice; consult a CPA.
Schools (NCES district)
- District
- Peoria SD 150
- NCES district ID
- 1731230
- Math proficiency
- 11% ▼ -5.00%
- Reading proficiency
- 14% ▼ -4.00%
- Median HH income
- $41,951
- Composite
- 10.92/100
- National rank
- #9751
- State rank
- #554 of 620 in IL
Livability — Peoria
- Score
- 73/100
- State rank
- #270
- US rank
- #5096
Category grades
Schools grade is shown separately in the Schools card above.
Census & demographics
- Census place
- Peoria, IL
- County
- Peoria County · 120,495 people
- City population
- 114,670
- Metro
- Peoria, IL
- Population (ZIP)
- 15,356
- Household income
- $41,618
- Rent vs Own
- Severe rent burden
- 849.0
Population outlook (Peoria County) Hauer SSP2
- Today (2025)
- 183,007 people
- By 2030
- 179,643 · -1.8%
- By 2040
- 171,782 · -6.1%
- By 2050
- 163,508 · -10.7%
- By 2075
- 140,178 · -23.4%
- By 2100
- 114,493 · -37.4%
Race, ethnicity, and origin ACS 2023
- Neighborhood character
- Diverse neighborhood (Simpson 0.68)
- Race & ethnicity
- Black 43% White 36% Two or more races 12% Hispanic / Latino 10% Asian 1%
- Hispanic origin (detail)
- Mexican 7%
- Common ancestry
- Italian 2% Slovak 1% Lithuanian 1%
- Foreign-born
- 7% · Canada
- Languages at home
- 91% English-only · Spanish 6% Tagalog/Filipino 1%
Political lean MEDSL · Peoria
- 2024 margin
- Toss-up / Even · D 51.5% · R 46.9% · Other 1.6%
- 2008→2024 swing
- -9.2pp toward R · 2008: 13.9pp · 2024: 4.7pp
- All cycles
- 2024: D+4.7 2020: D+6.3 2016: D+2.8 2012: D+4.4 2008: D+13.9
Not yet ingested
- Civics
- —
Market trends
- HPI YoY
- ▼ -65.98%
- Current HPI
- 141.5343
- Rent YoY
- ▲ 3.49%
- Metro
- Peoria, IL
- State GDP YoY
- ▲ 1.59%
- F500 in state
- 60
Industry mix (Fortune 500 HQ in IL)
| Industry | F500 HQs | Revenue |
|---|---|---|
| Insurance | 4 | $201B |
|
||
| Consumer Goods | 4 | $87B |
|
||
| Industrial Machinery | 3 | $64B |
|
||
| Healthcare | 2 | $55B |
|
||
| Retail / Pharmacy | 1 | $148B |
|
||
| Agriculture / Food | 1 | $86B |
|
||
Price history
+12.2% since first listed9 events — show timeline
- 2026-05-25 Price Changed $50,500 RMLSA as Distributed by MLS Grid
- 2026-05-18 Price Changed $52,500 RMLSA as Distributed by MLS Grid
- 2026-05-13 Listed $57,500 RMLSA as Distributed by MLS Grid
- 2026-04-09 Listing Removed — RMLSA as Distributed by MLS Grid
- 2026-04-03 Coming Soon — RMLSA as Distributed by MLS Grid
- 2022-03-31 Listing Removed — RMLSA as Distributed by MLS Grid
- 2021-08-06 Listing Removed — RMLSA as Distributed by MLS Grid
- 2002-05-17 Sold (MLS) $45,000 RMLSA as Distributed by MLS Grid
- 2001-07-30 Listed $45,000 RMLSA as Distributed by MLS Grid
Property tax history
+3.2%/yrLatest (2025): $1,068 · +6.5% YoY. Source: county tax records.
Cash-flow waterfall
monthlySold comps — $/sqft
last 12 mo · ≤1 miLoading sold comps…