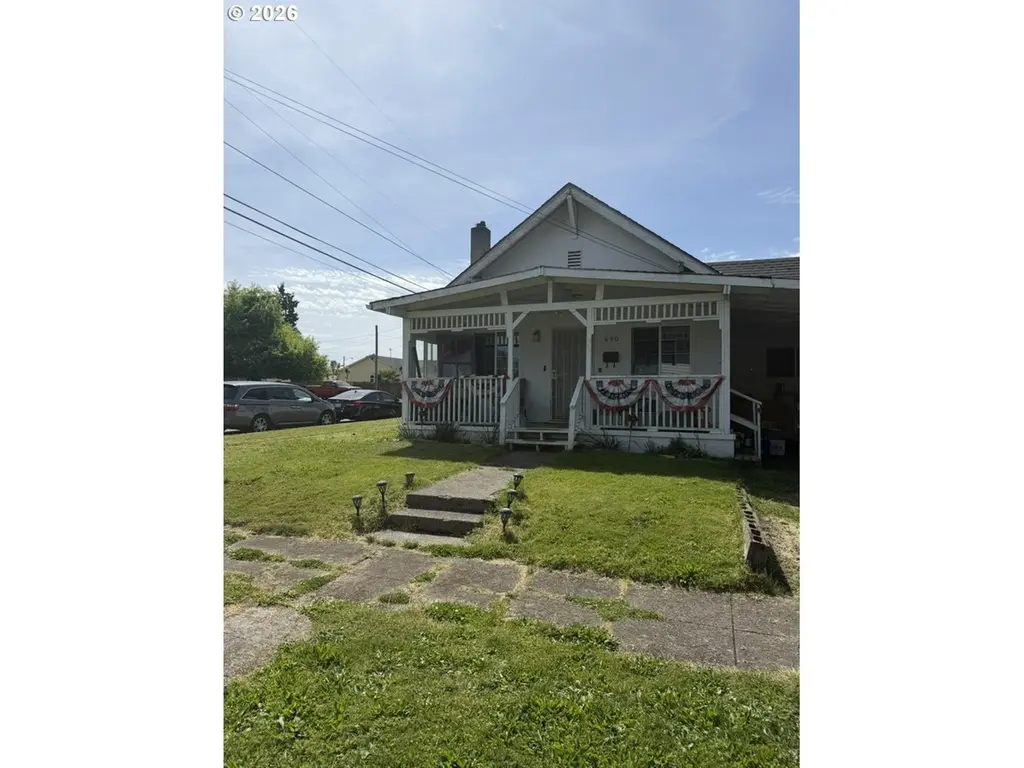
690 S 6th St · Independence, OR
Flood risk 1/10 · Minimal
- FEMA flood zone
- X (unshaded)
- Chance of flooding over 30 yrs
- 0.0%
- Est. flood insurance / yr
- $507 – $1,088
Fire risk 1/10 · Minimal
- Est. fire insurance / yr
- $498 – $926
Heat risk 4/10 · Minor
- Hot days now (above 92°F)
- 7 days/yr
- Hot days in 30 yrs
- 14 days/yr
Wind risk 1/10 · Minimal
- Chance of severe wind over 30 yrs
- —
Air-quality risk 9/10 · Severe
- Unhealthy air days now
- 11 days/yr
- Unhealthy air days in 30 yrs
- 11 days/yr
Risk factors via First Street. Map © Google.
Why this score? — see what drove the D grade
The composite is a weighted blend of 9 inputs, each scored 0–100. Each bar is that input's sub-score; the figure is the points it added to the 100-point composite (weight × sub-score).
- ARV discount +15.0/15.0
- Cash flow +9.2/30.0
- Rent growth +3.8/5.0
- Livability +3.2/5.0
- Schools +3.1/10.0
- DSCR +2.6/10.0
- Condition / age +2.5/5.0
- 1% rule +2.2/10.0
- Appreciation +0.0/10.0
$200,000
🖨 Deal sheet 📄 Offer letter ✓ Due diligence
Listing remarks MLS
Investor or builder alert! Large, .21 acre corner lot that could be suitable for new duplex or new single family residence. CASH ONLY will not finance. Home is habitable but some projects were not completed with permits. No showings at this time. Drive-bys only. Buyer due diligence on buildability.
Key facts
- Large corner lot
- 9,147 sq ft lot
- 2 garage spots
Tags
Property features AI
Finance
- Other: Lot about 0.21 acre
- Financial info: Property listed as a fixer
Exterior
- Parking: Carport with space for 2 vehicles; Total parking for 2 vehicles
- Utilities: Electricity; Public water; Public sewer
- Home design: Single‑family residence; One story; Residential property; Built in 1935; No notable view
- Construction: Composition roof
- Exterior features: T-111 siding; Corner lot
Interior
- Kitchen: Dishwasher; Free‑standing range
- Bedrooms: Primary bedroom (Main level); Second bedroom (Main level)
- Bathrooms: 2 full bathrooms (both on the main level)
- Heating & cooling: Ductless heating; Wood stove (heating); No central cooling
- Interior features: Wood stove fireplace; Family room; Living room; Dining room; Great room
Neighborhood map
What this means for you Summary
Snapshot
- This is a 1-bed/1.0-bath single-family listed at $200k.
Deal economics
- At list price, monthly cash flow is $-150 ($-2k/yr) — negative.
- To cash-flow at today's rent, offer at most $174k (13.2% below list).
- To meet the 1% rule (rent ≥ 1% of price), the offer needs to be $145k (27.5% below list).
- Recommended offer: $145k (27.5% below list) — sets the bar for 1% rule.
- Cap rate 5.4% vs local median 3.4% in Independence — top-decile yield for the area; either an underpriced asset or a hidden risk that comps aren't pricing in. Stress-test before assuming the spread holds.
Location & tenants
- Location reads 65/100 on livability (#194 in OR) — a middle-class / working-renter tenant base. Strengths: housing A+, commute A, crime B; Watch: employment D+, health & safety D+, amenities F.
- Central SD 13J (town): math 26% / reading 41% proficiency, ranked #149 of 183 in OR (top 81%) — families likely to look elsewhere, expect single-tenant / working-renter base with shorter leases.
- Zoned schools: Independence Elementary School (385 students, 65% FRL); Talmadge Middle School (740 students, 64% FRL); Central High School (1,100 students, 65% FRL).
- Market conditions: Rents rising fast (+5.4%/yr); 47 active listings in the ZIP; 8 comparable units currently listed for rent nearby; rentals at typical pace (median 14d on market — plan ~3-4 weeks tenant-placement turnaround); solid renter incomes; 177 units permitted in Polk County in 2024 (14 in 5+ unit buildings).
Forward outlook
- Local home prices are declining (-3.0%/yr); year-one equity from $1k of loan paydown is wiped out by about $6k of value loss. Plan a longer hold.
- Polk County population projected at +25% by 2050 — long-run rental-demand tailwind backs the buy-and-hold thesis.
Negotiation context
- Only 1 days on market — expect competitive offers; lowballing is unlikely to land.
- 5 sale attempts since 14y ago with the ask held roughly flat each time — persistent listings suggest the price (not the market) is what's stuck; bring a comps-based counter.
- Current owner paid $86k; list at $200k implies a 133% gain — meaningful room to come down on a strong offer.
Risks & watch-outs
- Watch-outs: built in 1935 — expect roof / HVAC / electrical / plumbing capex.
Questions for the listing agent
- What do current leases actually rent for vs. the listed asking? Can we see a recent rent roll and the last 12 months of T-12 income?
- Built in 1935 — when were the roof, HVAC, electrical panel, plumbing, and water heater last replaced?
- Is there a deadline driving the sale (1031 exchange, divorce, estate, relocation)? That informs how much negotiation room exists.
- Schools are F-rated, which usually means shorter tenancies and higher turnover. Who's the typical renter profile here, and what's been the actual vacancy rate?
- The area grade is low — what's the realistic commute time and amenity access for the typical tenant pool here? Any planned neighborhood developments (good or bad) we should know about?
- What's the average days-on-market for RENTAL listings here right now (not sales)? A rising rental-DOM trend means longer vacancies and softer asking-rent achievability than the comps imply.
- What's the recent tenant-quality profile in this submarket — average credit score on applications, eviction rate, late-payment / NSF rate, and stable-employment percentage? A property-management company in the area should have these aggregated.
- How much new for-sale + rental construction is in the pipeline within 1–3 miles? Heavy new supply typically softens prices + rents 12–24 months out; constrained supply supports both.
Investment metrics
- 1% rule
- 0.72% ✗
- Cap rate
- 5.39%
- Cash-on-cash
- -3.21%
- DSCR
- 0.86
- GRM
- 11.5
CMA / ARV
- ARV (on-the-fly)
- $324,852
- Comps found
- 3
Show comp detail 3 sales within ~0.75 mi
| Address | Dist | Beds/Ba | Sqft | Sold | Price | $/sf | Match |
|---|---|---|---|---|---|---|---|
| 690 S 6th St | 0.00mi | 2/2.0 (+1) | 1,177 (0%) | 1mo | $175,000 | $149 | 90 |
| 1135 Monmouth St | 0.48mi | 2/1.0 (+1) | 1,008 (-14%) | 1mo | $277,810 | $276 | 48 |
| 1380 Monmouth St | 0.69mi | 2/1.0 (+1) | 1,054 (-10%) | 7mo | $380,000 | $361 | 40 |
Match score weights: distance 35% · size 25% · config 20% · recency 20%. Top-matched comps best support the ARV.
Projected returns pro-forma
-3.0% appreciation · 5.37% rent growth · sell at horizon
- IRR
- -19.3%
- Equity multiple
- 0.31×
- Total profit
- $-38,452
- Equity at exit
- $29,821
- IRR
- -8.0%
- Equity multiple
- 0.45×
- Total profit
- $-30,670
- Equity at exit
- $17,292
Cash invested: $56,000 (down + closing). Projections, not guarantees.
Landlord ↔ Tenant lean methodology
- Overall (STATE)
- 28 Tenant-Leaning
- State Oregon
- 28 Tenant-Leaning · D+6
- County
- — inherits STATE
- City
- — inherits STATE
ZIP-level market 97351
- Home prices YoY
- -24.8%
- Rents YoY
- 5.4%
- Active inventory
- 47
- Price-to-rent
- 11.5×
Monthly cashflow live
- Estimated rent
- $1,449 high interval (Pro) →
- Mortgage (P&I)
- −$1,049
- Tax from tax record
- −$163 /mo · $1,953/yr
- Insurance
- −$83
- HOA
- −$0
- Vacancy / Maint / Mgmt
- −$304
- Net cashflow
- $-150
Break-even live
UW: 25.0% down · 7.5% · 30yr · 1.5% tax · 5.0% vac · 8.0% maint · 8.0% mgmt
Financing live
Cash to close
- Down payment
- $50,000
- Closing costs
- $6,000
- Reserves months
- —
- Total cash needed
- —
Loan-product check · same deal, 3 products live
Conventional
25% down · 7.5% · 30yr
- Down + closing
- —
- Monthly P&I
- —
- Monthly cashflow
- —
- DSCR
- —
- Eligible?
- —
Personal DTI + credit; lowest rate.
DSCR
20% down · 8.5% · 30yr
- Down + closing
- —
- Monthly P&I
- —
- Monthly cashflow
- —
- DSCR
- —
- Eligible?
- —
No personal income docs; deal must DSCR.
Hard money
10% down · 12.0% · 12mo
- Down + closing
- —
- Monthly P&I
- —
- Monthly cashflow
- —
- DSCR
- —
- Eligible?
- —
Short-term bridge; refi at stabilization.
Rent comps 8 comps
| Address | Beds | Baths | Sqft | Rent | $/sqft | DOM | Units | Dist |
|---|---|---|---|---|---|---|---|---|
| 800 S 4th St Unit 800-08 Independence, OR | 2.0 | 1.0 | 775 | $1,250 | $1.61 | 23d | 1 | 0.16mi |
| 75 C St Independence, OR | 1.0–2.0 | 1.0–2.0 | 946 | $1,550 | $1.64 | 14d | 8 | 0.50mi |
| 1400 E St Independence, OR | 2.0–3.0 | 1.0–2.0 | 962 | $1,525 | $1.59 | 14d | 2 | 0.65mi |
| 205 N Gun Club Rd Unit 123 Independence, OR | 2.0 | 1.0 | 868 | $1,400 | $1.61 | 23d | 1 | 0.82mi |
| 1630 Monmouth St Independence, OR | 2.0 | 1.5 | 900 | $1,375 | $1.53 | 14d | 1 | 1.04mi |
| 1630 Monmouth St Unit 1630-20 Independence, OR | 2.0 | 1.5 | 900 | $1,375 | $1.53 | 23d | 1 | 1.04mi |
| 675 White Oak Cir Independence, OR | 2.0 | 2.0 | 923 | $1,675 | $1.81 | 14d | 5 | 1.17mi |
| 201 Deann Dr Independence, OR | 1.0–3.0 | 1.0–2.0 | 966 | $1,599 | $1.66 | 14d | 22 | 1.18mi |
Listing history 11 events
-
2026-05-21status Pending
Show marketing remark (299 chars)
Investor or builder alert! Large, .21 acre corner lot that could be suitable for new duplex or new single family residence. CASH ONLY will not finance. Home is habitable but some projects were not completed with permits. No showings at this time. Drive-bys only. Buyer due diligence on buildability.
-
2026-05-21status Pending 299-char remark
Show marketing remark (299 chars)
Investor or builder alert! Large, .21 acre corner lot that could be suitable for new duplex or new single family residence. CASH ONLY will not finance. Home is habitable but some projects were not completed with permits. No showings at this time. Drive-bys only. Buyer due diligence on buildability.
-
2026-05-21status Active
Show marketing remark (299 chars)
Investor or builder alert! Large, .21 acre corner lot that could be suitable for new duplex or new single family residence. CASH ONLY will not finance. Home is habitable but some projects were not completed with permits. No showings at this time. Drive-bys only. Buyer due diligence on buildability.
-
2026-05-21status Active 299-char remark
Show marketing remark (299 chars)
Investor or builder alert! Large, .21 acre corner lot that could be suitable for new duplex or new single family residence. CASH ONLY will not finance. Home is habitable but some projects were not completed with permits. No showings at this time. Drive-bys only. Buyer due diligence on buildability.
-
2026-05-12status Pending
Show marketing remark (299 chars)
Investor or builder alert! Large, .21 acre corner lot that could be suitable for new duplex or new single family residence. CASH ONLY will not finance. Home is habitable but some projects were not completed with permits. No showings at this time. Drive-bys only. Buyer due diligence on buildability.
-
2026-05-12historical Active under Contract 299-char remark
Show marketing remark (299 chars)
Investor or builder alert! Large, .21 acre corner lot that could be suitable for new duplex or new single family residence. CASH ONLY will not finance. Home is habitable but some projects were not completed with permits. No showings at this time. Drive-bys only. Buyer due diligence on buildability.
-
2026-05-11$200,000 Active
-
2026-05-10$200,000 Active 299-char remark
Show marketing remark (299 chars)
Investor or builder alert! Large, .21 acre corner lot that could be suitable for new duplex or new single family residence. CASH ONLY will not finance. Home is habitable but some projects were not completed with permits. No showings at this time. Drive-bys only. Buyer due diligence on buildability.
-
2012-10-09soldstatus $85,900
-
2012-10-05soldstatus $85,900
-
2012-09-01$85,900
ⓘ Source: listings_history table (triggers on properties + properties_extension) + one-shot
backfill from property_details.listing_events for pre-trigger history.
Tax reassessment forecast OR · Resets to sale price
- Current annual tax
- $1,953 · $163/mo
- Projected year-2 tax
- $1,953 · $163/mo
- Expected delta
- $0/yr ($0/mo · -0.0%)
ⓘ Screening estimate from a state-policy table — verify with the county assessor before closing.
Climate risk First Street
- Flood 1/10 Low FEMA zone X (unshaded) · 0% chance over 30 yrs
- Wildfire 1/10 Low
- Heat 4/10 Moderate 7 d/yr ≥92°F today · 14 d/yr by 30 yrs out
- Wind 1/10 Low
- Air quality 9/10 Extreme 11 unhealthy d/yr today · 11 by 30 yrs out
Nearby sold comps map
Loading sold comps map…
Walkable amenities ~0.75 mi
Loading nearby amenities…
Taxation est. · year 1
- Rental income
- $17,391
- − Mortgage interest
- −$11,203
- − Property taxes
- −$1,953
- − Insurance
- −$1,000
- − Repairs & maintenance
- −$1,391
- − Management
- −$1,391
- − Depreciation
- −$5,818
- Taxable loss
- −$5,365
- Est. tax savings @ 24.0%
- +$1,288
- After-tax cash flow
- $-512/yr
For passive investors: Depreciation is non-cash, so a rental often shows a tax loss while cash-flowing — sheltering income. Rental losses are passive: they offset passive income freely, and up to $25,000/yr can offset ordinary (W-2) income if you actively participate and your MAGI is under $100k (phasing out to $0 by $150k); unused losses carry forward. On sale, claimed depreciation is recaptured at up to 25%, and gains may owe capital-gains tax (a 1031 exchange can defer both). Figures are a year-1 estimate at your 24.0% rate — not tax advice; consult a CPA.
Schools (NCES district)
- District
- Central SD 13J
- NCES district ID
- 4102840
- Math proficiency
- 26% ▼ -3.00%
- Reading proficiency
- 41% ▼ -2.00%
- Median HH income
- $42,374
- Composite
- 31.04/100
- National rank
- #11310
- State rank
- #149 of 183 in OR
Livability — Independence
- Score
- 65/100
- State rank
- #194
- US rank
- #12576
Category grades
Schools grade is shown separately in the Schools card above.
Census & demographics
- Census place
- Independence, OR
- County
- Polk County · 84,240 people
- City population
- 11,454
- Metro
- Salem, OR
- Population (ZIP)
- 11,454
- Household income
- $88,519
- Rent vs Own
- Severe rent burden
- 211.0
Population outlook (Polk County) Hauer SSP2
- Today (2025)
- 88,594 people
- By 2030
- 93,209 · +5.2%
- By 2040
- 101,942 · +15.1%
- By 2050
- 110,395 · +24.6%
- By 2075
- 131,091 · +48.0%
- By 2100
- 141,746 · +60.0%
Race, ethnicity, and origin ACS 2023
- Neighborhood character
- Diverse neighborhood (Simpson 0.55)
- Race & ethnicity
- White 57% Hispanic / Latino 36% Two or more races 14% Native American 1%
- Hispanic origin (detail)
- Mexican 33% Puerto Rican 1%
- Common ancestry
- Italian 3% Slovak 2% Portuguese 2%
- Foreign-born
- 9% · Canada, Dominican Republic
- Languages at home
- 77% English-only · Spanish 22%
Political lean MEDSL · Polk
- 2024 margin
- Toss-up / Even · D 46.6% · R 50.4% · Other 3.0%
- 2008→2024 swing
- -3.3pp toward R · 2008: -0.5pp · 2024: -3.8pp
- All cycles
- 2024: R+3.8 2020: R+1.7 2016: R+7.0 2012: R+4.8 2008: R+0.5
Not yet ingested
- Civics
- —
Market trends
- HPI YoY
- ▼ -114.45%
- Current HPI
- 346.7564
- Rent YoY
- ▲ 5.37%
- Metro
- Salem, OR
- State GDP YoY
- ▲ 2.05%
- F500 in state
- 2
Industry mix (Fortune 500 HQ in OR)
| Industry | F500 HQs | Revenue |
|---|---|---|
| Consumer Goods | 1 | $51B |
|
||
Price history
+132.8% since first listed11 events — show timeline
- 2026-05-21 Pending — RMLS
- 2026-05-21 Pending — WVMLS
- 2026-05-21 Relisted — RMLS
- 2026-05-21 Relisted — WVMLS
- 2026-05-12 Pending — RMLS
- 2026-05-12 Contingent — WVMLS
- 2026-05-11 Listed $200,000 RMLS
- 2026-05-10 Listed $200,000 WVMLS
- 2012-10-09 Sold (Public Records) $85,900 Public Records
- 2012-10-05 Sold (MLS) $85,900 WVMLS
- 2012-09-01 Listed $85,900 WVMLS
Property tax history
+2.4%/yrLatest (2025): $1,953 · +3.8% YoY. Source: county tax records.
Cash-flow waterfall
monthlySold comps — $/sqft
last 12 mo · ≤1 miLoading sold comps…