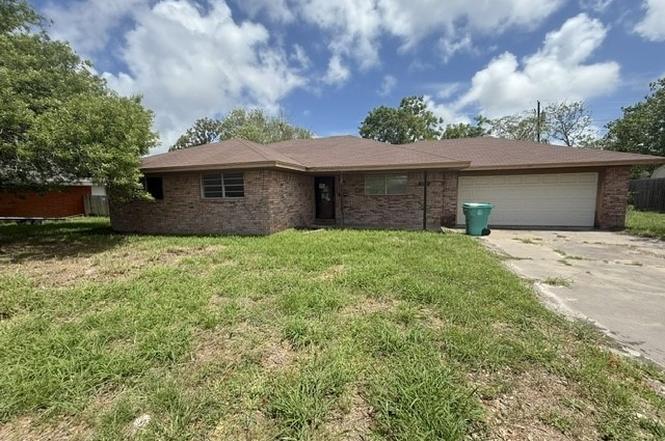
1322 W Palm Dr · Aransas Pass, TX
Flood risk 3/10 · Minor
- FEMA flood zone
- X (unshaded)
- Chance of flooding over 30 yrs
- 0.1%
- Est. flood insurance / yr
- $507 – $1,088
Fire risk 3/10 · Minor
- Est. fire insurance / yr
- $1,222 – $2,270
Heat risk 10/10 · Severe
- Hot days now (above 106°F)
- 7 days/yr
- Hot days in 30 yrs
- 28 days/yr
Wind risk 9/10 · Severe
- Chance of severe wind over 30 yrs
- 99.0%
Air-quality risk 1/10 · Minimal
- Unhealthy air days now
- 0 days/yr
- Unhealthy air days in 30 yrs
- 0 days/yr
Risk factors via First Street. Map © Google.
Why this score? — see what drove the B+ grade
The composite is a weighted blend of 9 inputs, each scored 0–100. Each bar is that input's sub-score; the figure is the points it added to the 100-point composite (weight × sub-score).
- Cash flow +30.0/30.0
- ARV discount +15.0/15.0
- 1% rule +10.0/10.0
- DSCR +10.0/10.0
- Livability +3.6/5.0
- Schools +2.7/10.0
- Rent growth +2.5/5.0
- Condition / age +2.5/5.0
- Appreciation +0.0/10.0
$129,900
🖨 Deal sheet (PDF) 📄 Offer letter ✓ Due diligence
Listing remarks MLS
INVESTOR SPECIAL! – PRICED WELL BELOW MARKET VALUE IN THRIVING ARANSAS PASS! Opportunity knocks with this solid brick 3-bedroom, 2-bath, 2-car garage home located in one of the fastest-growing coastal communities in South Texas. Whether you're an investor looking for your next flip, a landlord seeking rental income, or a homeowner ready to build instant equity, this property offers tremendous upside at a price that is hard to find in today's market. Featuring a functional floor plan, spacious living areas, and good bones, this home simply needs a little TLC and cosmetic updating to reach its full potential. Comparable renovated homes in the area command significantly higher values, making this an excellent value-add opportunity. Enjoy convenient access to schools, shopping, restaurants, marinas, fishing, and everything the Coastal Bend has to offer. With continued growth and development throughout Aransas Pass, opportunities like this are becoming increasingly rare. Property is being sold AS-IS, WHERE-IS, with no repairs to be made by seller. Seller makes no warranties or representations regarding the condition of the property. Buyers are encouraged to conduct their own inspections and due diligence. Don't miss your chance to secure a property with tremendous potential at a price well below market value. Schedule your showing today before this opportunity is gone!
Key facts
- Solid brick home
- 0.26 acre lot
- 2 garage spots
Tags
Property features AI
Finance
- HOA & community: Short-term rentals allowed
Exterior
- Parking: 2-car garage (covered)
- Utilities: Public water; Public sewer; Utilities available
- Home design: Single-story; Shingle siding
- Construction: Shingle roof; Built on slab foundation
- Exterior features: Wood fencing; Interior lot; Lot dimensions approximately 100 x 115
Interior
- Flooring: Tile
- Bathrooms: 2 full bathrooms
- Interior features: Cable TV; Tile floors
- Laundry & utility: Washer hookup; Dryer hookup
Neighborhood map
What this means for you Summary
Snapshot
- This is a 3-bed/2.0-bath single-family listed at $130k.
Deal economics
- At list price, monthly cash flow is $789 ($9k/yr) — positive.
- The deal already cash-flows at list — no discount required.
- Meets the 1% rule at list price ($2k rent vs $130k).
- Cap rate 13.6% vs local median 4.6% in Aransas Pass — top-decile yield for the area; either an underpriced asset or a hidden risk that comps aren't pricing in. Stress-test before assuming the spread holds.
Location & tenants
- Location reads 72/100 on livability (#253 in TX) — a middle-class / working-renter tenant base. Strengths: cost of living A+, housing A+, health & safety A+; Watch: schools D, amenities F, commute F.
- Aransas Pass ISD (town): math 28% / reading 35% proficiency, ranked #597 of 826 in TX (top 72%) — families likely to look elsewhere, expect single-tenant / working-renter base with shorter leases; 64% free/reduced lunch — lower-income household profile, screen leases tightly.
- Market conditions: 275 active listings in the ZIP; 4 comparable units currently listed for rent nearby; rentals lingering (median 45d on market — plan ~5-8 weeks vacancy on turnover, expect pricing pressure); 50% of comp listings sitting > 30 days — soft ceiling on asking rent; 344 units permitted in San Patricio County in 2024 (0 in 5+ unit buildings).
Forward outlook
- Local home prices are declining (-3.0%/yr); year-one equity from $898 of loan paydown is wiped out by about $4k of value loss. Plan a longer hold.
- San Patricio County population projected at +27% by 2050 — long-run rental-demand tailwind backs the buy-and-hold thesis.
- At projected returns (-3.0% appreciation + 3.0% rent growth), your $36k cash investment doubles in ~5 years — after that, you're playing with house money.
Negotiation context
- Only 5 days on market — expect competitive offers; lowballing is unlikely to land.
- 3 sale attempts since 23y ago with the ask held roughly flat each time — persistent listings suggest the price (not the market) is what's stuck; bring a comps-based counter.
- Current owner paid $44k; list at $130k implies a 196% gain — meaningful room to come down on a strong offer.
Risks & watch-outs
- Watch-outs: property tax is 3.0% of price.
- Climate carrying-cost: severe wind risk, 99% chance of damaging wind over 30y; extreme-heat days projected 7→28/yr by 2055 (HVAC capex compounding) — expect insurance premiums to compound above CPI over the hold.
Questions for the listing agent
- Built in 1971 — when were the roof, HVAC, electrical panel, plumbing, and water heater last replaced?
- Property tax is high relative to price — has the assessment been appealed recently, and will the sale trigger a re-assessment?
- Is there a deadline driving the sale (1031 exchange, divorce, estate, relocation)? That informs how much negotiation room exists.
- Schools are D-rated, which usually means shorter tenancies and higher turnover. Who's the typical renter profile here, and what's been the actual vacancy rate?
- What's the average days-on-market for RENTAL listings here right now (not sales)? A rising rental-DOM trend means longer vacancies and softer asking-rent achievability than the comps imply.
- What's the recent tenant-quality profile in this submarket — average credit score on applications, eviction rate, late-payment / NSF rate, and stable-employment percentage? A property-management company in the area should have these aggregated.
- How much new for-sale + rental construction is in the pipeline within 1–3 miles? Heavy new supply typically softens prices + rents 12–24 months out; constrained supply supports both.
Investment metrics
- 1% rule
- 1.80% ✓
- Cap rate
- 13.58%
- Cash-on-cash
- 26.04%
- DSCR
- 2.16
- GRM
- 4.6
CMA / ARV
- ARV (on-the-fly)
- $246,179
- Comps found
- 12
Show comp detail 12 sales within ~0.75 mi
| Address | Dist | Beds/Ba | Sqft | Sold | Price | $/sf | Match |
|---|---|---|---|---|---|---|---|
| 1307 W Palm Dr | 0.04mi | 3/2.0 | 1,326 (-7%) | 8mo | $215,000 | $162 | 80 |
| 320 S 10th St | 0.26mi | 3/2.0 | 1,448 (+2%) | 8mo | $289,900 | $200 | 78 |
| 423 S 12th St | 0.19mi | 2/2.0 (-1) | 1,372 (-4%) | 6mo | $290,000 | $211 | 75 |
| 229 S 12th St | 0.16mi | 3/2.0 | 1,264 (-11%) | 0mo | $219,000 | $173 | 74 |
| 1522 W Palm | 0.18mi | 3/2.0 | 1,296 (-9%) | 9mo | $220,000 | $170 | 69 |
| 1606 W Nelson Ave | 0.29mi | 3/2.0 | 1,324 (-7%) | 9mo | $199,999 | $151 | 67 |
| 257 N 9th St | 0.53mi | 3/2.0 | 1,377 (-3%) | 8mo | $174,500 | $127 | 63 |
| 329 N 10th St | 0.54mi | 3/2.0 | 1,354 (-5%) | 4mo | $255,000 | $188 | 63 |
| 147 N 8th St | 0.52mi | 4/1.0 (+1) | 1,452 (+2%) | 2mo | $150,000 | $103 | 62 |
| 630 S Lamont | 0.74mi | 3/2.0 | 1,269 (-11%) | 1mo | $229,000 | $180 | 46 |
| 1034 S 10th St | 0.72mi | 2/2.0 (-1) | 1,312 (-8%) | 5mo | $179,900 | $137 | 45 |
| 841 S 8th | 0.65mi | 3/2.0 | 1,603 (+13%) | 6mo | $347,851 | $217 | 44 |
Match score weights: distance 35% · size 25% · config 20% · recency 20%. Top-matched comps best support the ARV.
Projected returns pro-forma
-3.0% appreciation · 3.0% rent growth · sell at horizon
- IRR
- 19.8%
- Equity multiple
- 1.81×
- Total profit
- $29,358
- Equity at exit
- $19,369
- IRR
- 28.1%
- Equity multiple
- 3.50×
- Total profit
- $90,851
- Equity at exit
- $11,231
Cash invested: $36,372 (down + closing). Projections, not guarantees.
Landlord ↔ Tenant lean methodology
- Overall (STATE)
- 87 Strongly Landlord-Friendly
- State Texas
- 87 Strongly Landlord-Friendly · R+5
- County
- — inherits STATE
- City
- — inherits STATE
ZIP-level market 78336
- Home prices YoY
- -29.5%
- Active inventory
- 275
- Price-to-rent
- 4.6×
Monthly cashflow live
- Estimated rent
- $2,343 medium interval (Pro) →
- Mortgage (P&I)
- −$681
- Tax from tax record
- −$327 /mo · $3,920/yr
- Insurance
- −$54
- HOA
- −$0
- Vacancy / Maint / Mgmt
- −$492
- Net cashflow
- $789
Break-even live
Sensitivity live
| Price | -10% $863 | -5% $826 | +0% $789 | +5% $753 | +10% $716 |
|---|---|---|---|---|---|
| Rent | -10% $604 | -5% $697 | +0% $789 | +5% $882 | +10% $974 |
| Rate | -1.0pp $855 | -0.5pp $822 | base $789 | +0.5pp $756 | +1.0pp $721 |
UW: 25.0% down · 7.5% · 30yr · 1.5% tax · 5.0% vac · 8.0% maint · 8.0% mgmt
Financing live
Cash to close
- Down payment
- $32,475
- Closing costs
- $3,897
- Reserves months
- —
- Total cash needed
- —
Loan-product check · same deal, 3 products live
Conventional
25% down · 7.5% · 30yr
- Down + closing
- —
- Monthly P&I
- —
- Monthly cashflow
- —
- DSCR
- —
- Eligible?
- —
Personal DTI + credit; lowest rate.
DSCR
20% down · 8.5% · 30yr
- Down + closing
- —
- Monthly P&I
- —
- Monthly cashflow
- —
- DSCR
- —
- Eligible?
- —
No personal income docs; deal must DSCR.
Hard money
10% down · 12.0% · 12mo
- Down + closing
- —
- Monthly P&I
- —
- Monthly cashflow
- —
- DSCR
- —
- Eligible?
- —
Short-term bridge; refi at stabilization.
Rent comps 4 comps
| Address | Beds | Baths | Sqft | Rent | $/sqft | DOM | Units | Dist |
|---|---|---|---|---|---|---|---|---|
| 1109 W Nelson Ave Aransas Pass, TX | 2.0 | 2.0 | 1304 | $1,800 | $1.38 | 44d | 1 | 0.34mi |
| 2255 McMullen Ln Aransas Pass, TX | 2.0–4.0 | 2.5 | 1581 | $1,569 | $0.99 | 14d | 9 | 0.73mi |
| 1131 S 8th St Unit 1268400P Aransas Pass, TX | 3.0 | 2.0 | 1280 | $4,105 | $3.21 | 44d | 1 | 0.92mi |
| 633 N Commercial St Aransas Pass, TX | 2.0 | 1.0 | 900 | $1,850 | $2.06 | 22d | 1 | 1.29mi |
Listing history 6 events
-
2026-06-19days on market $129,900 Active 5 DOM
-
2026-06-18days on market $129,900 Active 4 DOM
-
2026-06-17days on market $129,900 Active 3 DOM
-
2026-06-16days on market $129,900 Active 2 DOM
-
2026-06-15remarks 693-char remark
Show marketing remark (1392 chars)
INVESTOR SPECIAL! – PRICED WELL BELOW MARKET VALUE IN THRIVING ARANSAS PASS! Opportunity knocks with this solid brick 3-bedroom, 2-bath, 2-car garage home located in one of the fastest-growing coastal communities in South Texas. Whether you're an investor looking for your next flip, a landlord seeking rental income, or a homeowner ready to build instant equity, this property offers tremendous upside at a price that is hard to find in today's market. Featuring a functional floor plan, spacious living areas, and good bones, this home simply needs a little TLC and cosmetic updating to reach its full potential. Comparable renovated homes in the area command significantly higher values, making this an excellent value-add opportunity. Enjoy convenient access to schools, shopping, restaurants, marinas, fishing, and everything the Coastal Bend has to offer. With continued growth and development throughout Aransas Pass, opportunities like this are becoming increasingly rare. Property is being sold AS-IS, WHERE-IS, with no repairs to be made by seller. Seller makes no warranties or representations regarding the condition of the property. Buyers are encouraged to conduct their own inspections and due diligence. Don't miss your chance to secure a property with tremendous potential at a price well below market value. Schedule your showing today before this opportunity is gone!
-
2026-06-15$129,900 Active 1 DOM
Show marketing remark (1392 chars)
INVESTOR SPECIAL! – PRICED WELL BELOW MARKET VALUE IN THRIVING ARANSAS PASS! Opportunity knocks with this solid brick 3-bedroom, 2-bath, 2-car garage home located in one of the fastest-growing coastal communities in South Texas. Whether you're an investor looking for your next flip, a landlord seeking rental income, or a homeowner ready to build instant equity, this property offers tremendous upside at a price that is hard to find in today's market. Featuring a functional floor plan, spacious living areas, and good bones, this home simply needs a little TLC and cosmetic updating to reach its full potential. Comparable renovated homes in the area command significantly higher values, making this an excellent value-add opportunity. Enjoy convenient access to schools, shopping, restaurants, marinas, fishing, and everything the Coastal Bend has to offer. With continued growth and development throughout Aransas Pass, opportunities like this are becoming increasingly rare. Property is being sold AS-IS, WHERE-IS, with no repairs to be made by seller. Seller makes no warranties or representations regarding the condition of the property. Buyers are encouraged to conduct their own inspections and due diligence. Don't miss your chance to secure a property with tremendous potential at a price well below market value. Schedule your showing today before this opportunity is gone!
ⓘ Source: listings_history table (triggers on properties + properties_extension) + one-shot
backfill from property_details.listing_events for pre-trigger history.
Tax reassessment forecast TX · Resets to sale price
- Current annual tax
- $3,920 · $327/mo
- Projected year-2 tax
- $3,920 · $327/mo
- Expected delta
- $0/yr ($0/mo · 0.0%)
ⓘ Screening estimate from a state-policy table — verify with the county assessor before closing.
Climate risk First Street
- Flood 3/10 Moderate FEMA zone X (unshaded) · 10% chance over 30 yrs
- Wildfire 3/10 Moderate
- Heat 10/10 Extreme 7 d/yr ≥106°F today · 28 d/yr by 30 yrs out
- Wind 9/10 Extreme 99% chance of damaging wind over 30 yrs
- Air quality 1/10 Low 0 unhealthy d/yr today · 0 by 30 yrs out
Nearby sold comps map
Loading sold comps map…
Walkable amenities ~0.75 mi
Loading nearby amenities…
Taxation est. · year 1
- Rental income
- $28,121
- − Mortgage interest
- −$7,276
- − Property taxes
- −$3,920
- − Insurance
- −$650
- − Repairs & maintenance
- −$2,250
- − Management
- −$2,250
- − Depreciation
- −$3,779
- Taxable income
- $7,997
- Est. tax owed @ 24.0%
- −$1,919
- After-tax cash flow
- $7,552/yr
For passive investors: Depreciation is non-cash, so a rental often shows a tax loss while cash-flowing — sheltering income. Rental losses are passive: they offset passive income freely, and up to $25,000/yr can offset ordinary (W-2) income if you actively participate and your MAGI is under $100k (phasing out to $0 by $150k); unused losses carry forward. On sale, claimed depreciation is recaptured at up to 25%, and gains may owe capital-gains tax (a 1031 exchange can defer both). Figures are a year-1 estimate at your 24.0% rate — not tax advice; consult a CPA.
Schools (NCES district)
- District
- Aransas Pass ISD
- NCES district ID
- 4808580
- Math proficiency
- 28% ▼ -16.00%
- Reading proficiency
- 35% ▼ -4.00%
- Median HH income
- $40,869
- Composite
- 26.55/100
- National rank
- #7191
- State rank
- #597 of 826 in TX
Livability — Aransas Pass
- Score
- 72/100
- State rank
- #253
- US rank
- #5980
Category grades
Schools grade is shown separately in the Schools card above.
Census & demographics
- Census place
- Aransas Pass, TX
- Population (ZIP)
- 12,146
Population outlook (San Patricio County) Hauer SSP2
- Today (2025)
- 75,538 people
- By 2030
- 79,575 · +5.3%
- By 2040
- 87,670 · +16.1%
- By 2050
- 96,107 · +27.2%
- By 2075
- 117,984 · +56.2%
- By 2100
- 130,010 · +72.1%
Race, ethnicity, and origin ACS 2023
- Neighborhood character
- Diverse neighborhood (Simpson 0.58)
- Race & ethnicity
- White 49% Hispanic / Latino 43% Two or more races 21% Asian 2% Native American 2% Black 2%
- Hispanic origin (detail)
- Mexican 36% Puerto Rican 2%
- Common ancestry
- Italian 2% Lithuanian 2% Slovak 1%
- Foreign-born
- 9% · Canada, Jamaica, China
- Languages at home
- 77% English-only · Spanish 21% Tagalog/Filipino 1%
Political lean MEDSL · San Patricio
- 2024 margin
- Solid R (+36.4) · D 31.4% · R 67.8%
- 2008→2024 swing
- -19.8pp toward R · 2008: -16.6pp · 2024: -36.4pp
- All cycles
- 2024: R+36.4 2020: R+29.1 2016: R+24.1 2012: R+20.6 2008: R+16.6
Not yet ingested
- Civics
- —
Market trends
- HPI YoY
- ▼ -78.56%
- Current HPI
- 187.8443
- Rent YoY
- —
- Metro
- —
- State GDP YoY
- ▲ 3.95%
- F500 in state
- 110
Industry mix (Fortune 500 HQ in TX)
| Industry | F500 HQs | Revenue |
|---|---|---|
| Energy | 16 | $1,198B |
|
||
| Technology | 5 | $198B |
|
||
| Engineering / Construction | 4 | $72B |
|
||
| Energy Services | 3 | $60B |
|
||
| Utilities | 3 | $41B |
|
||
| Healthcare | 2 | $330B |
|
||
Price history
+196.1% since first listed5 events — show timeline
- 2026-06-15 Listed $129,900 RAAR
- 2026-06-10 Listed $129,900 CBMLS
- 2004-02-06 Sold (MLS) — CBMLS
- 2003-08-28 Listed $94,500 CBMLS
- 1988-08-05 Sold (Public Records) $43,872 Public Records
Property tax history
+5.3%/yrLatest (2025): $3,920 · -0.7% YoY. Source: county tax records.
Cash-flow waterfall
monthlySold comps — $/sqft
last 12 mo · ≤1 miLoading sold comps…