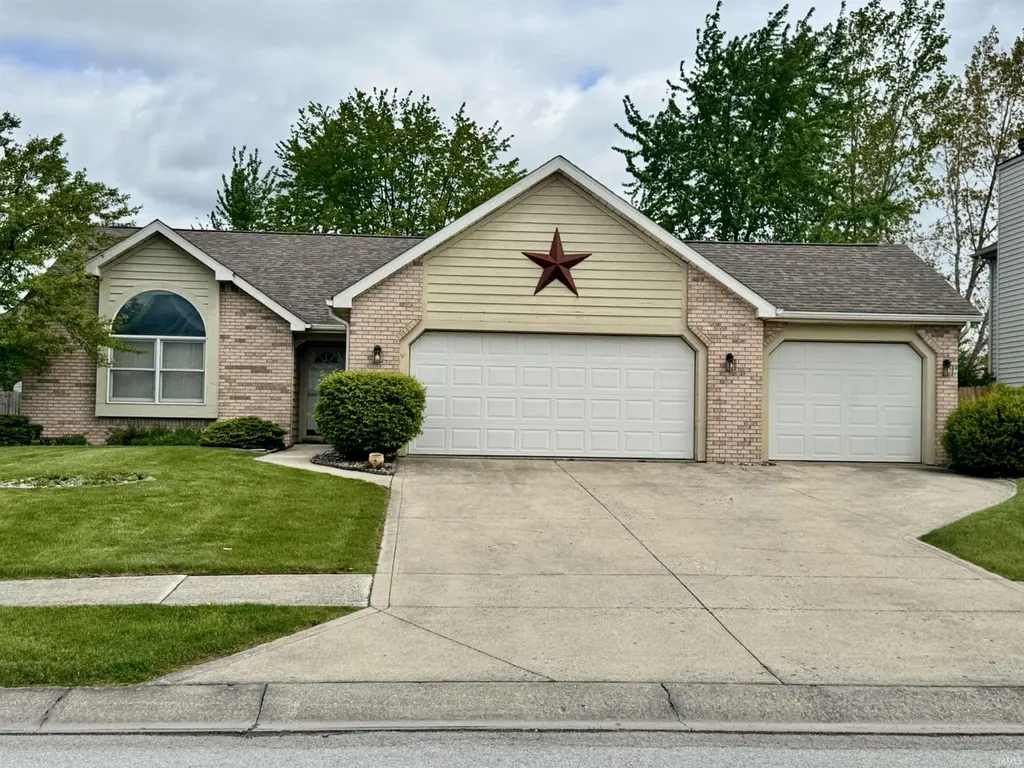
1808 Wisteria Pl · Fort Wayne, IN
Flood risk 1/10 · Minimal
- FEMA flood zone
- X (unshaded)
- Chance of flooding over 30 yrs
- 0.0%
- Est. flood insurance / yr
- $507 – $1,088
Fire risk 1/10 · Minimal
- Est. fire insurance / yr
- $717 – $1,331
Heat risk 3/10 · Minor
- Hot days now (above 101°F)
- 7 days/yr
- Hot days in 30 yrs
- 17 days/yr
Wind risk 2/10 · Minimal
- Chance of severe wind over 30 yrs
- —
Air-quality risk 2/10 · Minimal
- Unhealthy air days now
- 2 days/yr
- Unhealthy air days in 30 yrs
- 2 days/yr
Risk factors via First Street. Map © Google.
Why this score? — see what drove the D- grade
The composite is a weighted blend of 9 inputs, each scored 0–100. Each bar is that input's sub-score; the figure is the points it added to the 100-point composite (weight × sub-score).
- ARV discount +10.2/15.0
- Cash flow +9.1/30.0
- Schools +4.9/10.0
- Rent growth +4.4/5.0
- Livability +4.2/5.0
- DSCR +2.5/10.0
- Condition / age +2.5/5.0
- 1% rule +2.1/10.0
- Appreciation +0.0/10.0
$298,000
🖨 Deal sheet (PDF) 📄 Offer letter ✓ Due diligence
Listing remarks
Your new home awaits in NWAC’s Falls of Keefer Creek! This 3 bedroom, 2.5 bath home offers thoughtful surprises that make its 1709 sqft seem like so much more. The Lofted Great Room w/ newer overhead skylights allow light in and features remote shades. The heart of the home will be the large eat-in kitchen or the more formal dining room for larger gatherings. In addition to the great room, there is a second sunny family room which opens to the completely enclosed back porch where you will enjoy year-round living with an in-wall heating/AC unit. The primary bedroom features an en-suite bath w/ WC & his-and-hers walk-in closets. The other 2 bedrooms offer flexible office or bedroo
Key facts
- 0.27 acre lot
- 3 garage spots
- Built 1997
Property features AI
Exterior
- Parking: Attached garage; 3-car garage; Garage with door opener; Off-street parking
- Utilities: Public water; Public sewer; Natural gas
- Home design: Single-family site-built home; One story
- Construction: Brick, vinyl siding, and wood siding exterior; Slab foundation
- Exterior features: Enclosed porch; Partial privacy fencing; Located on a cul-de-sac; Level lot
Interior
- Kitchen: Disposal; Dishwasher; Microwave; Refrigerator; Electric range; Kitchen island
- Bedrooms: Main level bedrooms
- Flooring: Carpet; Vinyl
- Bathrooms: 2 full bathrooms; 1 half bathroom; 3 bathrooms on the main level
- Heating & cooling: Natural gas forced air heating; Central air conditioning; Ceiling fans
- Interior features: Cathedral ceilings; Tray ceilings; Entrance foyer; Ceiling fans; Kitchen island; Walk-in closets; Skylights; Window treatments
- Laundry & utility: Washer; Dryer; Main level laundry
Neighborhood map
What this means for you Summary
Snapshot
- This is a 3-bed/2.5-bath single-family listed at $298k.
Deal economics
- At list price, monthly cash flow is $-228 ($-3k/yr) — negative.
- To cash-flow at today's rent, offer at most $258k (13.5% below list).
- To meet the 1% rule (rent ≥ 1% of price), the offer needs to be $211k (29.2% below list).
- Recommended offer: $211k (29.2% below list) — sets the bar for 1% rule.
Location & tenants
- Location reads 84/100 on livability (#6 in IN, #676 nationally) — a professional / high-income tenant draw. Strengths: amenities A+, commute A+, cost of living A+; Watch: crime C-, employment D+.
- Northwest Allen County Schools (rural): math 51% / reading 58% proficiency, ranked #25 of 301 in IN (top 8%) — acceptable for families but not a draw, mixed tenant base, ~2y average lease; only 11% free/reduced lunch — higher-income household profile.
- Zoned schools: Hickory Center Elementary School (math 60% / reading 54%, grade C+, #172 of 994 statewide, top 18%, 462 students, 25% FRL); Carroll Middle School (math 39% / reading 55%, grade D+, #65 of 330 statewide, top 21%, 994 students, 29% FRL); Carroll High School (math 59% / reading 86%, grade B+, #10 of 369 statewide, top 3%, 2,554 students, 21% FRL).
- Market conditions: Rents rising fast (+7.6%/yr); 329 active listings in the ZIP; 3 comparable units currently listed for rent nearby; rentals at typical pace (median 15d on market — plan ~3-4 weeks tenant-placement turnaround); solid renter incomes; 1,861 units permitted in Allen County in 2024 (576 in 5+ unit buildings).
- This rent runs 31% of the median local income ($81k/yr) — at the standard rent-burdened threshold; future hikes will face affordability resistance.
Forward outlook
- Local home prices are declining (-3.0%/yr); year-one equity from $2k of loan paydown is wiped out by about $9k of value loss. Plan a longer hold.
- Allen County population projected at +10% by 2050 — modest demand growth; plan on rents tracking national, not racing it.
Negotiation context
- Only 6 days on market — expect competitive offers; lowballing is unlikely to land.
Questions for the listing agent
- What do current leases actually rent for vs. the listed asking? Can we see a recent rent roll and the last 12 months of T-12 income?
- Is there a deadline driving the sale (1031 exchange, divorce, estate, relocation)? That informs how much negotiation room exists.
- Schools are D-rated, which usually means shorter tenancies and higher turnover. Who's the typical renter profile here, and what's been the actual vacancy rate?
- The area grade is low — what's the realistic commute time and amenity access for the typical tenant pool here? Any planned neighborhood developments (good or bad) we should know about?
- What's the average days-on-market for RENTAL listings here right now (not sales)? A rising rental-DOM trend means longer vacancies and softer asking-rent achievability than the comps imply.
- What's the recent tenant-quality profile in this submarket — average credit score on applications, eviction rate, late-payment / NSF rate, and stable-employment percentage? A property-management company in the area should have these aggregated.
- How much new for-sale + rental construction is in the pipeline within 1–3 miles? Heavy new supply typically softens prices + rents 12–24 months out; constrained supply supports both.
Investment metrics
- 1% rule
- 0.71% ✗
- Cap rate
- 5.38%
- Cash-on-cash
- -3.28%
- DSCR
- 0.85
- GRM
- 11.8
CMA / ARV
- ARV (median comp)
- $316,883
- List price
- $298,000
- Delta
- -5.96%
- Verdict
- FAIR
- Comps
- 20 within 1.0 mi
Show comp detail 12 sales within ~0.75 mi
| Address | Dist | Beds/Ba | Sqft | Sold | Price | $/sf | Match |
|---|---|---|---|---|---|---|---|
| 2028 Weather Wood Pl | 0.42mi | 3/2.5 | 1,689 (-1%) | 8mo | $283,500 | $168 | 72 |
| 2025 York Ridge Pl | 0.38mi | 3/2.5 | 1,607 (-6%) | 2mo | $329,900 | $205 | 71 |
| 1326 Bluff Pointe Way | 0.51mi | 3/2.5 | 1,700 (-0%) | 6mo | $299,900 | $176 | 70 |
| 11628 Leatherwood Run | 0.47mi | 3/2.0 | 1,705 (-0%) | 7mo | $347,500 | $204 | 70 |
| 1603 Bear Claw Ln | 0.41mi | 3/2.5 | 1,546 (-10%) | 4mo | $247,000 | $160 | 61 |
| 2607 Creeping Phlox Cv | 0.51mi | 3/2.5 | 1,839 (+8%) | 4mo | $284,900 | $155 | 60 |
| 1231 Bluff Pointe Way | 0.46mi | 3/2.0 | 1,569 (-8%) | 7mo | $285,600 | $182 | 58 |
| 12228 Shearwater Run | 0.74mi | 3/2.5 | 1,800 (+5%) | 0mo | $270,000 | $150 | 56 |
| 1034 Hemingford Ct | 0.59mi | 3/2.5 | 1,897 (+11%) | 2mo | $314,900 | $166 | 52 |
| 2529 Sweet Cider Rd | 0.69mi | 3/2.5 | 1,807 (+6%) | 8mo | $277,000 | $153 | 52 |
| 1923 Sweet Cider Rd | 0.51mi | 4/2.5 (+1) | 1,843 (+8%) | 8mo | $294,900 | $160 | 51 |
| 12012 Kimball Run | 0.52mi | 3/2.5 | 1,924 (+13%) | 7mo | $255,000 | $133 | 49 |
Match score weights: distance 35% · size 25% · config 20% · recency 20%. Top-matched comps best support the ARV.
Projected returns pro-forma
-3.0% appreciation · 7.64% rent growth · sell at horizon
- IRR
- -17.2%
- Equity multiple
- 0.37×
- Total profit
- $-52,563
- Equity at exit
- $44,433
- IRR
- -2.7%
- Equity multiple
- 0.78×
- Total profit
- $-18,164
- Equity at exit
- $25,766
Cash invested: $83,440 (down + closing). Projections, not guarantees.
Landlord ↔ Tenant lean methodology
- Overall (STATE)
- 90 Strongly Landlord-Friendly
- State Indiana
- 90 Strongly Landlord-Friendly · R+11
- County
- — inherits STATE
- City
- — inherits STATE
ZIP-level market 46818
- Rents YoY
- 7.6%
- Active inventory
- 329
- Price-to-rent
- 11.8×
Monthly cashflow live
- Estimated rent
- $2,110 medium interval (Pro) →
- Mortgage (P&I)
- −$1,563
- Tax from tax record
- −$208 /mo · $2,497/yr
- Insurance
- −$124
- HOA
- −$0
- Vacancy / Maint / Mgmt
- −$443
- Net cashflow
- $-228
Break-even live
Sensitivity live
| Price | -10% $-59 | -5% $-144 | +0% $-228 | +5% $-312 | +10% $-397 |
|---|---|---|---|---|---|
| Rent | -10% $-395 | -5% $-311 | +0% $-228 | +5% $-145 | +10% $-61 |
| Rate | -1.0pp $-78 | -0.5pp $-152 | base $-228 | +0.5pp $-305 | +1.0pp $-384 |
UW: 25.0% down · 7.5% · 30yr · 1.5% tax · 5.0% vac · 8.0% maint · 8.0% mgmt
Financing live
Cash to close
- Down payment
- $74,500
- Closing costs
- $8,940
- Reserves months
- —
- Total cash needed
- —
Loan-product check · same deal, 3 products live
Conventional
25% down · 7.5% · 30yr
- Down + closing
- —
- Monthly P&I
- —
- Monthly cashflow
- —
- DSCR
- —
- Eligible?
- —
Personal DTI + credit; lowest rate.
DSCR
20% down · 8.5% · 30yr
- Down + closing
- —
- Monthly P&I
- —
- Monthly cashflow
- —
- DSCR
- —
- Eligible?
- —
No personal income docs; deal must DSCR.
Hard money
10% down · 12.0% · 12mo
- Down + closing
- —
- Monthly P&I
- —
- Monthly cashflow
- —
- DSCR
- —
- Eligible?
- —
Short-term bridge; refi at stabilization.
Rent comps 3 comps
| Address | Beds | Baths | Sqft | Rent | $/sqft | DOM | Units | Dist |
|---|---|---|---|---|---|---|---|---|
| 1527 Flint Lock Ln Fort Wayne, IN | 3.0 | 2.5 | 1570 | $1,950 | $1.24 | 45d | 1 | 0.59mi |
| 10230 Avalon Way Fort Wayne, IN | 1.0–3.0 | 1.0–2.0 | 956 | $1,625 | $1.70 | 15d | 23 | 0.99mi |
| 3115 Carroll Rd Fort Wayne, IN | 3.0 | 2.0 | 1244 | $2,300 | $1.85 | 15d | 1 | 1.00mi |
Listing history 2 events
-
2026-05-30status $298,000 Pending 6 DOM
-
2026-05-15historical $298,000 1070-char remark
ⓘ Source: listings_history table (triggers on properties + properties_extension) + one-shot
backfill from property_details.listing_events for pre-trigger history.
Tax reassessment forecast IN · Partial reset (capped growth)
- Current annual tax
- $2,497 · $208/mo
- Projected year-2 tax
- $2,515 · $210/mo
- Expected delta
- +$18/yr (+$1/mo · 0.7%)
ⓘ Screening estimate from a state-policy table — verify with the county assessor before closing.
Climate risk First Street
- Flood 1/10 Low FEMA zone X (unshaded) · 0% chance over 30 yrs
- Wildfire 1/10 Low
- Heat 3/10 Moderate 7 d/yr ≥101°F today · 17 d/yr by 30 yrs out
- Wind 2/10 Low
- Air quality 2/10 Low 2 unhealthy d/yr today · 2 by 30 yrs out
Nearby sold comps map
Loading sold comps map…
Walkable amenities ~0.75 mi
Loading nearby amenities…
Taxation est. · year 1
- Rental income
- $25,323
- − Mortgage interest
- −$16,693
- − Property taxes
- −$2,497
- − Insurance
- −$1,490
- − Repairs & maintenance
- −$2,026
- − Management
- −$2,026
- − Depreciation
- −$8,669
- Taxable loss
- −$8,078
- Est. tax savings @ 24.0%
- +$1,939
- After-tax cash flow
- $-797/yr
For passive investors: Depreciation is non-cash, so a rental often shows a tax loss while cash-flowing — sheltering income. Rental losses are passive: they offset passive income freely, and up to $25,000/yr can offset ordinary (W-2) income if you actively participate and your MAGI is under $100k (phasing out to $0 by $150k); unused losses carry forward. On sale, claimed depreciation is recaptured at up to 25%, and gains may owe capital-gains tax (a 1031 exchange can defer both). Figures are a year-1 estimate at your 24.0% rate — not tax advice; consult a CPA.
Schools (NCES district)
- District
- Northwest Allen County Schools
- NCES district ID
- 1808250
- Math proficiency
- 51% ▼ -6.00%
- Reading proficiency
- 58% ▼ -5.00%
- Median HH income
- $78,952
- Composite
- 49.26/100
- National rank
- #2027
- State rank
- #25 of 301 in IN
Livability — Fort Wayne
- Score
- 84/100
- State rank
- #6
- US rank
- #676
Category grades
Schools grade is shown separately in the Schools card above.
Census & demographics
- Census place
- Fort Wayne, IN
- County
- Allen County · 326,813 people
- City population
- 326,813
- Metro
- Fort Wayne, IN
- Population (ZIP)
- 21,954
- Household income
- $81,066
- Rent vs Own
- Severe rent burden
- 101.0
Population outlook (Allen County) Hauer SSP2
- Today (2025)
- 394,020 people
- By 2030
- 405,128 · +2.8%
- By 2040
- 423,476 · +7.5%
- By 2050
- 435,137 · +10.4%
- By 2075
- 450,293 · +14.3%
- By 2100
- 424,101 · +7.6%
Race, ethnicity, and origin ACS 2023
- Neighborhood character
- Predominantly White (79%)
- Race & ethnicity
- White 79% Two or more races 8% Hispanic / Latino 7% Black 4% Asian 3%
- Hispanic origin (detail)
- Mexican 6%
- Common ancestry
- Italian 4% Slovak 3% Romanian 2%
- Foreign-born
- 8% · Canada, Vietnam, Philippines
- Languages at home
- 90% English-only · Spanish 4% Other Asian/Pacific 1% Vietnamese 1%
Political lean MEDSL · Allen
- 2024 margin
- R (+12.5) · D 42.9% · R 55.4% · Other 1.7%
- 2008→2024 swing
- -8.1pp toward R · 2008: -4.3pp · 2024: -12.5pp
- All cycles
- 2024: R+12.5 2020: R+11.2 2016: R+19.6 2012: R+16.8 2008: R+4.3
Not yet ingested
- Civics
- —
Market trends
- HPI YoY
- ▼ -217.71%
- Current HPI
- 228.1539
- Rent YoY
- ▲ 7.64%
- Metro
- Fort Wayne, IN
- State GDP YoY
- ▲ 2.90%
- F500 in state
- 18
Industry mix (Fortune 500 HQ in IN)
| Industry | F500 HQs | Revenue |
|---|---|---|
| Industrial Machinery | 2 | $37B |
|
||
| Healthcare | 1 | $177B |
|
||
| Pharmaceuticals | 1 | $45B |
|
||
| Metals / Steel | 1 | $18B |
|
||
| Agriculture | 1 | $17B |
|
||
| Packaging | 1 | $12B |
|
||
Price history
+0.0% since first listed3 events — show timeline
- 2026-05-29 Pending — IRMLS
- 2026-05-23 Listed $298,000 IRMLS
- 2026-05-15 Coming Soon $298,000 IRMLS
Property tax history
+3.1%/yrLatest (2024): $2,497 · +7.1% YoY. Source: county tax records.
Cash-flow waterfall
monthlySold comps — $/sqft
last 12 mo · ≤1 miLoading sold comps…