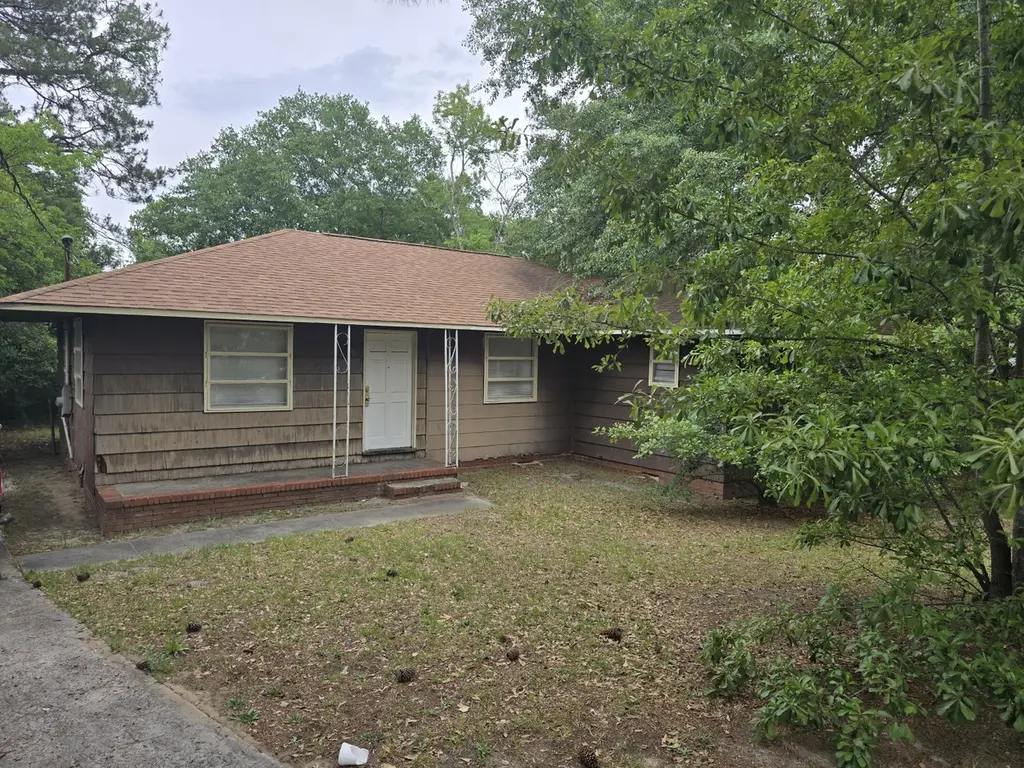
625 Hutchinson Dr · North Augusta, SC
Flood risk 1/10 · Minimal
- FEMA flood zone
- X (unshaded)
- Chance of flooding over 30 yrs
- 0.0%
- Est. flood insurance / yr
- $507 – $1,088
Fire risk 3/10 · Minor
- Est. fire insurance / yr
- $783 – $1,453
Heat risk 8/10 · Major
- Hot days now (above 107°F)
- 7 days/yr
- Hot days in 30 yrs
- 17 days/yr
Wind risk 6/10 · Moderate
- Chance of severe wind over 30 yrs
- 66.0%
Air-quality risk 3/10 · Minor
- Unhealthy air days now
- 3 days/yr
- Unhealthy air days in 30 yrs
- 4 days/yr
Risk factors via First Street. Map © Google.
Why this score? — see what drove the B grade
The composite is a weighted blend of 9 inputs, each scored 0–100. Each bar is that input's sub-score; the figure is the points it added to the 100-point composite (weight × sub-score).
- Cash flow +30.0/30.0
- 1% rule +10.0/10.0
- DSCR +10.0/10.0
- ARV discount +7.5/15.0
- Livability +3.6/5.0
- Rent growth +3.5/5.0
- Schools +3.2/10.0
- Condition / age +2.5/5.0
- Appreciation +0.0/10.0
$65,000
🖨 Deal sheet (PDF) 📄 Offer letter ✓ Due diligence
Listing remarks MLS
Ranch home in highly poor condition. Basically condemned. Enter with reservation and at own risk. Warning signs on front of house. No warranties or representations
Key facts
- Grocery stores
- Parks
- Schools
Tags
Property features AI
Finance
- Other: Lot is approximately 0.29 acres; Paved road access; No pool
- HOA & community: No community features listed
Exterior
- Parking: Driveway
- Utilities: Public water; Sewer: Other; Utilities: See remarks
- Home design: Single-family residence; One story
- Construction: Wood siding and other exterior materials; Shingle roof; Brick/mortar permanent foundation; Built as residential single family
- Exterior features: Front porch; Patio; Fenced yard; Storage structure
Interior
- Kitchen: Range; Refrigerator
- Bedrooms: 6 total rooms (bedrooms included in room count)
- Flooring: Brick
- Bathrooms: 2 full bathrooms
- Heating & cooling: Electric heating; Electric cooling
- Interior features: Range; Refrigerator; Brick flooring; Crawl space basement
Neighborhood map
What this means for you Summary
Snapshot
- This is a 4-bed/1.5-bath single-family listed at $65k.
Deal economics
- At list price, monthly cash flow is $1k ($12k/yr) — positive.
- The deal already cash-flows at list — no discount required.
- Meets the 1% rule at list price ($2k rent vs $65k).
- Cap rate 25.5% vs local median 3.9% in North Augusta — top-decile yield for the area; either an underpriced asset or a hidden risk that comps aren't pricing in. Stress-test before assuming the spread holds.
Location & tenants
- Location reads 71/100 on livability (#56 in SC) — a middle-class / working-renter tenant base. Strengths: crime A+, cost of living A+, housing A+; Watch: health & safety C-, amenities F, commute F.
- Aiken 01 (suburban): math 31% / reading 44% proficiency, ranked #36 of 80 in SC (top 45%) — families likely to look elsewhere, expect single-tenant / working-renter base with shorter leases.
- Zoned schools: North Augusta Elementary (math 45% / reading 46%, grade D-, #221 of 597 statewide, top 37%, 690 students, 34% FRL); North Augusta Middle (math 35% / reading 45%, grade F, #78 of 229 statewide, top 35%, 616 students, 43% FRL); North Augusta High (math 51% / reading 86%, grade B, #68 of 196 statewide, top 35%, 1,719 students, 42% FRL).
- Zoned-school proficiency averages 51% at this address vs 38% district-wide (+14 pts) — the actual schools serving this property are materially stronger than the Aiken 01 average implies; a family-tenant draw the district grade alone would hide.
- Market conditions: Rents rising (+3.9%/yr); 363 active listings in the ZIP; 2 comparable units currently listed for rent nearby; 2,500 units permitted in Aiken County in 2024 (1,023 in 5+ unit buildings).
Forward outlook
- Local home prices are declining (-3.0%/yr); year-one equity from $449 of loan paydown is wiped out by about $2k of value loss. Plan a longer hold.
- Aiken County population projected at +9% by 2050 — modest demand growth; plan on rents tracking national, not racing it.
- At projected returns (-3.0% appreciation + 3.9% rent growth), your $18k cash investment doubles in ~2 years — after that, you're playing with house money.
Negotiation context
- Only 6 days on market — expect competitive offers; lowballing is unlikely to land.
- 5 sale attempts since 22y ago with the ask held roughly flat each time — persistent listings suggest the price (not the market) is what's stuck; bring a comps-based counter.
- Current owner paid $2k; list at $65k implies a 2500% gain — meaningful room to come down on a strong offer.
Risks & watch-outs
- Watch-outs: built in 1952 — expect roof / HVAC / electrical / plumbing capex.
- Climate carrying-cost: major wind risk, 66% chance of damaging wind over 30y; extreme-heat days projected 7→17/yr by 2055 (HVAC capex compounding) — expect insurance premiums to compound above CPI over the hold.
Questions for the listing agent
- Built in 1952 — when were the roof, HVAC, electrical panel, plumbing, and water heater last replaced?
- Is there a deadline driving the sale (1031 exchange, divorce, estate, relocation)? That informs how much negotiation room exists.
- What's the average days-on-market for RENTAL listings here right now (not sales)? A rising rental-DOM trend means longer vacancies and softer asking-rent achievability than the comps imply.
- What's the recent tenant-quality profile in this submarket — average credit score on applications, eviction rate, late-payment / NSF rate, and stable-employment percentage? A property-management company in the area should have these aggregated.
- How much new for-sale + rental construction is in the pipeline within 1–3 miles? Heavy new supply typically softens prices + rents 12–24 months out; constrained supply supports both.
Investment metrics
- 1% rule
- 2.88% ✓
- Cap rate
- 25.48%
- Cash-on-cash
- 68.53%
- DSCR
- 4.05
- GRM
- 2.9
CMA / ARV
- ARV (on-the-fly)
- $195,600
- Comps found
- 11
Show comp detail 11 sales within ~0.75 mi
| Address | Dist | Beds/Ba | Sqft | Sold | Price | $/sf | Match |
|---|---|---|---|---|---|---|---|
| 625 Hutchinson Dr | 0.00mi | 4/2.0 | 1,304 (0%) | 1mo | $65,000 | $50 | 97 |
| 1014 Mckenzie St | 0.44mi | 3/1.5 (-1) | 1,298 (-0%) | 5mo | $168,750 | $130 | 70 |
| 1005 Weston St | 0.49mi | 4/2.0 | 1,289 (-1%) | 9mo | $179,900 | $140 | 66 |
| 1107 Terrace Cir | 0.54mi | 3/2.0 (-1) | 1,365 (+5%) | 1mo | $210,000 | $154 | 59 |
| 715 Mckenzie End | 0.28mi | 3/2.0 (-1) | 1,350 (+4%) | 18mo | $205,000 | $152 | 59 |
| 675 Seymour Dr | 0.31mi | 3/2.0 (-1) | 1,272 (-2%) | 21mo | $123,500 | $97 | 57 |
| 534 Hillcrest Dr | 0.29mi | 3/2.0 (-1) | 1,462 (+12%) | 5mo | $250,000 | $171 | 55 |
| 512 Hillcrest Ct | 0.43mi | 3/2.0 (-1) | 1,442 (+11%) | 3mo | $273,000 | $189 | 52 |
| 411 Katherine Ave | 0.70mi | 3/1.5 (-1) | 1,275 (-2%) | 12mo | $185,000 | $145 | 49 |
| 714 Seymour Dr | 0.47mi | 3/2.5 (-1) | 1,329 (+2%) | 23mo | $199,900 | $150 | 47 |
| 1130 Terrace Cir | 0.59mi | 3/1.5 (-1) | 1,250 (-4%) | 22mo | $208,000 | $166 | 42 |
Match score weights: distance 35% · size 25% · config 20% · recency 20%. Top-matched comps best support the ARV.
Projected returns pro-forma
-3.0% appreciation · 3.94% rent growth · sell at horizon
- IRR
- 69.0%
- Equity multiple
- 4.16×
- Total profit
- $57,474
- Equity at exit
- $9,692
- IRR
- 73.4%
- Equity multiple
- 8.85×
- Total profit
- $142,857
- Equity at exit
- $5,620
Cash invested: $18,200 (down + closing). Projections, not guarantees.
Landlord ↔ Tenant lean methodology
- Overall (STATE)
- 90 Strongly Landlord-Friendly
- State South Carolina
- 90 Strongly Landlord-Friendly · R+6
- County
- — inherits STATE
- City
- — inherits STATE
ZIP-level market 29841
- Rents YoY
- 3.9%
- Active inventory
- 363
- Price-to-rent
- 2.9×
Monthly cashflow live
- Estimated rent
- $1,873 medium interval (Pro) →
- Mortgage (P&I)
- −$341
- Tax from tax record
- −$72 /mo · $870/yr
- Insurance
- −$27
- HOA
- −$0
- Vacancy / Maint / Mgmt
- −$393
- Net cashflow
- $1,039
Break-even live
Sensitivity live
| Price | -10% $1,076 | -5% $1,058 | +0% $1,039 | +5% $1,021 | +10% $1,003 |
|---|---|---|---|---|---|
| Rent | -10% $891 | -5% $965 | +0% $1,039 | +5% $1,113 | +10% $1,187 |
| Rate | -1.0pp $1,072 | -0.5pp $1,056 | base $1,039 | +0.5pp $1,022 | +1.0pp $1,005 |
UW: 25.0% down · 7.5% · 30yr · 1.5% tax · 5.0% vac · 8.0% maint · 8.0% mgmt
Financing live
Cash to close
- Down payment
- $16,250
- Closing costs
- $1,950
- Reserves months
- —
- Total cash needed
- —
Loan-product check · same deal, 3 products live
Conventional
25% down · 7.5% · 30yr
- Down + closing
- —
- Monthly P&I
- —
- Monthly cashflow
- —
- DSCR
- —
- Eligible?
- —
Personal DTI + credit; lowest rate.
DSCR
20% down · 8.5% · 30yr
- Down + closing
- —
- Monthly P&I
- —
- Monthly cashflow
- —
- DSCR
- —
- Eligible?
- —
No personal income docs; deal must DSCR.
Hard money
10% down · 12.0% · 12mo
- Down + closing
- —
- Monthly P&I
- —
- Monthly cashflow
- —
- DSCR
- —
- Eligible?
- —
Short-term bridge; refi at stabilization.
Rent comps 2 comps
| Address | Beds | Baths | Sqft | Rent | $/sqft | DOM | Units | Dist |
|---|---|---|---|---|---|---|---|---|
| 735 Old Edgefield Rd North Augusta, SC | 3.0 | 1.5 | 1150 | $1,450 | $1.26 | 16d | 1 | 0.35mi |
| 418 Lecompte Ave North Augusta, SC | 4.0 | 2.0 | 1456 | $2,000 | $1.37 | 23d | 1 | 0.85mi |
Listing history 12 events
-
2026-05-18status Pending
-
2026-05-12$65,000 Active
-
2010-05-20soldstatus $2,500 163-char remark
Show marketing remark (163 chars)
Ranch home in highly poor condition. Basically condemned. Enter with reservation and at own risk. Warning signs on front of house. No warranties or representations
-
2010-05-20soldstatus $2,500 163-char remark
Show marketing remark (163 chars)
Ranch home in highly poor condition. Basically condemned. Enter with reservation and at own risk. Warning signs on front of house. No warranties or representations
-
2010-04-19$2,500 163-char remark
Show marketing remark (163 chars)
Ranch home in highly poor condition. Basically condemned. Enter with reservation and at own risk. Warning signs on front of house. No warranties or representations
-
2010-04-19$2,500 163-char remark
Show marketing remark (163 chars)
Ranch home in highly poor condition. Basically condemned. Enter with reservation and at own risk. Warning signs on front of house. No warranties or representations
-
2004-05-27soldstatus $34,000
-
2004-04-28soldstatus $34,000
-
2004-04-28soldstatus $34,000
-
2004-04-06$37,900
-
2004-04-06$37,900
-
1990-06-01soldstatus $37,533
ⓘ Source: listings_history table (triggers on properties + properties_extension) + one-shot
backfill from property_details.listing_events for pre-trigger history.
Tax reassessment forecast SC · Resets to sale price
- Current annual tax
- $870 · $72/mo
- Projected year-2 tax
- $870 · $72/mo
- Expected delta
- $0/yr ($0/mo · 0.0%)
ⓘ Screening estimate from a state-policy table — verify with the county assessor before closing.
Climate risk First Street
- Flood 1/10 Low FEMA zone X (unshaded) · 0% chance over 30 yrs
- Wildfire 3/10 Moderate
- Heat 8/10 Severe 7 d/yr ≥107°F today · 17 d/yr by 30 yrs out
- Wind 6/10 Major 66% chance of damaging wind over 30 yrs
- Air quality 3/10 Moderate 3 unhealthy d/yr today · 4 by 30 yrs out
Nearby sold comps map
Loading sold comps map…
Walkable amenities ~0.75 mi
Loading nearby amenities…
Taxation est. · year 1
- Rental income
- $22,477
- − Mortgage interest
- −$3,641
- − Property taxes
- −$870
- − Insurance
- −$325
- − Repairs & maintenance
- −$1,798
- − Management
- −$1,798
- − Depreciation
- −$1,891
- Taxable income
- $12,154
- Est. tax owed @ 24.0%
- −$2,917
- After-tax cash flow
- $9,555/yr
For passive investors: Depreciation is non-cash, so a rental often shows a tax loss while cash-flowing — sheltering income. Rental losses are passive: they offset passive income freely, and up to $25,000/yr can offset ordinary (W-2) income if you actively participate and your MAGI is under $100k (phasing out to $0 by $150k); unused losses carry forward. On sale, claimed depreciation is recaptured at up to 25%, and gains may owe capital-gains tax (a 1031 exchange can defer both). Figures are a year-1 estimate at your 24.0% rate — not tax advice; consult a CPA.
Schools (NCES district)
- District
- Aiken 01
- NCES district ID
- 4500720
- Math proficiency
- 31% ▼ -11.00%
- Reading proficiency
- 44% ▼ -1.00%
- Median HH income
- $45,081
- Composite
- 31.91/100
- National rank
- #5857
- State rank
- #36 of 80 in SC
Livability — North Augusta
- Score
- 71/100
- State rank
- #56
- US rank
- #7190
Category grades
Schools grade is shown separately in the Schools card above.
Census & demographics
- County
- Aiken County · 116,534 people
- City population
- 50,543
- Metro
- Augusta-Richmond County, GA-SC
- Population (ZIP)
- 32,342
- Household income
- $71,606
- Rent vs Own
- Severe rent burden
- 870.0
Population outlook (Aiken County) Hauer SSP2
- Today (2025)
- 178,003 people
- By 2030
- 182,876 · +2.7%
- By 2040
- 189,970 · +6.7%
- By 2050
- 193,840 · +8.9%
- By 2075
- 199,453 · +12.1%
- By 2100
- 192,403 · +8.1%
Race, ethnicity, and origin ACS 2023
- Neighborhood character
- Predominantly White (71%)
- Race & ethnicity
- White 71% Black 17% Hispanic / Latino 7% Two or more races 7%
- Hispanic origin (detail)
- Puerto Rican 2%
- Common ancestry
- Italian 3% Lithuanian 3% Serbian 2%
- Foreign-born
- 3% · Canada, Guatemala, Jamaica
- Languages at home
- 93% English-only · Spanish 5% French/Haitian/Cajun 1% Other Asian/Pacific 1%
Political lean MEDSL · Aiken
- 2024 margin
- Strong R (+25.9) · D 36.4% · R 62.2% · Other 1.4%
- 2008→2024 swing
- -1.9pp toward R · 2008: -24.0pp · 2024: -25.9pp
- All cycles
- 2024: R+25.9 2020: R+22.7 2016: R+27.5 2012: R+26.0 2008: R+24.0
Not yet ingested
- Civics
- —
Market trends
- HPI YoY
- ▼ -180.37%
- Current HPI
- 237.1442
- Rent YoY
- ▲ 3.94%
- Metro
- Augusta-Richmond County, GA-SC
- State GDP YoY
- ▲ 4.51%
- F500 in state
- 2
Industry mix (Fortune 500 HQ in SC)
| Industry | F500 HQs | Revenue |
|---|---|---|
| Packaging | 1 | $7B |
|
||
Price history
+73.2% since first listed12 events — show timeline
- 2026-05-18 Pending — AMLS
- 2026-05-12 Listed $65,000 AMLS
- 2010-05-20 Sold (MLS) $2,500 Hive MLS
- 2010-05-20 Sold (MLS) $2,500 Hive MLS
- 2010-04-19 Listed $2,500 Hive MLS
- 2010-04-19 Listed $2,500 Hive MLS
- 2004-05-27 Sold (Public Records) $34,000 Public Records
- 2004-04-28 Sold (MLS) $34,000 Hive MLS
- 2004-04-28 Sold (MLS) $34,000 Hive MLS
- 2004-04-06 Listed $37,900 Hive MLS
- 2004-04-06 Listed $37,900 Hive MLS
- 1990-06-01 Sold (Public Records) $37,533 Public Records
Property tax history
+0.8%/yrLatest (2025): $870 · +8.4% YoY. Source: county tax records.
Cash-flow waterfall
monthlySold comps — $/sqft
last 12 mo · ≤1 miLoading sold comps…