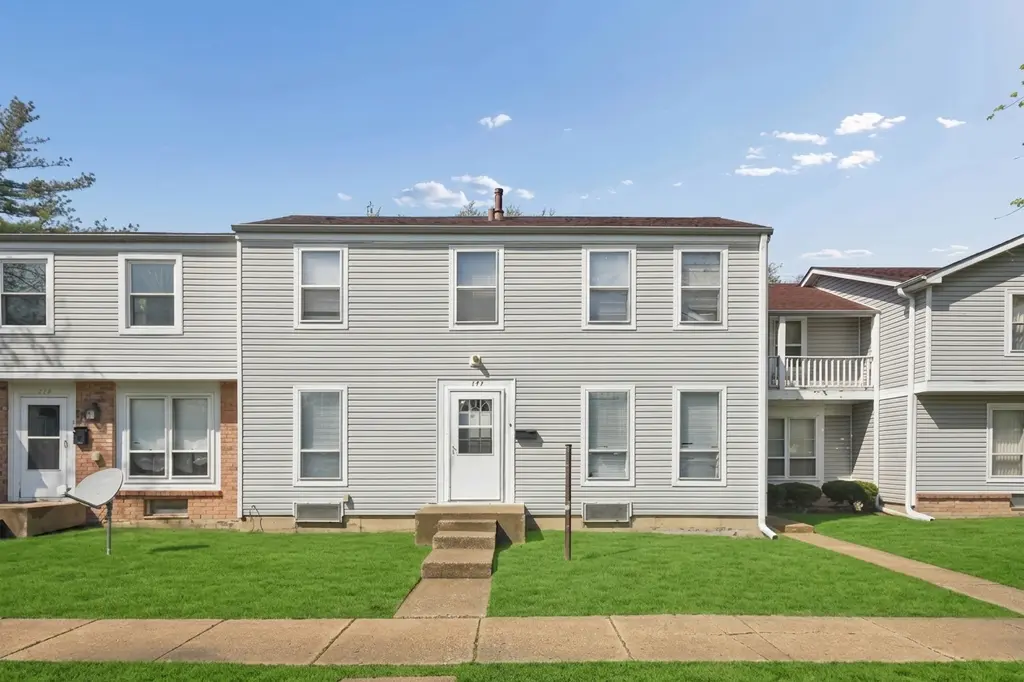
173 Williamsburg Rd · Country Club Hills, IL
Flood risk 1/10 · Minimal
- FEMA flood zone
- X (unshaded)
- Chance of flooding over 30 yrs
- 0.0%
- Est. flood insurance / yr
- $473 – $860
Fire risk 1/10 · Minimal
- Est. fire insurance / yr
- $804 – $1,492
Heat risk 3/10 · Minor
- Hot days now (above 101°F)
- 7 days/yr
- Hot days in 30 yrs
- 15 days/yr
Wind risk 2/10 · Minimal
- Chance of severe wind over 30 yrs
- —
Air-quality risk 3/10 · Minor
- Unhealthy air days now
- 4 days/yr
- Unhealthy air days in 30 yrs
- 4 days/yr
Risk factors via First Street. Map © Google.
Why this score? — see what drove the B- grade
The composite is a weighted blend of 9 inputs, each scored 0–100. Each bar is that input's sub-score; the figure is the points it added to the 100-point composite (weight × sub-score).
- Cash flow +30.0/30.0
- 1% rule +10.0/10.0
- DSCR +10.0/10.0
- ARV discount +7.5/15.0
- Livability +3.8/5.0
- Rent growth +2.5/5.0
- Condition / age +2.5/5.0
- Schools +0.9/10.0
- Appreciation +0.0/10.0
$69,900
🖨 Deal sheet (PDF) 📄 Offer letter ✓ Due diligence
Listing remarks
Incredible opportunity BACK ON MARKET in Country Club Hills! This 2-bedroom, 1.5-bath home offers the perfect mix of affordability and comfort, making it an excellent choice for first-time homebuyers looking to build equity and make a space their own. Recent updates include a roof replaced in 2023 and a newer water heater (approximately 1.5 years old), providing added peace of mind. The upper level includes 2 bedrooms that are connected with a Jack and Jill bathroom. The home also features a basement, offering extra storage, recreation space, or future finishing potential. With low monthly assessments and great value for the area, this is a fantastic opportunity to own instead of rent.
Key facts
- Extra storage
- Newer water heater
- Recreation space
Tags
Neighborhood map
What this means for you Summary
Snapshot
- This is a 3-bed/1.5-bath townhouse listed at $70k.
Deal economics
- At list price, monthly cash flow is $1k ($14k/yr) — positive.
- The deal already cash-flows at list — no discount required.
- Meets the 1% rule at list price ($2k rent vs $70k).
- Cap rate 25.9% vs local median 6.7% in Country Club Hills — top-decile yield for the area; either an underpriced asset or a hidden risk that comps aren't pricing in. Stress-test before assuming the spread holds.
Location & tenants
- Location reads 75/100 on livability (#212 in IL, #3,963 nationally) — a middle-class / working-renter tenant base. Strengths: commute A+, cost of living A+, housing A+; Watch: crime D+, health & safety D+, amenities F.
- Rich Twp Hsd 227 (suburban): math 5% / reading 12% proficiency, ranked #577 of 620 in IL (top 93%) — low school quality limits family demand, transient renter base, plan for 1-2y turnover.
- Zoned schools: Zenon J Sykuta School (404 students, 0% FRL); Southwood Middle School (math 2% / reading 8%, grade F, #636 of 665 statewide, top 98%, 381 students, 0% FRL); Rich Township High School (math 5% / reading 12%, grade F, #584 of 693 statewide, top 85%, 2,487 students, 0% FRL).
- Market conditions: 91 active listings in the ZIP; 10 comparable units currently listed for rent nearby; rentals leasing fast (median 0d on market — plan ~1-2 weeks tenant-placement turnaround); 6,272 units permitted in Cook County in 2024 (4,658 in 5+ unit buildings).
Forward outlook
- Local home prices are declining (-3.0%/yr); year-one equity from $483 of loan paydown is wiped out by about $2k of value loss. Plan a longer hold.
- At projected returns (-3.0% appreciation + 3.0% rent growth), your $20k cash investment doubles in ~2 years — after that, you're playing with house money.
Negotiation context
- Only 11 days on market — expect competitive offers; lowballing is unlikely to land.
- 4 sale attempts; this cycle's ask is 17% above the opening price — seller raised mid-cycle; expect resistance to lowballs.
- Current owner paid $50k; 39% above their basis — modest negotiation headroom, anchor on the comps not their cost.
Questions for the listing agent
- Built in 1970 — when were the roof, HVAC, electrical panel, plumbing, and water heater last replaced?
- What does the HOA fee cover, when was the last increase, and are there any pending special assessments or reserve-fund shortfalls?
- Is there a deadline driving the sale (1031 exchange, divorce, estate, relocation)? That informs how much negotiation room exists.
- Schools are F-rated, which usually means shorter tenancies and higher turnover. Who's the typical renter profile here, and what's been the actual vacancy rate?
- Crime grade is D in this area — have there been break-ins, vandalism, or insurance claims at this property in the last 3 years? What carrier currently insures it and at what premium?
- What's the average days-on-market for RENTAL listings here right now (not sales)? A rising rental-DOM trend means longer vacancies and softer asking-rent achievability than the comps imply.
- What's the recent tenant-quality profile in this submarket — average credit score on applications, eviction rate, late-payment / NSF rate, and stable-employment percentage? A property-management company in the area should have these aggregated.
- How much new for-sale + rental construction is in the pipeline within 1–3 miles? Heavy new supply typically softens prices + rents 12–24 months out; constrained supply supports both.
Investment metrics
- 1% rule
- 3.24% ✓
- Cap rate
- 25.90%
- Cash-on-cash
- 70.03%
- DSCR
- 4.12
- GRM
- 2.6
CMA / ARV
- ARV (on-the-fly)
- $158,080
- Comps found
- 12
Show comp detail 12 sales within ~0.75 mi
| Address | Dist | Beds/Ba | Sqft | Sold | Price | $/sf | Match |
|---|---|---|---|---|---|---|---|
| 1101 Williamsburg Rd | 0.05mi | 4/2.0 (+1) | 1,200 (-1%) | 0mo | $185,000 | $154 | 88 |
| 1135 Williamsburg Rd | 0.10mi | 3/1.5 | 1,248 (+3%) | 4mo | $130,000 | $104 | 88 |
| 4542 Windsor Ln | 0.14mi | 3/1.5 | 1,306 (+7%) | 0mo | $175,000 | $134 | 81 |
| 2265 Windsor Ln | 0.12mi | 2/1.5 (-1) | 1,200 (-1%) | 11mo | $134,900 | $112 | 78 |
| 2321 Windsor Ln | 0.11mi | 3/1.0 | 1,160 (-5%) | 10mo | $165,000 | $142 | 77 |
| 165 Williamsburg Rd | 0.03mi | 3/2.5 | 1,304 (+7%) | 14mo | $145,000 | $111 | 70 |
| 4474 Provincetown Dr | 0.18mi | 3/1.5 | 1,304 (+7%) | 12mo | $160,000 | $123 | 70 |
| 2323 Windsor Ln | 0.12mi | 3/2.5 | 1,375 (+13%) | 3mo | $90,000 | $65 | 66 |
| 4543 Windsor Ln | 0.14mi | 3/2.5 | 1,375 (+13%) | 12mo | $180,000 | $131 | 57 |
| 18600 Village West Dr #303 | 0.72mi | 2/2.0 (-1) | 1,180 (-3%) | 1mo | $153,000 | $130 | 54 |
| 18600 Village West Dr #206 | 0.72mi | 2/2.0 (-1) | 1,250 (+3%) | 4mo | $155,000 | $124 | 51 |
| 3505 Lakeview Dr #204 | 0.64mi | 2/2.0 (-1) | 1,350 (+11%) | 6mo | $195,000 | $144 | 39 |
Match score weights: distance 35% · size 25% · config 20% · recency 20%. Top-matched comps best support the ARV.
Projected returns pro-forma
-3.0% appreciation · 3.0% rent growth · sell at horizon
- IRR
- 69.6%
- Equity multiple
- 4.14×
- Total profit
- $61,551
- Equity at exit
- $10,422
- IRR
- 73.7%
- Equity multiple
- 8.55×
- Total profit
- $147,816
- Equity at exit
- $6,044
Cash invested: $19,572 (down + closing). Projections, not guarantees.
Landlord ↔ Tenant lean methodology
- Overall (STATE)
- 43 Moderately Tenant-Leaning
- State Illinois
- 43 Moderately Tenant-Leaning · D+7
- County
- — inherits STATE
- City
- — inherits STATE
ZIP-level market 60478
- Home prices YoY
- -27.3%
- Active inventory
- 91
- Price-to-rent
- 2.6×
Monthly cashflow live
- Estimated rent
- $2,266 high interval (Pro) →
- Mortgage (P&I)
- −$367
- Tax est. 1.5%
- −$87 /mo · $1,048/yr
- Insurance
- −$29
- HOA
- −$165
- Vacancy / Maint / Mgmt
- −$476
- Net cashflow
- $1,142
Break-even live
Sensitivity live
| Price | -10% $1,190 | -5% $1,166 | +0% $1,142 | +5% $1,118 | +10% $1,094 |
|---|---|---|---|---|---|
| Rent | -10% $963 | -5% $1,053 | +0% $1,142 | +5% $1,232 | +10% $1,321 |
| Rate | -1.0pp $1,177 | -0.5pp $1,160 | base $1,142 | +0.5pp $1,124 | +1.0pp $1,106 |
UW: 25.0% down · 7.5% · 30yr · 1.5% tax · 5.0% vac · 8.0% maint · 8.0% mgmt
Financing live
Cash to close
- Down payment
- $17,475
- Closing costs
- $2,097
- Reserves months
- —
- Total cash needed
- —
Loan-product check · same deal, 3 products live
Conventional
25% down · 7.5% · 30yr
- Down + closing
- —
- Monthly P&I
- —
- Monthly cashflow
- —
- DSCR
- —
- Eligible?
- —
Personal DTI + credit; lowest rate.
DSCR
20% down · 8.5% · 30yr
- Down + closing
- —
- Monthly P&I
- —
- Monthly cashflow
- —
- DSCR
- —
- Eligible?
- —
No personal income docs; deal must DSCR.
Hard money
10% down · 12.0% · 12mo
- Down + closing
- —
- Monthly P&I
- —
- Monthly cashflow
- —
- DSCR
- —
- Eligible?
- —
Short-term bridge; refi at stabilization.
Rent comps 10 comps
| Address | Beds | Baths | Sqft | Rent | $/sqft | DOM | Units | Dist |
|---|---|---|---|---|---|---|---|---|
| 1153 Williamsburg Rd Country Club Hills, IL | 2.0 | 1.5 | 1216 | $1,900 | $1.56 | 0d | 1 | 0.04mi |
| 4453 Provincetown Dr Country Club Hills, IL | 3.0 | 2.5 | 1300 | $2,500 | $1.92 | 0d | 1 | 0.12mi |
| 2256 Windsor Ln Country Club Hills, IL | 3.0 | 1.0 | 1212 | $2,250 | $1.86 | 0d | 1 | 0.17mi |
| 18019 Ravisloe Ter Country Club Hills, IL | 3.0 | 1.5 | 1150 | $2,800 | $2.43 | 0d | 1 | 0.57mi |
| 17984 Amherst Ct Country Club Hills, IL | 2.0 | 1.0 | 1000 | $1,900 | $1.90 | 0d | 1 | 0.63mi |
| 3515 Bordeaux Ct Hazel Crest, IL | 4.0 | 2.0 | 1486 | $2,900 | $1.95 | 3d | 1 | 0.83mi |
| 17950 Michael Ave Country Club Hills, IL | 3.0 | 1.0 | 1400 | $2,195 | $1.57 | 0d | 1 | 1.05mi |
| 3212 Charlemagne Ave Hazel Crest, IL | 3.0 | 2.5 | 1412 | $2,650 | $1.88 | 0d | 1 | 1.13mi |
| 3501 177th St Country Club Hills, IL | 2.0 | 2.0 | 839 | $2,850 | $3.40 | 0d | 1 | 1.17mi |
| 17306 Peach Grove Ln Hazel Crest, IL | 4.0 | 1.0 | 1034 | $2,700 | $2.61 | 0d | 1 | 1.40mi |
HOA detail
- Monthly dues
- $165 · $1,980/yr
- Likely covers
- water
Listing history 28 events
-
2026-06-21days on market $69,900 Active 11 DOM
-
2026-06-18days on market $69,900 Active 8 DOM
-
2026-06-17days on market $69,900 Active 7 DOM
-
2026-06-16days on market $69,900 Active 6 DOM
-
2026-06-15days on market $69,900 Active 5 DOM
-
2026-06-13remarks 694-char remark
-
2026-06-13pricestatusdays on market $69,900 Active 3 DOM
-
2026-06-09days on market $59,900 Contingent - No Showings 20 DOM
-
2026-06-08days on market $59,900 Contingent - No Showings 19 DOM
-
2026-06-07days on market $59,900 Contingent - No Showings 18 DOM
-
2026-06-04statusdays on market $59,900 Contingent - No Showings 15 DOM
-
2026-06-03days on market $59,900 Active 14 DOM
-
2026-06-02days on market $59,900 Active 13 DOM
-
2026-06-01days on market $59,900 Active 12 DOM
-
2026-05-31days on market $59,900 Active 11 DOM
-
2026-05-20$59,900 Active
-
2026-05-20historical
-
2026-05-12Active
-
2026-05-12historical
-
2026-04-29Active
-
2026-03-23historical
-
2026-03-04price
-
2026-02-26price
-
2026-02-24price
-
2026-02-10price
-
2026-01-27Active
-
1995-01-10soldstatus $50,400
-
1994-10-20soldstatus $31,500
ⓘ Source: listings_history table (triggers on properties + properties_extension) + one-shot
backfill from property_details.listing_events for pre-trigger history.
Climate risk First Street
- Flood 1/10 Low FEMA zone X (unshaded) · 0% chance over 30 yrs
- Wildfire 1/10 Low
- Heat 3/10 Moderate 7 d/yr ≥101°F today · 15 d/yr by 30 yrs out
- Wind 2/10 Low
- Air quality 3/10 Moderate 4 unhealthy d/yr today · 4 by 30 yrs out
Nearby sold comps map
Loading sold comps map…
Walkable amenities ~0.75 mi
Loading nearby amenities…
Taxation est. · year 1
- Rental income
- $27,193
- − Mortgage interest
- −$3,915
- − Property taxes
- −$1,048
- − Insurance
- −$350
- − Repairs & maintenance
- −$2,175
- − Management
- −$2,175
- − HOA
- −$1,980
- − Depreciation
- −$2,033
- Taxable income
- $13,515
- Est. tax owed @ 24.0%
- −$3,244
- After-tax cash flow
- $10,462/yr
For passive investors: Depreciation is non-cash, so a rental often shows a tax loss while cash-flowing — sheltering income. Rental losses are passive: they offset passive income freely, and up to $25,000/yr can offset ordinary (W-2) income if you actively participate and your MAGI is under $100k (phasing out to $0 by $150k); unused losses carry forward. On sale, claimed depreciation is recaptured at up to 25%, and gains may owe capital-gains tax (a 1031 exchange can defer both). Figures are a year-1 estimate at your 24.0% rate — not tax advice; consult a CPA.
Schools (NCES district)
- District
- Rich Twp Hsd 227
- NCES district ID
- 1733420
- Math proficiency
- 5% ▼ -3.00%
- Reading proficiency
- 12% ▬ 0.00%
- Median HH income
- $56,056
- Composite
- 8.93/100
- National rank
- #9885
- State rank
- #577 of 620 in IL
Livability — Country Club Hills
- Score
- 75/100
- State rank
- #212
- US rank
- #3963
Category grades
Schools grade is shown separately in the Schools card above.
Census & demographics
- Census place
- Country Club Hills, IL
- City population
- 16,549
- Population (ZIP)
- 16,549
Population outlook (Cook County) Hauer SSP2
- Today (2025)
- 5,347,519 people
- By 2030
- 5,357,703 · +0.2%
- By 2040
- 5,324,924 · -0.4%
- By 2050
- 5,230,762 · -2.2%
- By 2075
- 4,785,735 · -10.5%
- By 2100
- 4,188,836 · -21.7%
Race, ethnicity, and origin ACS 2023
- Neighborhood character
- Predominantly Black (87%)
- Race & ethnicity
- Black 87% White 8% Hispanic / Latino 4% Two or more races 3%
- Common ancestry
- Romanian 1%
- Foreign-born
- 4% · Canada
- Languages at home
- 96% English-only · Spanish 2%
Political lean MEDSL · Cook
- 2024 margin
- Solid D (+42.0) · D 70.4% · R 28.4% · Other 1.2%
- 2008→2024 swing
- -11.4pp toward R · 2008: 53.4pp · 2024: 42.0pp
- All cycles
- 2024: D+42.0 2020: D+50.3 2016: D+53.0 2012: D+49.4 2008: D+53.4
Not yet ingested
- Civics
- —
Market trends
- HPI YoY
- ▼ -79.73%
- Current HPI
- 212.3917
- Rent YoY
- —
- Metro
- —
- State GDP YoY
- ▲ 1.59%
- F500 in state
- 60
Industry mix (Fortune 500 HQ in IL)
| Industry | F500 HQs | Revenue |
|---|---|---|
| Insurance | 4 | $201B |
|
||
| Consumer Goods | 4 | $87B |
|
||
| Industrial Machinery | 3 | $64B |
|
||
| Healthcare | 2 | $55B |
|
||
| Retail / Pharmacy | 1 | $148B |
|
||
| Agriculture / Food | 1 | $86B |
|
||
Price history
+90.2% since first listed13 events — show timeline
- 2026-05-20 Listing Removed — MRED as Distributed by MLS Grid
- 2026-05-20 Listed $59,900 MRED as Distributed by MLS Grid
- 2026-05-12 Listing Removed — MRED as Distributed by MLS Grid
- 2026-05-12 Listed — MRED as Distributed by MLS Grid
- 2026-04-29 Listed — MRED as Distributed by MLS Grid
- 2026-03-23 Listing Removed — MRED as Distributed by MLS Grid
- 2026-03-04 Price Changed — MRED as Distributed by MLS Grid
- 2026-02-26 Price Changed — MRED as Distributed by MLS Grid
- 2026-02-24 Price Changed — MRED as Distributed by MLS Grid
- 2026-02-10 Price Changed — MRED as Distributed by MLS Grid
- 2026-01-27 Listed — MRED as Distributed by MLS Grid
- 1995-01-10 Sold (Public Records) $50,400 Public Records
- 1994-10-20 Sold (Public Records) $31,500 Public Records
Property tax history
+6.7%/yrLatest (2023): $6,557 · +80.7% YoY. Source: county tax records.
Cash-flow waterfall
monthlySold comps — $/sqft
last 12 mo · ≤1 miLoading sold comps…