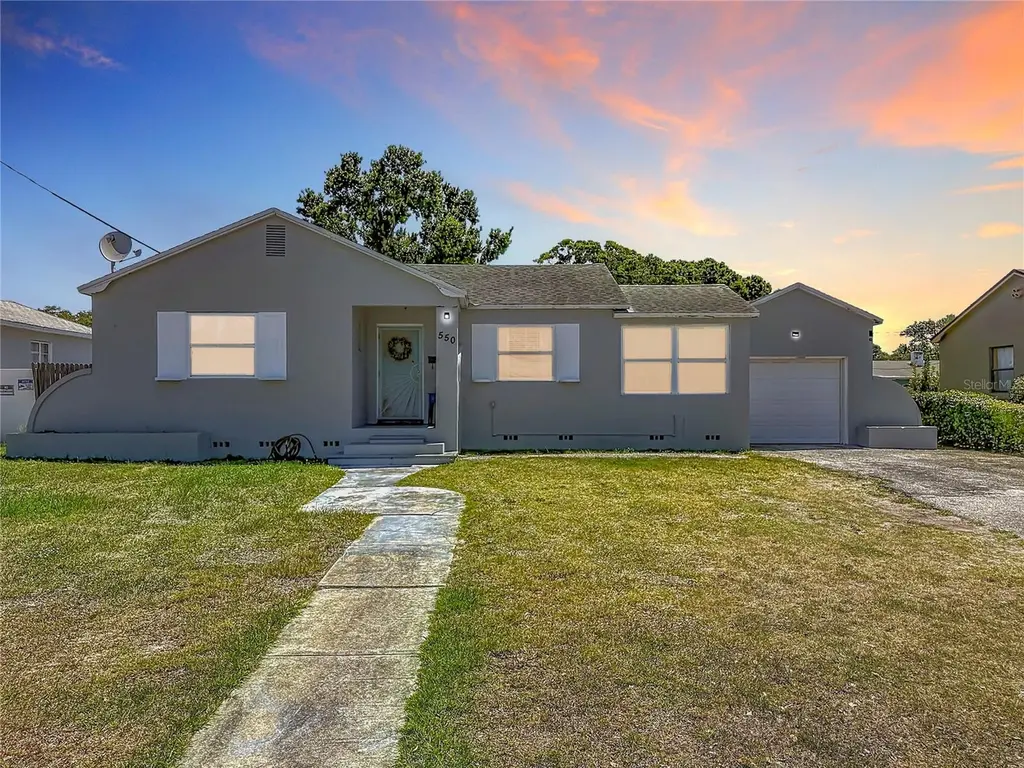
550 40th St S · St. Petersburg, FL
Flood risk 1/10 · Minimal
- FEMA flood zone
- X (unshaded)
- Chance of flooding over 30 yrs
- 0.0%
- Est. flood insurance / yr
- $507 – $1,088
Fire risk 1/10 · Minimal
- Est. fire insurance / yr
- $947 – $1,759
Heat risk 10/10 · Severe
- Hot days now (above 106°F)
- 7 days/yr
- Hot days in 30 yrs
- 26 days/yr
Wind risk 10/10 · Severe
- Chance of severe wind over 30 yrs
- 99.0%
Air-quality risk 4/10 · Minor
- Unhealthy air days now
- 4 days/yr
- Unhealthy air days in 30 yrs
- 4 days/yr
Risk factors via First Street. Map © Google.
Why this score? — see what drove the C grade
The composite is a weighted blend of 9 inputs, each scored 0–100. Each bar is that input's sub-score; the figure is the points it added to the 100-point composite (weight × sub-score).
- Cash flow +20.4/30.0
- ARV discount +14.4/15.0
- DSCR +6.5/10.0
- Schools +4.3/10.0
- 1% rule +4.1/10.0
- Livability +2.5/5.0
- Condition / age +2.5/5.0
- Rent growth +2.1/5.0
- Appreciation +0.0/10.0
$260,000
🖨 Deal sheet 📄 Offer letter ✓ Due diligence
Listing remarks MLS
Beautiful Floral colored home with a huge backyard and well maintained interior room. Knock down style walls. French doors and a combination wood and ceramic floors. Allowing for a fresh crisp starting point to add to your own creativity of decorating with various options of design. Although on the avenue traffic flow is light except for peak hours of the day. On one side of the house is lined with manicured hedges and the other is the one car garage for easy access. The entrance to the hall and bedroomsis an arch door way a touch of vintage. The house is located centrally close to Stores, schools , restaurants, the gulf beaches and the Interstate .
Key facts
- Split floor plan
- Subway tile flooring
- Large shed
Tags
Property features AI
Finance
- Financial info: Lease restrictions apply
- HOA & community: No association; Pets allowed (cats and dogs)
Exterior
- Parking: Attached garage (1 car)
- Utilities: Public water; Public sewer; Electricity available; Cable available; Broadband/high-speed internet available
- Home design: Single-family residence; One story; Faces west; Completed condition
- Construction: Stucco and frame construction; Shingle roof; Crawlspace foundation; Built on a 0.17-acre lot (approximately 71 x 106)
- Exterior features: Outdoor shower; Storage; Shed
Interior
- Kitchen: Range hood; Refrigerator
- Bedrooms: 3 bedrooms
- Flooring: Tile; Wood
- Bathrooms: 1 full bathroom
- Heating & cooling: Central heating (electric); Central air conditioning
- Interior features: Ceiling fans; Kitchen and family room combo; Living and dining room combo; Thermostat
- Laundry & utility: Inside laundry room; Washer hookup
Neighborhood map
What this means for you Summary
Snapshot
- This is a 3-bed/1.0-bath single-family listed at $260k.
Deal economics
- At list price, monthly cash flow is $338 ($4k/yr) — positive.
- The deal already cash-flows at list — no discount required.
- To meet the 1% rule (rent ≥ 1% of price), the offer needs to be $236k (9.3% below list).
- Recommended offer: $236k (9.3% below list) — sets the bar for 1% rule.
- Cap rate 7.9% vs local median 2.6% in St. Petersburg — top-decile yield for the area; either an underpriced asset or a hidden risk that comps aren't pricing in. Stress-test before assuming the spread holds.
Location & tenants
- Location reads: area grade C — affects rentability + tenant quality, not the cash-flow math above.
- Pinellas (suburban): math 51% / reading 51% proficiency, ranked #31 of 73 in FL (top 42%) — acceptable for families but not a draw, mixed tenant base, ~2y average lease.
- Market conditions: Rents soft (-1.5%/yr); 261 active listings in the ZIP; 40 comparable units currently listed for rent nearby; rentals leasing fast (median 11d on market — plan ~1-2 weeks tenant-placement turnaround); 2,676 units permitted in Pinellas County in 2024 (1,422 in 5+ unit buildings).
- This rent runs 43% of the median local income ($67k/yr) — at the standard rent-burdened threshold; future hikes will face affordability resistance.
Forward outlook
- Local home prices are declining (-3.0%/yr); year-one equity from $2k of loan paydown is wiped out by about $8k of value loss. Plan a longer hold.
- Pinellas County population projected at +14% by 2050 — modest demand growth; plan on rents tracking national, not racing it.
Negotiation context
- It's been on market 58 days — a 3% lower offer ($252k) is reasonable based on typical stale-listing flexibility.
- 5 sale attempts since 19y ago with the ask held roughly flat each time — persistent listings suggest the price (not the market) is what's stuck; bring a comps-based counter.
- Current owner paid $62k; list at $260k implies a 319% gain — meaningful room to come down on a strong offer.
Risks & watch-outs
- Watch-outs: built in 1948 — expect roof / HVAC / electrical / plumbing capex.
- Climate carrying-cost: severe wind risk, 99% chance of damaging wind over 30y; extreme-heat days projected 7→26/yr by 2055 (HVAC capex compounding) — expect insurance premiums to compound above CPI over the hold.
Questions for the listing agent
- It's been on market 58 days. Have you received any prior offers? Is the seller open to a 9% concession, seller financing, or rate buy-down credit?
- Built in 1948 — when were the roof, HVAC, electrical panel, plumbing, and water heater last replaced?
- Is there a deadline driving the sale (1031 exchange, divorce, estate, relocation)? That informs how much negotiation room exists.
- What's the average days-on-market for RENTAL listings here right now (not sales)? A rising rental-DOM trend means longer vacancies and softer asking-rent achievability than the comps imply.
- What's the recent tenant-quality profile in this submarket — average credit score on applications, eviction rate, late-payment / NSF rate, and stable-employment percentage? A property-management company in the area should have these aggregated.
- How much new for-sale + rental construction is in the pipeline within 1–3 miles? Heavy new supply typically softens prices + rents 12–24 months out; constrained supply supports both.
Investment metrics
- 1% rule
- 0.91% ✗
- Cap rate
- 7.85%
- Cash-on-cash
- 5.56%
- DSCR
- 1.25
- GRM
- 9.2
CMA / ARV
- ARV (on-the-fly)
- $307,436
- Comps found
- 12
Show comp detail 12 sales within ~0.75 mi
| Address | Dist | Beds/Ba | Sqft | Sold | Price | $/sf | Match |
|---|---|---|---|---|---|---|---|
| 4127 12th Ave S | 0.46mi | 3/1.0 | 1,032 (+1%) | 0mo | $300,000 | $291 | 76 |
| 119 37th St S | 0.39mi | 3/1.0 | 996 (-2%) | 4mo | $268,000 | $269 | 75 |
| 4340 3rd Ave S | 0.39mi | 3/2.0 | 1,054 (+4%) | 6mo | $370,000 | $351 | 67 |
| 4610 6th Ave S | 0.54mi | 3/2.0 | 1,078 (+6%) | 3mo | $337,000 | $313 | 59 |
| 4650 Emerson Ave S | 0.58mi | 2/1.0 (-1) | 978 (-4%) | 3mo | $322,500 | $330 | 59 |
| 4659 9th Ave S | 0.65mi | 3/2.0 | 1,060 (+4%) | 3mo | $295,000 | $278 | 57 |
| 4636 3rd Ave S | 0.60mi | 3/3.0 | 1,008 (-1%) | 7mo | $410,000 | $407 | 56 |
| 4400 3rd Ave S | 0.42mi | 2/1.0 (-1) | 1,135 (+12%) | 1mo | $221,900 | $196 | 56 |
| 4801 Emerson Ave S | 0.70mi | 2/2.0 (-1) | 1,044 (+3%) | 1mo | $315,000 | $302 | 54 |
| 4327 3rd Ave S | 0.39mi | 2/1.0 (-1) | 912 (-10%) | 8mo | $220,000 | $241 | 52 |
| 3336 Carlisle Ave S | 0.56mi | 2/1.0 (-1) | 928 (-9%) | 4mo | $240,000 | $259 | 51 |
| 4650 2nd Ave S | 0.64mi | 2/1.5 (-1) | 1,146 (+13%) | 1mo | $365,000 | $318 | 41 |
Match score weights: distance 35% · size 25% · config 20% · recency 20%. Top-matched comps best support the ARV.
Projected returns pro-forma
-3.0% appreciation · 0.0% rent growth · sell at horizon
- IRR
- -10.7%
- Equity multiple
- 0.62×
- Total profit
- $-27,674
- Equity at exit
- $38,767
- IRR
- -5.7%
- Equity multiple
- 0.68×
- Total profit
- $-23,652
- Equity at exit
- $22,480
Cash invested: $72,800 (down + closing). Projections, not guarantees.
Landlord ↔ Tenant lean methodology
- Overall (STATE)
- 87 Strongly Landlord-Friendly
- State Florida
- 87 Strongly Landlord-Friendly · R+3
- County
- — inherits STATE
- City
- — inherits STATE
ZIP-level market 33711
- Rents YoY
- -1.5%
- Active inventory
- 261
- Price-to-rent
- 9.2×
Monthly cashflow live
- Estimated rent
- $2,358 high interval (Pro) →
- Mortgage (P&I)
- −$1,363
- Tax from tax record
- −$53 /mo · $639/yr
- Insurance
- −$108
- HOA
- −$0
- Vacancy / Maint / Mgmt
- −$495
- Net cashflow
- $338
Break-even live
UW: 25.0% down · 7.5% · 30yr · 1.5% tax · 5.0% vac · 8.0% maint · 8.0% mgmt
Financing live
Cash to close
- Down payment
- $65,000
- Closing costs
- $7,800
- Reserves months
- —
- Total cash needed
- —
Loan-product check · same deal, 3 products live
Conventional
25% down · 7.5% · 30yr
- Down + closing
- —
- Monthly P&I
- —
- Monthly cashflow
- —
- DSCR
- —
- Eligible?
- —
Personal DTI + credit; lowest rate.
DSCR
20% down · 8.5% · 30yr
- Down + closing
- —
- Monthly P&I
- —
- Monthly cashflow
- —
- DSCR
- —
- Eligible?
- —
No personal income docs; deal must DSCR.
Hard money
10% down · 12.0% · 12mo
- Down + closing
- —
- Monthly P&I
- —
- Monthly cashflow
- —
- DSCR
- —
- Eligible?
- —
Short-term bridge; refi at stabilization.
Rent comps 40 comps
| Address | Beds | Baths | Sqft | Rent | $/sqft | DOM | Units | Dist |
|---|---|---|---|---|---|---|---|---|
| 404 Madison St S Saint Petersburg, FL | 3.0 | 1.0 | 1391 | $2,500 | $1.80 | 4d | 1 | 0.17mi |
| 4018 2nd Ave S Saint Petersburg, FL | 3.0 | 1.0 | 1176 | $2,095 | $1.78 | 4d | 1 | 0.28mi |
| 505 43rd St S Unit 5051/2 St. Petersburg, FL | 2.0 | 1.0 | 800 | $2,000 | $2.50 | 24d | 1 | 0.31mi |
| 3801 1st Ave S Saint Petersburg, FL | 2.0 | 1.0 | 900 | $1,975 | $2.19 | 17d | 1 | 0.39mi |
| 3550 2nd Ave S St. Petersburg, FL | 2.0 | 1.0 | 720 | $2,800 | $3.89 | 24d | 1 | 0.42mi |
| 3421 4th Ave S Saint Petersburg, FL | 2.0 | 1.5 | 938 | $1,805 | $1.92 | 4d | 1 | 0.46mi |
| 201 35th St S Saint Petersburg, FL | 2.0 | 1.0 | 850 | $1,680 | $1.98 | 2d | 1 | 0.46mi |
| 4519 5th Ave S Saint Petersburg, FL | 4.0 | 2.0 | 1448 | $2,900 | $2.00 | 3d | 1 | 0.50mi |
| 4541 6th Ave S Saint Petersburg, FL | 3.0 | 1.0 | 945 | $1,100 | $1.16 | 14d | 1 | 0.50mi |
| 3815 1st Ave N Unit A St. Petersburg, FL | 2.0 | 1.5 | 1100 | $1,950 | $1.77 | 24d | 1 | 0.50mi |
| 3815 1st Ave N Unit A St. Petersburg, FL | 2.0 | 1.5 | 700 | $1,895 | $2.71 | 10d | 1 | 0.50mi |
| 4029 13th Ave S St Petersburg, FL | 3.0 | 2.0 | 1152 | $2,650 | $2.30 | 24d | 1 | 0.52mi |
| 3938 2nd Ave N Saint Petersburg, FL | 2.0 | 1.0 | 1000 | $2,495 | $2.50 | 4d | 1 | 0.52mi |
| 3823 2nd Ave N Saint Petersburg, FL | 2.0 | 1.0 | 944 | $2,300 | $2.44 | 4d | 1 | 0.57mi |
| 4421 11th Ave S Saint Petersburg, FL | 3.0 | 2.0 | 945 | $2,000 | $2.12 | 4d | 1 | 0.58mi |
| 3844 Burlington Ave N Saint Petersburg, FL | 2.0 | 1.0 | 828 | $1,895 | $2.29 | 20d | 1 | 0.59mi |
| 3653 2nd Ave N Saint Petersburg, FL | 2.0 | 1.0 | 1024 | $2,500 | $2.44 | 24d | 1 | 0.60mi |
| 4537 10th Ave S Saint Petersburg, FL | 4.0 | 2.0 | 1046 | $2,690 | $2.57 | 4d | 1 | 0.61mi |
| 450 47th St S Saint Petersburg, FL | 3.0 | 1.0 | 960 | $2,950 | $3.07 | 4d | 1 | 0.62mi |
| 3535 14th Ave S Saint Petersburg, FL | 3.0 | 1.0 | 768 | $1,650 | $2.15 | 4d | 1 | 0.64mi |
| 1327 43rd St S Saint Petersburg, FL | 3.0 | 1.5 | 959 | $2,250 | $2.35 | 4d | 1 | 0.64mi |
| 4711 Fairfield Ave S Saint Petersburg, FL | 3.0 | 2.0 | 1135 | $2,800 | $2.47 | 4d | 1 | 0.64mi |
| 4736 5th Ave S Saint Petersburg, FL | 4.0 | 1.0 | 1224 | $1,895 | $1.55 | 4d | 1 | 0.67mi |
| 3720 3rd Ave N Unit 1/2 St. Petersburg, FL | 3.0 | 3.0 | 1392 | $3,000 | $2.16 | 24d | 1 | 0.68mi |
| 250 37th St N Saint Petersburg, FL | 2.0 | 1.0 | 826 | $1,813 | $2.19 | 7d | 1 | 0.68mi |
| 250 37th St N Saint Petersburg, FL | 2.0 | 1.0 | 826 | $1,798 | $2.18 | 4d | 1 | 0.68mi |
| 3145 4th Ave S St. Petersburg, FL | 2.0 | 1.5 | 938 | $2,020 | $2.15 | 24d | 1 | 0.70mi |
| 4700 10th Ave S Unit 1 St. Petersburg, FL | 4.0 | 2.0 | 1300 | $2,650 | $2.04 | 24d | 1 | 0.72mi |
| 4700 10th Ave S Saint Petersburg, FL | 3.0 | 2.0 | 1300 | $2,500 | $1.92 | 20d | 1 | 0.72mi |
| 3750 4th Ave N Saint Petersburg, FL | 2.0 | 1.0 | 881 | $2,100 | $2.38 | 24d | 1 | 0.72mi |
| 626 31st St S Saint Petersburg, FL | 3.0 | 1.0 | 1040 | $2,200 | $2.12 | 3d | 1 | 0.73mi |
| 1227 Fargo St S Unit 1 St. Petersburg, FL | 2.0 | 1.0 | 780 | $1,600 | $2.05 | 24d | 1 | 0.74mi |
| 1543 43rd St S Saint Petersburg, FL | 4.0 | 2.0 | 1198 | $3,495 | $2.92 | 4d | 1 | 0.75mi |
| 3603 16th Ave S Saint Petersburg, FL | 4.0 | 2.0 | 1235 | $3,000 | $2.43 | 4d | 1 | 0.75mi |
| 1147 32nd St S Saint Petersburg, FL | 2.0 | 1.0 | 780 | $1,350 | $1.73 | 14d | 1 | 0.75mi |
| 1642 39th St S Saint Petersburg, FL | 3.0 | 1.0 | 975 | $1,995 | $2.05 | 20d | 1 | 0.76mi |
| 1628 43rd St S Saint Petersburg, FL | 3.0 | 2.0 | 1045 | $2,100 | $2.01 | 24d | 1 | 0.77mi |
| 1665 37th St S Saint Petersburg, FL | 3.0 | 1.0 | 867 | $1,850 | $2.13 | 10d | 1 | 0.78mi |
| 4801 10th Ave S Unit 1 St. Petersburg, FL | 3.0 | 1.0 | 1100 | $2,200 | $2.00 | 24d | 1 | 0.78mi |
| 3435 3rd Ave N Saint Petersburg, FL | 1.0–2.0 | 1.0 | 772 | $1,795 | $2.32 | 2d | 4 | 0.80mi |
Listing history 28 events
-
2026-06-18days on market $260,000 Active 58 DOM
-
2026-06-17days on market $260,000 Active 57 DOM
-
2026-06-16days on market $260,000 Active 56 DOM
-
2026-06-15days on market $260,000 Active 55 DOM
-
2026-06-13days on market $260,000 Active 53 DOM
-
2026-06-09days on market $260,000 Active 49 DOM
-
2026-06-08days on market $260,000 Active 48 DOM
-
2026-06-07days on market $260,000 Active 47 DOM
-
2026-06-04days on market $260,000 Active 44 DOM
-
2026-06-03days on market $260,000 Active 43 DOM
-
2026-06-01days on market $260,000 Active 41 DOM
-
2026-05-31days on market $260,000 Active 40 DOM
-
2026-04-21$260,000 Active
-
2014-02-10soldstatus $62,000
-
2014-02-07soldstatus $62,000 660-char remark
Show marketing remark (660 chars)
Beautiful Floral colored home with a huge backyard and well maintained interior room. Knock down style walls. French doors and a combination wood and ceramic floors. Allowing for a fresh crisp starting point to add to your own creativity of decorating with various options of design. Although on the avenue traffic flow is light except for peak hours of the day. On one side of the house is lined with manicured hedges and the other is the one car garage for easy access. The entrance to the hall and bedroomsis an arch door way a touch of vintage. The house is located centrally close to Stores, schools , restaurants, the gulf beaches and the Interstate .
-
2013-08-15$65,000 660-char remark
Show marketing remark (660 chars)
Beautiful Floral colored home with a huge backyard and well maintained interior room. Knock down style walls. French doors and a combination wood and ceramic floors. Allowing for a fresh crisp starting point to add to your own creativity of decorating with various options of design. Although on the avenue traffic flow is light except for peak hours of the day. On one side of the house is lined with manicured hedges and the other is the one car garage for easy access. The entrance to the hall and bedroomsis an arch door way a touch of vintage. The house is located centrally close to Stores, schools , restaurants, the gulf beaches and the Interstate .
-
2012-03-13soldstatus $47,500
-
2012-02-29soldstatus $47,500 259-char remark
Show marketing remark (259 chars)
Non Short Sale!Fantastic house!lots of charm, wood floors, in fantastic condition, HVAC, Roof & kitchen updated 2008.Move In Condition New Sprinkler system installed in yard. Come see this charming house before someone else snatches it up. Could be 3 Br
-
2012-01-24$49,900 259-char remark
Show marketing remark (259 chars)
Non Short Sale!Fantastic house!lots of charm, wood floors, in fantastic condition, HVAC, Roof & kitchen updated 2008.Move In Condition New Sprinkler system installed in yard. Come see this charming house before someone else snatches it up. Could be 3 Br
-
2011-12-12soldstatus $35,000
-
2011-11-29soldstatus $35,000
-
2011-06-07$35,000
-
2008-04-21soldstatus $63,000
-
2007-10-01$73,500
-
1987-08-24soldstatus $43,800
-
1985-12-01soldstatus $35,000
-
1985-12-01soldstatus $48,400
-
1985-11-01soldstatus $28,100
ⓘ Source: listings_history table (triggers on properties + properties_extension) + one-shot
backfill from property_details.listing_events for pre-trigger history.
Tax reassessment forecast FL · Resets to sale price
- Current annual tax
- $639 · $53/mo
- Projected year-2 tax
- $2,158 · $180/mo
- Expected delta
- +$1,519/yr (+$127/mo · 237.8%)
ⓘ Screening estimate from a state-policy table — verify with the county assessor before closing.
Climate risk First Street
- Flood 1/10 Low FEMA zone X (unshaded) · 0% chance over 30 yrs
- Wildfire 1/10 Low
- Heat 10/10 Extreme 7 d/yr ≥106°F today · 26 d/yr by 30 yrs out
- Wind 10/10 Extreme 99% chance of damaging wind over 30 yrs
- Air quality 4/10 Moderate 4 unhealthy d/yr today · 4 by 30 yrs out
Nearby sold comps map
Loading sold comps map…
Walkable amenities ~0.75 mi
Loading nearby amenities…
Taxation est. · year 1
- Rental income
- $28,292
- − Mortgage interest
- −$14,564
- − Property taxes
- −$639
- − Insurance
- −$1,300
- − Repairs & maintenance
- −$2,263
- − Management
- −$2,263
- − Depreciation
- −$7,564
- Taxable loss
- −$301
- Est. tax savings @ 24.0%
- +$72
- After-tax cash flow
- $4,123/yr
For passive investors: Depreciation is non-cash, so a rental often shows a tax loss while cash-flowing — sheltering income. Rental losses are passive: they offset passive income freely, and up to $25,000/yr can offset ordinary (W-2) income if you actively participate and your MAGI is under $100k (phasing out to $0 by $150k); unused losses carry forward. On sale, claimed depreciation is recaptured at up to 25%, and gains may owe capital-gains tax (a 1031 exchange can defer both). Figures are a year-1 estimate at your 24.0% rate — not tax advice; consult a CPA.
Schools (NCES district)
- District
- Pinellas
- NCES district ID
- 1201560
- Math proficiency
- 51% ▼ -5.00%
- Reading proficiency
- 51% ▼ -3.00%
- Median HH income
- $46,270
- Composite
- 43.27/100
- National rank
- #3046
- State rank
- #31 of 73 in FL
Livability — St. Petersburg
No livability data for this city. (Only ~50 U.S. cities are tracked.)
Census & demographics
- Census place
- St. Petersburg, FL
- County
- Pinellas County · 939,478 people
- City population
- 249,151
- Metro
- Tampa-St. Petersburg-Clearwater, FL
- Population (ZIP)
- 20,013
- Household income
- $66,540
- Rent vs Own
- Severe rent burden
- 903.0
Population outlook (Pinellas County) Hauer SSP2
- Today (2025)
- 1,027,532 people
- By 2030
- 1,063,586 · +3.5%
- By 2040
- 1,125,020 · +9.5%
- By 2050
- 1,168,637 · +13.7%
- By 2075
- 1,265,188 · +23.1%
- By 2100
- 1,260,357 · +22.7%
Race, ethnicity, and origin ACS 2023
- Neighborhood character
- Diverse neighborhood (Simpson 0.59)
- Race & ethnicity
- White 45% Black 45% Hispanic / Latino 6% Two or more races 6%
- Hispanic origin (detail)
- Puerto Rican 1%
- Common ancestry
- Romanian 2% Lithuanian 2% Italian 1%
- Foreign-born
- 7% · Canada, Dominican Republic
- Languages at home
- 91% English-only · Spanish 4% French/Haitian/Cajun 3% Other Indo-European 1%
Political lean MEDSL · Pinellas
- 2024 margin
- Lean R (+5.2) · D 46.9% · R 52.1%
- 2008→2024 swing
- -13.5pp toward R · 2008: 8.3pp · 2024: -5.2pp
- All cycles
- 2024: R+5.2 2020: D+0.2 2016: R+1.1 2012: D+5.6 2008: D+8.3
Not yet ingested
- Civics
- —
Market trends
- HPI YoY
- ▼ -313.54%
- Current HPI
- 338.2712
- Rent YoY
- ▼ -1.47%
- Metro
- Tampa-St. Petersburg-Clearwater, FL
- State GDP YoY
- ▲ 3.28%
- F500 in state
- 36
Industry mix (Fortune 500 HQ in FL)
| Industry | F500 HQs | Revenue |
|---|---|---|
| Industrial Technology | 2 | $29B |
|
||
| Insurance | 2 | $17B |
|
||
| Retail | 1 | $60B |
|
||
| Technology Distribution | 1 | $58B |
|
||
| Homebuilding | 1 | $35B |
|
||
| Technology Manufacturing | 1 | $35B |
|
||
Price history
+825.3% since first listed16 events — show timeline
- 2026-04-21 Listed $260,000 Stellar MLS as Distributed by MLS Grid
- 2014-02-10 Sold (Public Records) $62,000 Public Records
- 2014-02-07 Sold (MLS) $62,000 Stellar MLS as Distributed by MLS Grid
- 2013-08-15 Listed $65,000 Stellar MLS as Distributed by MLS Grid
- 2012-03-13 Sold (Public Records) $47,500 Public Records
- 2012-02-29 Sold (MLS) $47,500 Stellar MLS as Distributed by MLS Grid
- 2012-01-24 Listed $49,900 Stellar MLS as Distributed by MLS Grid
- 2011-12-12 Sold (Public Records) $35,000 Public Records
- 2011-11-29 Sold (MLS) $35,000 Stellar MLS as Distributed by MLS Grid
- 2011-06-07 Listed $35,000 Stellar MLS as Distributed by MLS Grid
- 2008-04-21 Sold (MLS) $63,000 Stellar MLS as Distributed by MLS Grid
- 2007-10-01 Listed $73,500 Stellar MLS as Distributed by MLS Grid
- 1987-08-24 Sold (Public Records) $43,800 Public Records
- 1985-12-01 Sold (Public Records) $48,400 Public Records
- 1985-12-01 Sold (Public Records) $35,000 Public Records
- 1985-11-01 Sold (Public Records) $28,100 Public Records
Property tax history
-2.5%/yrLatest (2025): $639 · +7.3% YoY. Source: county tax records.
Cash-flow waterfall
monthlySold comps — $/sqft
last 12 mo · ≤1 miLoading sold comps…