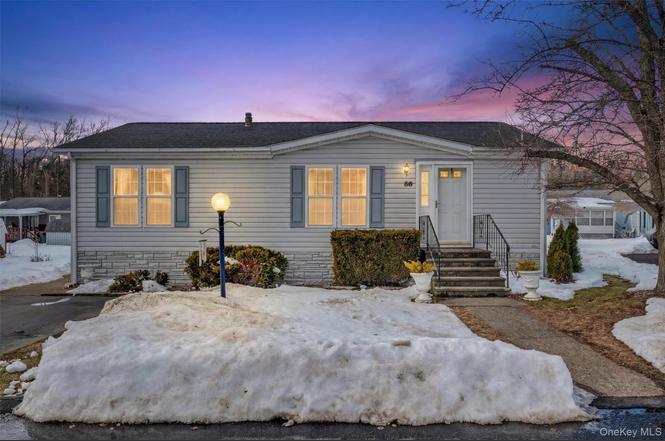
56 Fourth Dr · Haviland, NY
Flood risk 1/10 · Minimal
- FEMA flood zone
- X (unshaded)
- Chance of flooding over 30 yrs
- 0.0%
- Est. flood insurance / yr
- $507 – $1,088
Fire risk 2/10 · Minimal
- Est. fire insurance / yr
- $691 – $1,283
Heat risk 4/10 · Minor
- Hot days now (above 98°F)
- 7 days/yr
- Hot days in 30 yrs
- 15 days/yr
Wind risk 4/10 · Minor
- Chance of severe wind over 30 yrs
- 10.0%
Air-quality risk 2/10 · Minimal
- Unhealthy air days now
- 1 days/yr
- Unhealthy air days in 30 yrs
- 2 days/yr
Risk factors via First Street. Map © Google.
Why this score? — see what drove the C grade
The composite is a weighted blend of 9 inputs, each scored 0–100. Each bar is that input's sub-score; the figure is the points it added to the 100-point composite (weight × sub-score).
- Cash flow +24.7/30.0
- DSCR +8.0/10.0
- 1% rule +6.4/10.0
- Appreciation +5.0/10.0
- Schools +4.7/10.0
- Livability +3.2/5.0
- Rent growth +2.5/5.0
- Condition / age +2.5/5.0
- ARV discount +0.0/15.0
$175,000
🖨 Deal sheet 📄 Offer letter ✓ Due diligence
Listing remarks
Welcome to 56 Fourth Drive, nestled in the desirable Kensington Village Community of Hyde Park! This charming ranch-style mobile home offers comfortable, easy living with a spacious and functional layout. Step inside to find two generously sized bedrooms, each featuring large closets for ample storage. The primary suite includes a private full bath complete with a relaxing garden tub and shower, as well as a double-sink vanity. The second bedroom also offers a large closet and its own full bath—perfect for guests . The bright and spacious kitchen includes a dedicated dining area and sliding glass doors that lead to a sunny enclosed porch, creating the perfect spot to enjoy your mornin
Key facts
- Double-sink vanity
- Backyard and patio
- Sunny enclosed porch
Tags
Property features AI
Finance
- HOA & community: Monthly lot rent of $580
Exterior
- Parking: Driveway parking; Total parking for 2 vehicles
- Utilities: Septic tank; Propane service
- Home design: Manufactured home / Mobile home; Measured living area of 1,040
- Construction: Mobile/manufactured construction
- Exterior features: Covered patio/porch areas; Deck; Patio; Porch; Storage shed(s); Not waterfront
Interior
- Kitchen: Electric range; Refrigerator; Eat-in, open kitchen
- Bedrooms: Includes a bedroom on the first floor
- Flooring: Carpet; Linoleum
- Bathrooms: 2 full bathrooms
- Heating & cooling: Propane heating; No central cooling
- Interior features: First-floor bedroom; First-floor full bathroom; Chandelier; Eat-in kitchen; High ceilings; Open kitchen; Primary bathroom; Soaking tub; Washer/dryer hookup
- Laundry & utility: Washer and dryer included (washer, dryer listed); Washer/dryer hookup
Neighborhood map
What this means for you Summary
Snapshot
- This is a 2-bed/2.0-bath manufactured listed at $175k.
Deal economics
- At list price, monthly cash flow is $367 ($4k/yr) — positive.
- The deal already cash-flows at list — no discount required.
- Meets the 1% rule at list price ($2k rent vs $175k).
- Recommended offer: $170k (3.0% below list) — sets the bar for market timing.
- Cap rate 8.8% vs local median 4.2% in Haviland — top-decile yield for the area; either an underpriced asset or a hidden risk that comps aren't pricing in. Stress-test before assuming the spread holds.
Location & tenants
- Location reads 65/100 on livability (#712 in NY) — a middle-class / working-renter tenant base. Strengths: housing A+, crime A-, employment A-; Watch: cost of living C-, amenities F, commute F.
- Hyde Park Central School District (rural): math 43% / reading 62% proficiency, ranked #316 of 590 in NY (top 54%) — acceptable for families but not a draw, mixed tenant base, ~2y average lease.
- Zoned schools: Ralph R Smith School (math 22% / reading 32%, grade F, #1,786 of 2,108 statewide, top 86%, 340 students, 54% FRL); Haviland Middle School (math 23% / reading 57%, grade F, #413 of 729 statewide, top 57%, 759 students, 59% FRL); Franklin D Roosevelt Senior High School (math 93% / reading 90%, grade A+, #197 of 1,100 statewide, top 18%, 1,136 students, 52% FRL) — zoned schools average 55% FRL vs 34% district-wide (21 pts higher); higher-poverty schools than district average — tighter screening recommended.
- Market conditions: 6 active listings in the ZIP; 4 comparable units currently listed for rent nearby; rentals lingering (median 44d on market — plan ~5-8 weeks vacancy on turnover, expect pricing pressure); 50% of comp listings sitting > 30 days — soft ceiling on asking rent; 620 units permitted in Dutchess County in 2024 (242 in 5+ unit buildings).
Forward outlook
- In year one you build about $6k of equity ($1k loan paydown + $5k appreciation (3.0% local appreciation)).
- Dutchess County population projected at -11% by 2050 — secular population decline; favor cash flow + early exit over multi-decade hold.
- At projected returns (3.0% appreciation + 3.0% rent growth), your $49k cash investment doubles in ~5 years — after that, you're playing with house money.
- By year 6, paydown + projected appreciation supports a ~$34k cash-out refi (75% LTV) — recoverable capital for the next deal without selling this one.
Negotiation context
- It's been on market 47 days — a 3% lower offer ($170k) is reasonable based on typical stale-listing flexibility.
Questions for the listing agent
- It's been on market 47 days. Have you received any prior offers? Is the seller open to a 3% concession, seller financing, or rate buy-down credit?
- Is there a deadline driving the sale (1031 exchange, divorce, estate, relocation)? That informs how much negotiation room exists.
- What's the average days-on-market for RENTAL listings here right now (not sales)? A rising rental-DOM trend means longer vacancies and softer asking-rent achievability than the comps imply.
- What's the recent tenant-quality profile in this submarket — average credit score on applications, eviction rate, late-payment / NSF rate, and stable-employment percentage? A property-management company in the area should have these aggregated.
- How much new for-sale + rental construction is in the pipeline within 1–3 miles? Heavy new supply typically softens prices + rents 12–24 months out; constrained supply supports both.
Investment metrics
- 1% rule
- 1.14% ✓
- Cap rate
- 8.81%
- Cash-on-cash
- 8.99%
- DSCR
- 1.40
- GRM
- 7.3
CMA / ARV
- ARV (on-the-fly)
- $127,920
- Comps found
- 5
Show comp detail 5 sales within ~0.75 mi
| Address | Dist | Beds/Ba | Sqft | Sold | Price | $/sf | Match |
|---|---|---|---|---|---|---|---|
| 74 Hidden Brook Dr | 0.38mi | 2/1.0 | 1,056 (+2%) | 2mo | $145,000 | $137 | 74 |
| 14 Perry Rd #14 | 0.45mi | 2/2.0 | 1,056 (+2%) | 9mo | $130,000 | $123 | 69 |
| 52 Liberty Dr | 0.33mi | 3/2.0 (+1) | 1,056 (+2%) | 17mo | $156,000 | $148 | 63 |
| 17 Leisure Ln | 0.35mi | 2/1.0 | 1,000 (-4%) | 17mo | $110,000 | $110 | 59 |
| 1040 lot #25 Violet Ave #25 | 0.50mi | 2/1.0 | 980 (-6%) | 15mo | $59,999 | $61 | 51 |
Match score weights: distance 35% · size 25% · config 20% · recency 20%. Top-matched comps best support the ARV.
Projected returns pro-forma
3.0% appreciation · 3.0% rent growth · sell at horizon
- IRR
- 15.9%
- Equity multiple
- 1.91×
- Total profit
- $44,483
- Equity at exit
- $78,688
- IRR
- 17.5%
- Equity multiple
- 3.56×
- Total profit
- $125,669
- Equity at exit
- $121,267
Cash invested: $49,000 (down + closing). Projections, not guarantees.
Landlord ↔ Tenant lean methodology
- Overall (STATE)
- 15 Strongly Tenant-Friendly
- State New York
- 15 Strongly Tenant-Friendly · D+10
- County
- — inherits STATE
- City
- — inherits STATE
ZIP-level market 12738
- Active inventory
- 6
- Price-to-rent
- 7.3×
Monthly cashflow live
- Estimated rent
- $1,995 medium interval (Pro) →
- Mortgage (P&I)
- −$918
- Tax est. 1.5%
- −$219 /mo · $2,625/yr
- Insurance
- −$73
- HOA
- −$0
- Vacancy / Maint / Mgmt
- −$419
- Net cashflow
- $367
Break-even live
UW: 25.0% down · 7.5% · 30yr · 1.5% tax · 5.0% vac · 8.0% maint · 8.0% mgmt
Financing live
Cash to close
- Down payment
- $43,750
- Closing costs
- $5,250
- Reserves months
- —
- Total cash needed
- —
Loan-product check · same deal, 3 products live
Conventional
25% down · 7.5% · 30yr
- Down + closing
- —
- Monthly P&I
- —
- Monthly cashflow
- —
- DSCR
- —
- Eligible?
- —
Personal DTI + credit; lowest rate.
DSCR
20% down · 8.5% · 30yr
- Down + closing
- —
- Monthly P&I
- —
- Monthly cashflow
- —
- DSCR
- —
- Eligible?
- —
No personal income docs; deal must DSCR.
Hard money
10% down · 12.0% · 12mo
- Down + closing
- —
- Monthly P&I
- —
- Monthly cashflow
- —
- DSCR
- —
- Eligible?
- —
Short-term bridge; refi at stabilization.
Rent comps 4 comps
| Address | Beds | Baths | Sqft | Rent | $/sqft | DOM | Units | Dist |
|---|---|---|---|---|---|---|---|---|
| 21 Van Dam Rd Hyde Park, NY | 1.0 | 1.0 | 750 | $1,500 | $2.00 | 23d | 1 | 0.89mi |
| 81 Kerry Ct Hyde Park, NY | 2.0 | 1.5 | 1300 | $2,175 | $1.67 | 43d | 1 | 1.04mi |
| 51 Horseshoe Dr Hyde Park, NY | 2.0 | 1.0 | 1277 | $2,600 | $2.04 | 23d | 1 | 1.18mi |
| 9 Parker Ave Hyde Park, NY | 1.0 | 1.0 | 825 | $1,750 | $2.12 | 43d | 1 | 1.27mi |
Listing history 2 events
-
2026-04-20status Pending
-
2026-03-04$175,000 Active
ⓘ Source: listings_history table (triggers on properties + properties_extension) + one-shot
backfill from property_details.listing_events for pre-trigger history.
Climate risk First Street
- Flood 1/10 Low FEMA zone X (unshaded) · 0% chance over 30 yrs
- Wildfire 2/10 Low
- Heat 4/10 Moderate 7 d/yr ≥98°F today · 15 d/yr by 30 yrs out
- Wind 4/10 Moderate 10% chance of damaging wind over 30 yrs
- Air quality 2/10 Low 1 unhealthy d/yr today · 2 by 30 yrs out
Nearby sold comps map
Loading sold comps map…
Walkable amenities ~0.75 mi
Loading nearby amenities…
Taxation est. · year 1
- Rental income
- $23,944
- − Mortgage interest
- −$9,803
- − Property taxes
- −$2,625
- − Insurance
- −$875
- − Repairs & maintenance
- −$1,916
- − Management
- −$1,916
- − Depreciation
- −$5,091
- Taxable income
- $1,720
- Est. tax owed @ 24.0%
- −$413
- After-tax cash flow
- $3,991/yr
For passive investors: Depreciation is non-cash, so a rental often shows a tax loss while cash-flowing — sheltering income. Rental losses are passive: they offset passive income freely, and up to $25,000/yr can offset ordinary (W-2) income if you actively participate and your MAGI is under $100k (phasing out to $0 by $150k); unused losses carry forward. On sale, claimed depreciation is recaptured at up to 25%, and gains may owe capital-gains tax (a 1031 exchange can defer both). Figures are a year-1 estimate at your 24.0% rate — not tax advice; consult a CPA.
Schools (NCES district)
- District
- Hyde Park Central School District
- NCES district ID
- 3615180
- Math proficiency
- 43% ▼ -3.00%
- Reading proficiency
- 62% ▲ 15.00%
- Median HH income
- $68,932
- Composite
- 46.59/100
- National rank
- #2421
- State rank
- #316 of 590 in NY
Livability — Haviland
- Score
- 65/100
- State rank
- #712
- US rank
- #13550
Category grades
Schools grade is shown separately in the Schools card above.
Census & demographics
- Census place
- Haviland, NY
- Population (ZIP)
- 444
Population outlook (Dutchess County) Hauer SSP2
- Today (2025)
- 291,768 people
- By 2030
- 287,131 · -1.6%
- By 2040
- 274,881 · -5.8%
- By 2050
- 259,971 · -10.9%
- By 2075
- 235,366 · -19.3%
- By 2100
- 208,786 · -28.4%
Race, ethnicity, and origin ACS 2023
- Neighborhood character
- Predominantly White (68%)
- Race & ethnicity
- White 68% Hispanic / Latino 32% Two or more races 17%
- Hispanic origin (detail)
- Mexican 9%
- Foreign-born
- 21% · Canada, Jamaica
- Languages at home
- 68% English-only · Spanish 32%
Political lean MEDSL · Dutchess
- 2024 margin
- Lean D (+5.4) · D 52.7% · R 47.3%
- 2008→2024 swing
- -3.2pp toward R · 2008: 8.6pp · 2024: 5.4pp
- All cycles
- 2024: D+5.4 2020: D+9.6 2016: R+1.1 2012: D+6.6 2008: D+8.6
Not yet ingested
- Civics
- —
Market trends
- HPI YoY
- —
- Current HPI
- —
- Rent YoY
- —
- Metro
- —
- State GDP YoY
- ▲ 2.60%
- F500 in state
- 92
Industry mix (Fortune 500 HQ in NY)
| Industry | F500 HQs | Revenue |
|---|---|---|
| Financial Services | 10 | $950B |
|
||
| Consumer Goods | 9 | $162B |
|
||
| Insurance | 4 | $225B |
|
||
| Telecommunications | 2 | $144B |
|
||
| Pharmaceuticals | 2 | $112B |
|
||
| Media / Entertainment | 2 | $69B |
|
||
Price history
2 events — show timeline
- 2026-04-20 Pending — OneKey® MLS as Distributed by MLS Grid
- 2026-03-04 Listed $175,000 OneKey® MLS as Distributed by MLS Grid
Cash-flow waterfall
monthlySold comps — $/sqft
last 12 mo · ≤1 miLoading sold comps…