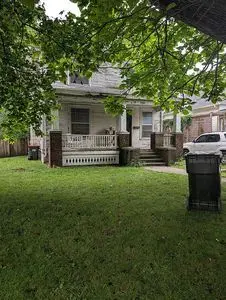
1207 N Jefferson Ave · Springfield, MO
Flood risk 1/10 · Minimal
- FEMA flood zone
- X (unshaded)
- Chance of flooding over 30 yrs
- 0.0%
- Est. flood insurance / yr
- $473 – $860
Fire risk 1/10 · Minimal
- Est. fire insurance / yr
- $1,054 – $1,958
Heat risk 5/10 · Moderate
- Hot days now (above 104°F)
- 7 days/yr
- Hot days in 30 yrs
- 19 days/yr
Wind risk 2/10 · Minimal
- Chance of severe wind over 30 yrs
- —
Air-quality risk 2/10 · Minimal
- Unhealthy air days now
- 1 days/yr
- Unhealthy air days in 30 yrs
- 2 days/yr
Risk factors via First Street. Map © Google.
Why this score? — see what drove the B grade
The composite is a weighted blend of 9 inputs, each scored 0–100. Each bar is that input's sub-score; the figure is the points it added to the 100-point composite (weight × sub-score).
- Cash flow +30.0/30.0
- 1% rule +10.0/10.0
- DSCR +10.0/10.0
- ARV discount +7.5/15.0
- Livability +3.8/5.0
- Rent growth +3.7/5.0
- Schools +3.2/10.0
- Condition / age +2.5/5.0
- Appreciation +0.0/10.0
$101,000
🖨 Deal sheet (PDF) 📄 Offer letter ✓ Due diligence
Listing remarks
House sold as is. It needs work. Great location near Drury, Central High School, and Midtown Library.
Key facts
- Built 1907
- Listed 6 days
Property features AI
Exterior
- Home design: Built in 1907
- Construction: Living area approximately 2,248 square feet
- Exterior features: Located in the Midtown subdivision
Neighborhood map
What this means for you Summary
Snapshot
- This is a 4-bed/1.5-bath single-family listed at $101k.
Deal economics
- At list price, monthly cash flow is $802 ($10k/yr) — positive.
- The deal already cash-flows at list — no discount required.
- Meets the 1% rule at list price ($2k rent vs $101k).
- Cap rate 15.8% vs local median 4.6% in Springfield — top-decile yield for the area; either an underpriced asset or a hidden risk that comps aren't pricing in. Stress-test before assuming the spread holds.
Location & tenants
- Location reads 75/100 on livability (#57 in MO, #4,121 nationally) — a middle-class / working-renter tenant base. Strengths: commute A+, cost of living A+, housing A+; Watch: crime F, employment F.
- Springfield R-XII (urban): math 32% / reading 46% proficiency, ranked #174 of 324 in MO (top 54%) — families likely to look elsewhere, expect single-tenant / working-renter base with shorter leases.
- Market conditions: Rents rising fast (+4.8%/yr); 513 active listings in the ZIP; 11 comparable units currently listed for rent nearby; rentals at typical pace (median 25d on market — plan ~3-4 weeks tenant-placement turnaround); 1,302 units permitted in Greene County in 2024 (250 in 5+ unit buildings).
- This rent runs 40% of the median local income ($55k/yr) — at the standard rent-burdened threshold; future hikes will face affordability resistance.
Forward outlook
- Local home prices are declining (-3.0%/yr); year-one equity from $698 of loan paydown is wiped out by about $3k of value loss. Plan a longer hold.
- Greene County population projected at +25% by 2050 — long-run rental-demand tailwind backs the buy-and-hold thesis.
- At projected returns (-3.0% appreciation + 4.8% rent growth), your $28k cash investment doubles in ~4 years — after that, you're playing with house money.
Negotiation context
- Only 6 days on market — expect competitive offers; lowballing is unlikely to land.
Risks & watch-outs
- Watch-outs: built in 1907 — expect roof / HVAC / electrical / plumbing capex.
- Climate carrying-cost: extreme-heat days projected 7→19/yr by 2055 (HVAC capex compounding) — expect insurance premiums to compound above CPI over the hold.
Questions for the listing agent
- Built in 1907 — when were the roof, HVAC, electrical panel, plumbing, and water heater last replaced?
- Is there a deadline driving the sale (1031 exchange, divorce, estate, relocation)? That informs how much negotiation room exists.
- Crime grade is F in this area — have there been break-ins, vandalism, or insurance claims at this property in the last 3 years? What carrier currently insures it and at what premium?
- What's the average days-on-market for RENTAL listings here right now (not sales)? A rising rental-DOM trend means longer vacancies and softer asking-rent achievability than the comps imply.
- What's the recent tenant-quality profile in this submarket — average credit score on applications, eviction rate, late-payment / NSF rate, and stable-employment percentage? A property-management company in the area should have these aggregated.
- How much new for-sale + rental construction is in the pipeline within 1–3 miles? Heavy new supply typically softens prices + rents 12–24 months out; constrained supply supports both.
Investment metrics
- 1% rule
- 1.81% ✓
- Cap rate
- 15.82%
- Cash-on-cash
- 34.04%
- DSCR
- 2.51
- GRM
- 4.6
CMA / ARV
- ARV (on-the-fly)
- $215,808
- Comps found
- 12
Show comp detail 12 sales within ~0.75 mi
| Address | Dist | Beds/Ba | Sqft | Sold | Price | $/sf | Match |
|---|---|---|---|---|---|---|---|
| 1328 N Benton Ave | 0.19mi | 4/1.5 | 2,314 (+3%) | 6mo | $219,000 | $95 | 81 |
| 1220 N Robberson Ave | 0.06mi | 5/2.0 (+1) | 2,084 (-7%) | 1mo | $145,000 | $70 | 77 |
| 525 E Calhoun St | 0.19mi | 4/2.5 | 2,403 (+7%) | 19mo | $319,900 | $133 | 60 |
| 730 W Scott St | 0.56mi | 3/1.5 (-1) | 2,436 (+8%) | 2mo | $155,000 | $64 | 54 |
| 827 W Webster St | 0.61mi | 3/2.0 (-1) | 2,280 (+1%) | 11mo | $179,900 | $79 | 53 |
| 508 W Division St | 0.47mi | 3/2.0 (-1) | 2,400 (+7%) | 9mo | $165,000 | $69 | 52 |
| 1441 N Summit Ave | 0.40mi | 4/1.5 | 2,056 (-8%) | 20mo | $199,000 | $97 | 50 |
| 632 W Nichols St | 0.46mi | 4/2.0 | 1,920 (-15%) | 6mo | $209,900 | $109 | 47 |
| 1400 N Summit Ave | 0.39mi | 4/3.0 | 2,090 (-7%) | 24mo | $245,000 | $117 | 44 |
| 901 W Nichols St | 0.67mi | 5/3.0 (+1) | 2,286 (+2%) | 14mo | $219,900 | $96 | 43 |
| 926 N Missouri Ave | 0.66mi | 4/2.0 | 1,936 (-14%) | 15mo | $179,900 | $93 | 32 |
| 804 W Calhoun St | 0.56mi | 4/2.5 | 1,916 (-15%) | 19mo | $195,000 | $102 | 29 |
Match score weights: distance 35% · size 25% · config 20% · recency 20%. Top-matched comps best support the ARV.
Projected returns pro-forma
-3.0% appreciation · 4.82% rent growth · sell at horizon
- IRR
- 31.4%
- Equity multiple
- 2.35×
- Total profit
- $38,124
- Equity at exit
- $15,059
- IRR
- 39.5%
- Equity multiple
- 5.01×
- Total profit
- $113,459
- Equity at exit
- $8,733
Cash invested: $28,280 (down + closing). Projections, not guarantees.
Landlord ↔ Tenant lean methodology
- Overall (STATE)
- 81 Strongly Landlord-Friendly
- State Missouri
- 81 Strongly Landlord-Friendly · R+10
- County
- — inherits STATE
- City
- — inherits STATE
ZIP-level market 65802
- Home prices YoY
- -31.9%
- Rents YoY
- 4.8%
- Active inventory
- 513
- Price-to-rent
- 4.6×
Monthly cashflow live
- Estimated rent
- $1,826 high interval (Pro) →
- Mortgage (P&I)
- −$530
- Tax from tax record
- −$69 /mo · $827/yr
- Insurance
- −$42
- HOA
- −$0
- Vacancy / Maint / Mgmt
- −$384
- Net cashflow
- $802
Break-even live
Sensitivity live
| Price | -10% $859 | -5% $831 | +0% $802 | +5% $774 | +10% $745 |
|---|---|---|---|---|---|
| Rent | -10% $658 | -5% $730 | +0% $802 | +5% $874 | +10% $946 |
| Rate | -1.0pp $853 | -0.5pp $828 | base $802 | +0.5pp $776 | +1.0pp $749 |
UW: 25.0% down · 7.5% · 30yr · 1.5% tax · 5.0% vac · 8.0% maint · 8.0% mgmt
Financing live
Cash to close
- Down payment
- $25,250
- Closing costs
- $3,030
- Reserves months
- —
- Total cash needed
- —
Loan-product check · same deal, 3 products live
Conventional
25% down · 7.5% · 30yr
- Down + closing
- —
- Monthly P&I
- —
- Monthly cashflow
- —
- DSCR
- —
- Eligible?
- —
Personal DTI + credit; lowest rate.
DSCR
20% down · 8.5% · 30yr
- Down + closing
- —
- Monthly P&I
- —
- Monthly cashflow
- —
- DSCR
- —
- Eligible?
- —
No personal income docs; deal must DSCR.
Hard money
10% down · 12.0% · 12mo
- Down + closing
- —
- Monthly P&I
- —
- Monthly cashflow
- —
- DSCR
- —
- Eligible?
- —
Short-term bridge; refi at stabilization.
Rent comps 11 comps
| Address | Beds | Baths | Sqft | Rent | $/sqft | DOM | Units | Dist |
|---|---|---|---|---|---|---|---|---|
| 501 W Central St Springfield, MO | 4.0 | 2.0 | 2000 | $2,200 | $1.10 | 24d | 1 | 0.34mi |
| 1439 N Texas Ave Springfield, MO | 4.0 | 2.0 | 1608 | $1,195 | $0.74 | 45d | 1 | 0.63mi |
| 1442 N Texas Ave Springfield, MO | 3.0 | 2.0 | 1626 | $1,400 | $0.86 | 45d | 1 | 0.66mi |
| 235 N Market Ave Springfield, MO | 1.0–4.0 | 1.0–2.0 | 1350 | $1,500 | $1.11 | 24d | 5 | 0.85mi |
| 235 N Market Ave Springfield, MO | 1.0–4.0 | 1.0–2.0 | 1350 | $1,500 | $1.11 | 15d | 4 | 0.85mi |
| 520 W Olive St Springfield, MO | 3.0 | 2.0 | 1445 | $1,538 | $1.06 | 15d | 5 | 0.85mi |
| 211 S Market Ave Springfield, MO | 2.0–4.0 | 1.0–2.0 | 1442 | $2,300 | $1.59 | 22d | 5 | 0.93mi |
| 211 S Market Ave Springfield, MO | 2.0–4.0 | 1.0–2.0 | 1442 | $2,300 | $1.59 | 24d | 5 | 0.93mi |
| 916 N Pickwick Ave Springfield, MO | 4.0 | 3.0 | 1827 | $1,700 | $0.93 | 15d | 1 | 1.18mi |
| 1112 E Walnut St Apt 2 Springfield, MO | 4.0 | 2.0 | 2240 | $2,450 | $1.09 | 45d | 1 | 1.21mi |
| 630 S Market Ave Springfield, MO | 3.0 | 2.0 | 1758 | $2,150 | $1.22 | 45d | 1 | 1.26mi |
Listing history 6 events
-
2026-06-18days on market $101,000 Active 6 DOM
-
2026-06-17days on market $101,000 Active 5 DOM
-
2026-06-16days on market $101,000 Active 4 DOM
-
2026-06-15days on market $101,000 Active 3 DOM
-
2026-06-14remarks 101-char remark
-
2026-06-14$101,000 Active 1 DOM
ⓘ Source: listings_history table (triggers on properties + properties_extension) + one-shot
backfill from property_details.listing_events for pre-trigger history.
Tax reassessment forecast MO · Resets to sale price
- Current annual tax
- $827 · $69/mo
- Projected year-2 tax
- $980 · $82/mo
- Expected delta
- +$153/yr (+$13/mo · 18.5%)
ⓘ Screening estimate from a state-policy table — verify with the county assessor before closing.
Climate risk First Street
- Flood 1/10 Low FEMA zone X (unshaded) · 0% chance over 30 yrs
- Wildfire 1/10 Low
- Heat 5/10 Major 7 d/yr ≥104°F today · 19 d/yr by 30 yrs out
- Wind 2/10 Low
- Air quality 2/10 Low 1 unhealthy d/yr today · 2 by 30 yrs out
Nearby sold comps map
Loading sold comps map…
Walkable amenities ~0.75 mi
Loading nearby amenities…
Taxation est. · year 1
- Rental income
- $21,916
- − Mortgage interest
- −$5,658
- − Property taxes
- −$827
- − Insurance
- −$505
- − Repairs & maintenance
- −$1,753
- − Management
- −$1,753
- − Depreciation
- −$2,938
- Taxable income
- $8,482
- Est. tax owed @ 24.0%
- −$2,036
- After-tax cash flow
- $7,591/yr
For passive investors: Depreciation is non-cash, so a rental often shows a tax loss while cash-flowing — sheltering income. Rental losses are passive: they offset passive income freely, and up to $25,000/yr can offset ordinary (W-2) income if you actively participate and your MAGI is under $100k (phasing out to $0 by $150k); unused losses carry forward. On sale, claimed depreciation is recaptured at up to 25%, and gains may owe capital-gains tax (a 1031 exchange can defer both). Figures are a year-1 estimate at your 24.0% rate — not tax advice; consult a CPA.
Schools (NCES district)
- District
- Springfield R-XII
- NCES district ID
- 2928860
- Math proficiency
- 32% ▼ -2.00%
- Reading proficiency
- 46% ▼ -3.00%
- Median HH income
- $37,886
- Composite
- 32.45/100
- National rank
- #5717
- State rank
- #174 of 324 in MO
Livability — Springfield
- Score
- 75/100
- State rank
- #57
- US rank
- #4121
Category grades
Schools grade is shown separately in the Schools card above.
Census & demographics
- Census place
- Springfield, MO
- County
- Greene County · 244,327 people
- City population
- 223,044
- Metro
- Springfield, MO
- Population (ZIP)
- 46,739
- Household income
- $55,019
- Rent vs Own
- Severe rent burden
- 1818.0
Population outlook (Greene County) Hauer SSP2
- Today (2025)
- 319,054 people
- By 2030
- 335,135 · +5.0%
- By 2040
- 366,186 · +14.8%
- By 2050
- 397,431 · +24.6%
- By 2075
- 477,035 · +49.5%
- By 2100
- 520,828 · +63.2%
Race, ethnicity, and origin ACS 2023
- Neighborhood character
- Predominantly White (81%)
- Race & ethnicity
- White 81% Two or more races 8% Hispanic / Latino 5% Black 4% Asian 2%
- Common ancestry
- Slovak 2% Lithuanian 2% Italian 2%
- Foreign-born
- 3% · Canada, Vietnam
- Languages at home
- 95% English-only · Spanish 2% Vietnamese 1% Other Indo-European 1%
Political lean MEDSL · Greene
- 2024 margin
- Strong R (+20.8) · D 38.9% · R 59.7% · Other 1.4%
- 2008→2024 swing
- -5.0pp toward R · 2008: -15.8pp · 2024: -20.8pp
- All cycles
- 2024: R+20.8 2020: R+20.1 2016: R+27.4 2012: R+24.4 2008: R+15.8
Not yet ingested
- Civics
- —
Market trends
- HPI YoY
- ▼ -99.72%
- Current HPI
- 212.9826
- Rent YoY
- ▲ 4.82%
- Metro
- Springfield, MO
- State GDP YoY
- ▲ 1.84%
- F500 in state
- 20
Industry mix (Fortune 500 HQ in MO)
| Industry | F500 HQs | Revenue |
|---|---|---|
| Healthcare | 1 | $163B |
|
||
| Insurance | 1 | $21B |
|
||
| Industrial Technology | 1 | $17B |
|
||
| Retail | 1 | $16B |
|
||
| Industrial Distribution | 1 | $10B |
|
||
| Utilities | 1 | $9B |
|
||
Price history
1 event — show timeline
- 2026-06-13 Listed $101,000 FSBO.com
Property tax history
+2.4%/yrLatest (2025): $827 · +4.6% YoY. Source: county tax records.
Cash-flow waterfall
monthlySold comps — $/sqft
last 12 mo · ≤1 miLoading sold comps…