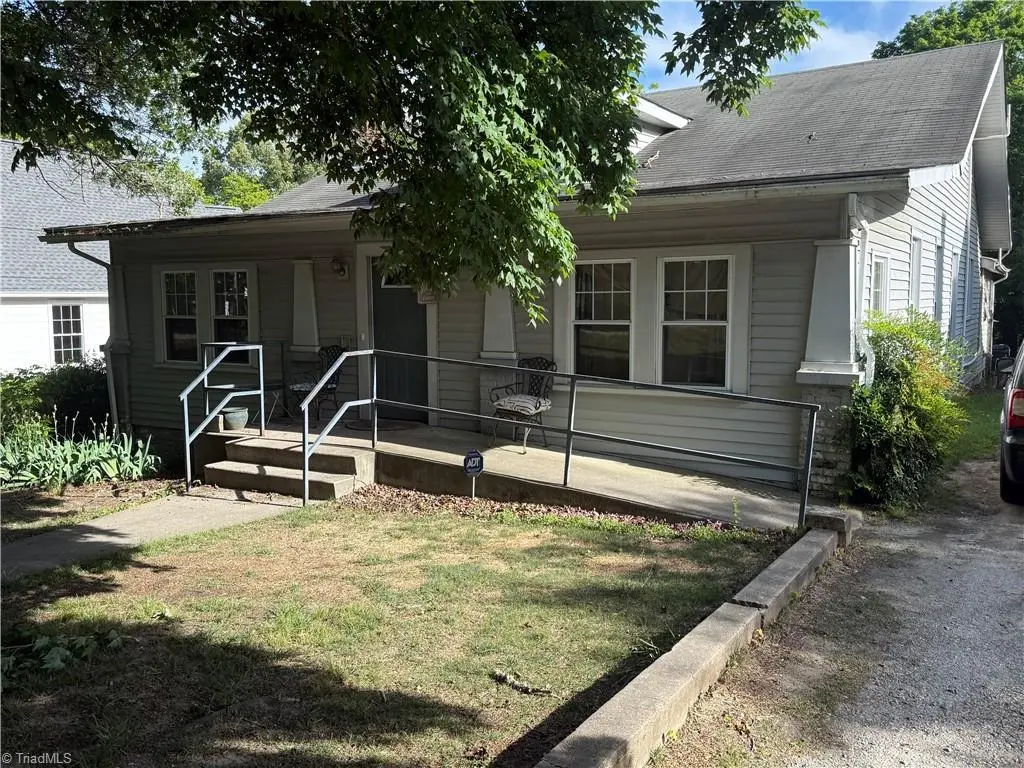
281 Main St · Yanceyville, NC
Flood risk 1/10 · Minimal
- FEMA flood zone
- X (unshaded)
- Chance of flooding over 30 yrs
- 0.0%
- Est. flood insurance / yr
- $507 – $1,088
Fire risk 2/10 · Minimal
- Est. fire insurance / yr
- $906 – $1,684
Heat risk 6/10 · Moderate
- Hot days now (above 108°F)
- 7 days/yr
- Hot days in 30 yrs
- 17 days/yr
Wind risk 4/10 · Minor
- Chance of severe wind over 30 yrs
- 12.0%
Air-quality risk 2/10 · Minimal
- Unhealthy air days now
- 1 days/yr
- Unhealthy air days in 30 yrs
- 2 days/yr
Risk factors via First Street. Map © Google.
Why this score? — see what drove the C grade
The composite is a weighted blend of 9 inputs, each scored 0–100. Each bar is that input's sub-score; the figure is the points it added to the 100-point composite (weight × sub-score).
- Cash flow +21.5/30.0
- Appreciation +7.9/10.0
- ARV discount +7.5/15.0
- DSCR +6.9/10.0
- 1% rule +4.9/10.0
- Livability +3.4/5.0
- Rent growth +2.5/5.0
- Schools +2.5/10.0
- Condition / age +2.5/5.0
$139,900
🖨 Deal sheet 📄 Offer letter ✓ Due diligence
Listing remarks MLS
This is a wonderful investment property boasting a bonus room that could be used as a 4th bedroom and a couple sitting rooms that could be utilized in other ways. This home has been rented for 13 years, and the renters would like to stay. They are currently paying $1000 a month. High ceilings and many rooms. This home is set up to accommodate the Handicap or elderly. Home is located in the heart of the city in Yanceyville Nc. This home is in walking distance of the courthouse and downtown Yanceyville Nc.
Key facts
- Bonus room
- Sitting rooms
- 0.56 acre lot
Tags
Property features AI
Finance
- HOA & community: No homeowners association
Exterior
- Parking: Driveway
- Utilities: Public sewer; Electric water heater
- Home design: Residential stick/site-built house; One story; Built in 1930
- Construction: Vinyl siding; Slab foundation
- Exterior features: Public-maintained road access; Public water source
Interior
- Bathrooms: Two full bathrooms
- Heating & cooling: Heat pump and electric heating; Central air conditioning; Electric water heater
- Interior features: Primary bedroom located on the main level; Seven total rooms
Neighborhood map
What this means for you Summary
Snapshot
- This is a 4-bed/2.0-bath single-family listed at $140k.
Deal economics
- At list price, monthly cash flow is $209 ($3k/yr) — positive.
- The deal already cash-flows at list — no discount required.
- To meet the 1% rule (rent ≥ 1% of price), the offer needs to be $138k (1.4% below list).
- Recommended offer: $136k (3.0% below list) — sets the bar for market timing.
- Cap rate 8.1% vs local median 3.6% in Yanceyville — top-decile yield for the area; either an underpriced asset or a hidden risk that comps aren't pricing in. Stress-test before assuming the spread holds.
Location & tenants
- Location reads 68/100 on livability (#179 in NC) — a middle-class / working-renter tenant base. Strengths: cost of living A+, health & safety A+, crime B+; Watch: schools F, amenities F, commute F.
- Caswell County Schools (rural): math 24% / reading 37% proficiency, ranked #146 of 178 in NC (top 82%) — families likely to look elsewhere, expect single-tenant / working-renter base with shorter leases; 61% free/reduced lunch — lower-income household profile, screen leases tightly.
- Market conditions: 24 active listings in the ZIP; 54 units permitted in Caswell County in 2024 (0 in 5+ unit buildings).
Forward outlook
- In year one you build about $9k of equity ($967 loan paydown + $8k appreciation (5.7% local appreciation)).
- Caswell County population projected at -27% by 2050 — secular population decline; favor cash flow + early exit over multi-decade hold.
- At projected returns (5.7% appreciation + 3.0% rent growth), your $39k cash investment doubles in ~4 years — after that, you're playing with house money.
- By year 4, paydown + projected appreciation supports a ~$31k cash-out refi (75% LTV) — recoverable capital for the next deal without selling this one.
Negotiation context
- It's been on market 39 days — a 3% lower offer ($136k) is reasonable based on typical stale-listing flexibility.
- 2 sale attempts; this cycle's ask has dropped $9k (6%) from the opening price — seller is motivated, your offer sets the floor, not the list.
Risks & watch-outs
- Watch-outs: built in 1930 — expect roof / HVAC / electrical / plumbing capex.
- Climate carrying-cost: extreme-heat days projected 7→17/yr by 2055 (HVAC capex compounding) — expect insurance premiums to compound above CPI over the hold.
Questions for the listing agent
- It's been on market 39 days. Have you received any prior offers? Is the seller open to a 3% concession, seller financing, or rate buy-down credit?
- Built in 1930 — when were the roof, HVAC, electrical panel, plumbing, and water heater last replaced?
- Is there a deadline driving the sale (1031 exchange, divorce, estate, relocation)? That informs how much negotiation room exists.
- Schools are F-rated, which usually means shorter tenancies and higher turnover. Who's the typical renter profile here, and what's been the actual vacancy rate?
- What's the average days-on-market for RENTAL listings here right now (not sales)? A rising rental-DOM trend means longer vacancies and softer asking-rent achievability than the comps imply.
- What's the recent tenant-quality profile in this submarket — average credit score on applications, eviction rate, late-payment / NSF rate, and stable-employment percentage? A property-management company in the area should have these aggregated.
- How much new for-sale + rental construction is in the pipeline within 1–3 miles? Heavy new supply typically softens prices + rents 12–24 months out; constrained supply supports both.
Investment metrics
- 1% rule
- 0.99% ✗
- Cap rate
- 8.09%
- Cash-on-cash
- 6.42%
- DSCR
- 1.29
- GRM
- 8.4
CMA / ARV
No comps found within radius.
Projected returns pro-forma
5.74% appreciation · 3.0% rent growth · sell at horizon
- IRR
- 20.0%
- Equity multiple
- 2.32×
- Total profit
- $51,548
- Equity at exit
- $85,656
- IRR
- 19.4%
- Equity multiple
- 4.62×
- Total profit
- $141,717
- Equity at exit
- $153,394
Cash invested: $39,172 (down + closing). Projections, not guarantees.
Landlord ↔ Tenant lean methodology
- Overall (STATE)
- 85 Strongly Landlord-Friendly
- State North Carolina
- 85 Strongly Landlord-Friendly · R+3
- County
- — inherits STATE
- City
- — inherits STATE
ZIP-level market 27379
- Home prices YoY
- 2.8%
- Active inventory
- 24
- Price-to-rent
- 8.4×
Monthly cashflow live
- Estimated rent
- $1,380 medium interval (Pro) →
- Mortgage (P&I)
- −$734
- Tax from tax record
- −$89 /mo · $1,066/yr
- Insurance
- −$58
- HOA
- −$0
- Vacancy / Maint / Mgmt
- −$290
- Net cashflow
- $209
Break-even live
UW: 25.0% down · 7.5% · 30yr · 1.5% tax · 5.0% vac · 8.0% maint · 8.0% mgmt
Financing live
Cash to close
- Down payment
- $34,975
- Closing costs
- $4,197
- Reserves months
- —
- Total cash needed
- —
Loan-product check · same deal, 3 products live
Conventional
25% down · 7.5% · 30yr
- Down + closing
- —
- Monthly P&I
- —
- Monthly cashflow
- —
- DSCR
- —
- Eligible?
- —
Personal DTI + credit; lowest rate.
DSCR
20% down · 8.5% · 30yr
- Down + closing
- —
- Monthly P&I
- —
- Monthly cashflow
- —
- DSCR
- —
- Eligible?
- —
No personal income docs; deal must DSCR.
Hard money
10% down · 12.0% · 12mo
- Down + closing
- —
- Monthly P&I
- —
- Monthly cashflow
- —
- DSCR
- —
- Eligible?
- —
Short-term bridge; refi at stabilization.
Listing history 19 events
-
2026-06-19days on market $139,900 Active 39 DOM
-
2026-06-18days on market $139,900 Active 38 DOM
-
2026-06-17days on market $139,900 Active 37 DOM
-
2026-06-16days on market $139,900 Active 36 DOM
-
2026-06-15price $139,900 Active 35 DOM
-
2026-06-15days on market $149,000 Active 35 DOM
-
2026-06-14days on market $149,000 Active 33 DOM
-
2026-06-13days on market $149,000 Active 32 DOM
-
2026-06-10days on market $149,000 Active 30 DOM
-
2026-06-09days on market $149,000 Active 29 DOM
-
2026-06-08days on market $149,000 Active 28 DOM
-
2026-06-07days on market $149,000 Active 27 DOM
-
2026-06-03days on market $149,000 Active 23 DOM
-
2026-06-02days on market $149,000 Active 22 DOM
-
2026-06-01days on market $149,000 Active 21 DOM
-
2026-05-31days on market $149,000 Active 20 DOM
-
2026-05-30days on market $149,000 Active 19 DOM
-
2026-05-11$149,000 Active 509-char remark
Show marketing remark (509 chars)
This is a wonderful investment property boasting a bonus room that could be used as a 4th bedroom and a couple sitting rooms that could be utilized in other ways. This home has been rented for 13 years, and the renters would like to stay. They are currently paying $1000 a month. High ceilings and many rooms. This home is set up to accommodate the Handicap or elderly. Home is located in the heart of the city in Yanceyville Nc. This home is in walking distance of the courthouse and downtown Yanceyville Nc.
-
2026-05-11$149,000 Active
Show marketing remark (509 chars)
This is a wonderful investment property boasting a bonus room that could be used as a 4th bedroom and a couple sitting rooms that could be utilized in other ways. This home has been rented for 13 years, and the renters would like to stay. They are currently paying $1000 a month. High ceilings and many rooms. This home is set up to accommodate the Handicap or elderly. Home is located in the heart of the city in Yanceyville Nc. This home is in walking distance of the courthouse and downtown Yanceyville Nc.
ⓘ Source: listings_history table (triggers on properties + properties_extension) + one-shot
backfill from property_details.listing_events for pre-trigger history.
Tax reassessment forecast NC · Resets to sale price
- Current annual tax
- $1,066 · $89/mo
- Projected year-2 tax
- $1,147 · $96/mo
- Expected delta
- +$81/yr (+$7/mo · 7.6%)
ⓘ Screening estimate from a state-policy table — verify with the county assessor before closing.
Climate risk First Street
- Flood 1/10 Low FEMA zone X (unshaded) · 0% chance over 30 yrs
- Wildfire 2/10 Low
- Heat 6/10 Major 7 d/yr ≥108°F today · 17 d/yr by 30 yrs out
- Wind 4/10 Moderate 12% chance of damaging wind over 30 yrs
- Air quality 2/10 Low 1 unhealthy d/yr today · 2 by 30 yrs out
Nearby sold comps map
Loading sold comps map…
Walkable amenities ~0.75 mi
Loading nearby amenities…
Taxation est. · year 1
- Rental income
- $16,561
- − Mortgage interest
- −$7,837
- − Property taxes
- −$1,066
- − Insurance
- −$700
- − Repairs & maintenance
- −$1,325
- − Management
- −$1,325
- − Depreciation
- −$4,070
- Taxable income
- $239
- Est. tax owed @ 24.0%
- −$57
- After-tax cash flow
- $2,456/yr
For passive investors: Depreciation is non-cash, so a rental often shows a tax loss while cash-flowing — sheltering income. Rental losses are passive: they offset passive income freely, and up to $25,000/yr can offset ordinary (W-2) income if you actively participate and your MAGI is under $100k (phasing out to $0 by $150k); unused losses carry forward. On sale, claimed depreciation is recaptured at up to 25%, and gains may owe capital-gains tax (a 1031 exchange can defer both). Figures are a year-1 estimate at your 24.0% rate — not tax advice; consult a CPA.
Schools (NCES district)
- District
- Caswell County Schools
- NCES district ID
- 3700660
- Math proficiency
- 24% ▼ -2.00%
- Reading proficiency
- 37% ▲ 3.00%
- Median HH income
- $38,172
- Composite
- 25.44/100
- National rank
- #7452
- State rank
- #146 of 178 in NC
Livability — Yanceyville
- Score
- 68/100
- State rank
- #179
- US rank
- #9189
Category grades
Schools grade is shown separately in the Schools card above.
Census & demographics
- Census place
- Yanceyville, NC
- Population (ZIP)
- 4,143
Population outlook (Caswell County) Hauer SSP2
- Today (2025)
- 21,389 people
- By 2030
- 20,297 · -5.1%
- By 2040
- 17,848 · -16.6%
- By 2050
- 15,578 · -27.2%
- By 2075
- 11,939 · -44.2%
- By 2100
- 8,930 · -58.2%
Race, ethnicity, and origin ACS 2023
- Neighborhood character
- Majority White (54%)
- Race & ethnicity
- White 54% Black 41% Two or more races 4% Hispanic / Latino 2%
- Common ancestry
- Romanian 4% Italian 3% Subsaharan African 3%
- Foreign-born
- 4% · Canada
- Languages at home
- 96% English-only · Russian/Polish/Slavic 2% Spanish 2%
Political lean MEDSL · Caswell
- 2024 margin
- Strong R (+24.6) · D 37.4% · R 61.9%
- 2008→2024 swing
- -27.7pp toward R · 2008: 3.1pp · 2024: -24.6pp
- All cycles
- 2024: R+24.6 2020: R+18.5 2016: R+11.5 2012: R+2.7 2008: D+3.1
Not yet ingested
- Civics
- —
Market trends
- HPI YoY
- ▲ 5.74%
- Current HPI
- 210.5496
- Rent YoY
- —
- Metro
- —
- State GDP YoY
- ▲ 3.28%
- F500 in state
- 26
Industry mix (Fortune 500 HQ in NC)
| Industry | F500 HQs | Revenue |
|---|---|---|
| Financial Services | 2 | $213B |
|
||
| Retail | 2 | $95B |
|
||
| Industrial Conglomerate | 1 | $38B |
|
||
| Metals / Steel | 1 | $35B |
|
||
| Utilities | 1 | $30B |
|
||
| Industrial Machinery | 1 | $19B |
|
||
Price history
+0.0% since first listed2 events — show timeline
- 2026-05-11 Listed $149,000 DRRAR
- 2026-05-11 Listed $149,000 Triad MLS
Property tax history
+6.7%/yrLatest (2025): $1,066 · +10.3% YoY. Source: county tax records.
Cash-flow waterfall
monthlySold comps — $/sqft
last 12 mo · ≤1 miLoading sold comps…