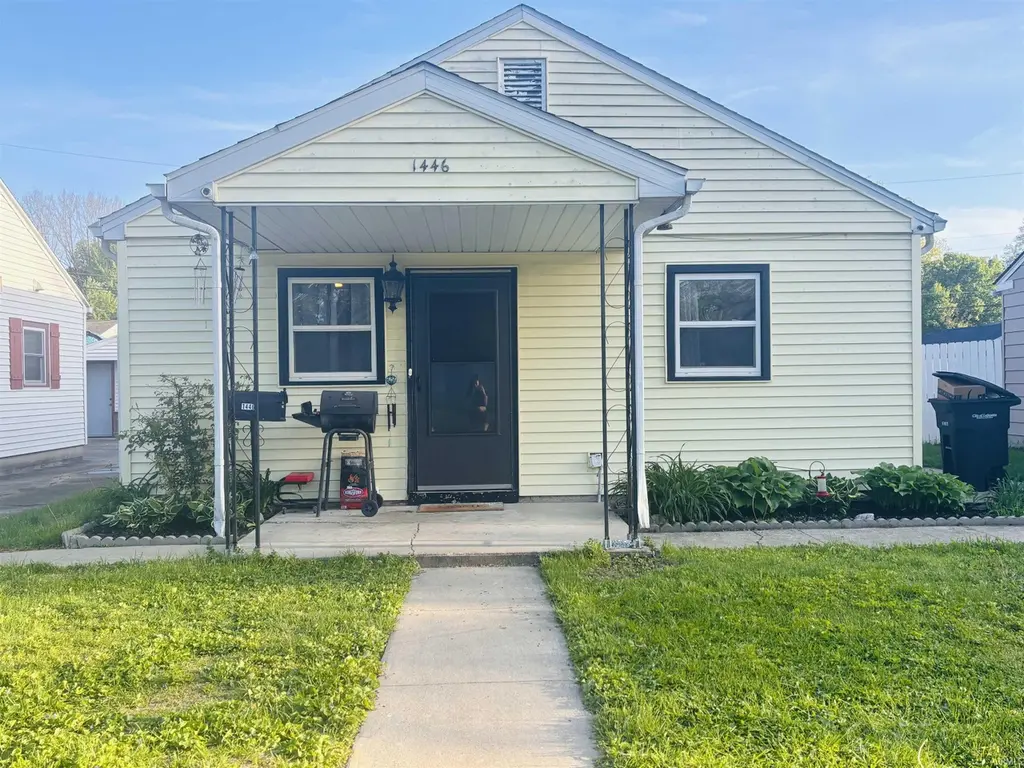
1446 Oak Ct · Lafayette, IN
Flood risk 1/10 · Minimal
- FEMA flood zone
- X (unshaded)
- Chance of flooding over 30 yrs
- 0.0%
- Est. flood insurance / yr
- $507 – $1,088
Fire risk 1/10 · Minimal
- Est. fire insurance / yr
- $717 – $1,331
Heat risk 3/10 · Minor
- Hot days now (above 102°F)
- 7 days/yr
- Hot days in 30 yrs
- 18 days/yr
Wind risk 2/10 · Minimal
- Chance of severe wind over 30 yrs
- —
Air-quality risk 2/10 · Minimal
- Unhealthy air days now
- 1 days/yr
- Unhealthy air days in 30 yrs
- 2 days/yr
Risk factors via First Street. Map © Google.
Why this score? — see what drove the B grade
The composite is a weighted blend of 9 inputs, each scored 0–100. Each bar is that input's sub-score; the figure is the points it added to the 100-point composite (weight × sub-score).
- Cash flow +30.0/30.0
- 1% rule +10.0/10.0
- DSCR +10.0/10.0
- ARV discount +7.5/15.0
- Rent growth +3.8/5.0
- Livability +3.7/5.0
- Schools +2.6/10.0
- Condition / age +2.5/5.0
- Appreciation +0.0/10.0
$75,000
🖨 Deal sheet 📄 Offer letter ✓ Due diligence
Listing remarks
Opportunity knocks with this affordable fixer-upper, perfect for a first-time homebuyer or savvy investor looking to build equity. This smaller home offers a functional layout with solid bones and plenty of potential to update and customize to your liking. With a little vision and TLC, this property could be transformed into a charming primary residence or a strong rental addition to your portfolio.
Key facts
- 4,320 sq ft lot
- Built 1950
Neighborhood map
What this means for you Summary
Snapshot
- This is a 3-bed/1.0-bath single-family listed at $75k.
Deal economics
- At list price, monthly cash flow is $438 ($5k/yr) — positive.
- The deal already cash-flows at list — no discount required.
- Meets the 1% rule at list price ($1k rent vs $75k).
- Cap rate 13.3% vs local median 4.2% in Lafayette — top-decile yield for the area; either an underpriced asset or a hidden risk that comps aren't pricing in. Stress-test before assuming the spread holds.
Location & tenants
- Location reads 74/100 on livability (#68 in IN, #4,374 nationally) — a middle-class / working-renter tenant base. Strengths: cost of living A+, housing A+, health & safety A+; Watch: amenities D+, employment D+, crime F.
- Lafayette School Corporation (urban): math 29% / reading 34% proficiency, ranked #235 of 301 in IN (top 78%) — families likely to look elsewhere, expect single-tenant / working-renter base with shorter leases; 63% free/reduced lunch — lower-income household profile, screen leases tightly.
- Zoned schools: Oakland Elementary School (math 52% / reading 47%, grade D, #279 of 994 statewide, top 30%, 223 students, 73% FRL); Jefferson High School (math 23% / reading 55%, grade F, #235 of 369 statewide, top 65%, 2,118 students, 69% FRL).
- Zoned-school proficiency averages 44% at this address vs 32% district-wide (+13 pts) — the actual schools serving this property are materially stronger than the Lafayette School Corporation average implies; a family-tenant draw the district grade alone would hide.
- Market conditions: Rents rising fast (+5.1%/yr); 219 active listings in the ZIP; 24 comparable units currently listed for rent nearby; rentals leasing fast (median 13d on market — plan ~1-2 weeks tenant-placement turnaround); 1,341 units permitted in Tippecanoe County in 2024 (869 in 5+ unit buildings).
Forward outlook
- Local home prices are declining (-3.0%/yr); year-one equity from $519 of loan paydown is wiped out by about $2k of value loss. Plan a longer hold.
- Tippecanoe County population projected at +41% by 2050 — long-run rental-demand tailwind backs the buy-and-hold thesis.
- At projected returns (-3.0% appreciation + 5.1% rent growth), your $21k cash investment doubles in ~5 years — after that, you're playing with house money.
Negotiation context
- Only 0 days on market — expect competitive offers; lowballing is unlikely to land.
Risks & watch-outs
- Watch-outs: built in 1950 — expect roof / HVAC / electrical / plumbing capex.
Questions for the listing agent
- Built in 1950 — when were the roof, HVAC, electrical panel, plumbing, and water heater last replaced?
- Is there a deadline driving the sale (1031 exchange, divorce, estate, relocation)? That informs how much negotiation room exists.
- Schools are D-rated, which usually means shorter tenancies and higher turnover. Who's the typical renter profile here, and what's been the actual vacancy rate?
- Crime grade is F in this area — have there been break-ins, vandalism, or insurance claims at this property in the last 3 years? What carrier currently insures it and at what premium?
- What's the average days-on-market for RENTAL listings here right now (not sales)? A rising rental-DOM trend means longer vacancies and softer asking-rent achievability than the comps imply.
- What's the recent tenant-quality profile in this submarket — average credit score on applications, eviction rate, late-payment / NSF rate, and stable-employment percentage? A property-management company in the area should have these aggregated.
- How much new for-sale + rental construction is in the pipeline within 1–3 miles? Heavy new supply typically softens prices + rents 12–24 months out; constrained supply supports both.
Investment metrics
- 1% rule
- 1.71% ✓
- Cap rate
- 13.30%
- Cash-on-cash
- 25.03%
- DSCR
- 2.11
- GRM
- 4.9
CMA / ARV
- ARV (on-the-fly)
- $196,416
- Comps found
- 12
Show comp detail 12 sales within ~0.75 mi
| Address | Dist | Beds/Ba | Sqft | Sold | Price | $/sf | Match |
|---|---|---|---|---|---|---|---|
| 2060 Crestview Ct | 0.29mi | 3/1.0 | 1,056 (+6%) | 7mo | $209,000 | $198 | 70 |
| 819 S 19th St | 0.64mi | 3/1.0 | 988 (-0%) | 1mo | $110,000 | $111 | 68 |
| 1017 Winthrop Ave | 0.46mi | 3/1.0 | 1,058 (+7%) | 2mo | $200,000 | $189 | 65 |
| 1005 Sarasota Dr | 0.54mi | 3/1.0 | 960 (-3%) | 6mo | $180,000 | $188 | 64 |
| 1212 Logan Ave | 0.22mi | 2/1.5 (-1) | 864 (-13%) | 0mo | $210,000 | $243 | 61 |
| 1035 Davis Dr | 0.65mi | 3/1.5 | 960 (-3%) | 2mo | $205,000 | $214 | 61 |
| 826 S 18th St | 0.59mi | 3/1.0 | 1,064 (+7%) | 0mo | $150,000 | $141 | 60 |
| 2516 Oxford St | 0.60mi | 3/1.0 | 1,061 (+7%) | 6mo | $145,000 | $137 | 55 |
| 2501 Crestview Ct | 0.58mi | 3/1.0 | 912 (-8%) | 6mo | $199,999 | $219 | 54 |
| 2508 Oxford St | 0.58mi | 4/2.0 (+1) | 1,024 (+3%) | 6mo | $190,000 | $186 | 53 |
| 2508 Edgelea Dr | 0.59mi | 3/1.0 | 864 (-13%) | 0mo | $206,000 | $238 | 51 |
| 1309 S 23rd St | 0.62mi | 3/1.0 | 850 (-14%) | 6mo | $170,000 | $200 | 42 |
Match score weights: distance 35% · size 25% · config 20% · recency 20%. Top-matched comps best support the ARV.
Projected returns pro-forma
-3.0% appreciation · 5.12% rent growth · sell at horizon
- IRR
- 21.1%
- Equity multiple
- 1.89×
- Total profit
- $18,600
- Equity at exit
- $11,183
- IRR
- 30.7%
- Equity multiple
- 4.06×
- Total profit
- $64,345
- Equity at exit
- $6,485
Cash invested: $21,000 (down + closing). Projections, not guarantees.
Landlord ↔ Tenant lean methodology
- Overall (STATE)
- 90 Strongly Landlord-Friendly
- State Indiana
- 90 Strongly Landlord-Friendly · R+11
- County
- — inherits STATE
- City
- — inherits STATE
ZIP-level market 47905
- Home prices YoY
- -33.2%
- Rents YoY
- 5.1%
- Active inventory
- 219
- Price-to-rent
- 4.9×
Monthly cashflow live
- Estimated rent
- $1,286 high interval (Pro) →
- Mortgage (P&I)
- −$393
- Tax from tax record
- −$153 /mo · $1,837/yr
- Insurance
- −$31
- HOA
- −$0
- Vacancy / Maint / Mgmt
- −$270
- Net cashflow
- $438
Break-even live
UW: 25.0% down · 7.5% · 30yr · 1.5% tax · 5.0% vac · 8.0% maint · 8.0% mgmt
Financing live
Cash to close
- Down payment
- $18,750
- Closing costs
- $2,250
- Reserves months
- —
- Total cash needed
- —
Loan-product check · same deal, 3 products live
Conventional
25% down · 7.5% · 30yr
- Down + closing
- —
- Monthly P&I
- —
- Monthly cashflow
- —
- DSCR
- —
- Eligible?
- —
Personal DTI + credit; lowest rate.
DSCR
20% down · 8.5% · 30yr
- Down + closing
- —
- Monthly P&I
- —
- Monthly cashflow
- —
- DSCR
- —
- Eligible?
- —
No personal income docs; deal must DSCR.
Hard money
10% down · 12.0% · 12mo
- Down + closing
- —
- Monthly P&I
- —
- Monthly cashflow
- —
- DSCR
- —
- Eligible?
- —
Short-term bridge; refi at stabilization.
Rent comps 24 comps
| Address | Beds | Baths | Sqft | Rent | $/sqft | DOM | Units | Dist |
|---|---|---|---|---|---|---|---|---|
| 2433 Oxford St Lafayette, IN | 2.0 | 1.0 | 672 | $1,025 | $1.53 | 43d | 1 | 0.50mi |
| 2411 S 18th St Unit 2415 Lafayette, IN | 3.0 | 1.0 | 1000 | $1,160 | $1.16 | 13d | 1 | 0.54mi |
| 2107 Central St Lafayette, IN | 2.0 | 1.0 | 816 | $1,179 | $1.44 | 43d | 1 | 0.62mi |
| 2450 S Earl Ave Lafayette, IN | 1.0–2.0 | 1.0 | 755 | $1,214 | $1.61 | 13d | 3 | 0.67mi |
| 612 S 10th St Unit 612 Lafayette, IN | 2.0 | 1.0 | 1028 | $1,035 | $1.01 | 13d | 1 | 0.77mi |
| 2760 Medford St Lafayette, IN | 3.0 | 1.0 | 938 | $1,400 | $1.49 | 13d | 1 | 0.79mi |
| 901 S 4th St Lafayette, IN | 1.0–2.0 | 1.0 | 739 | $1,033 | $1.40 | 13d | 3 | 0.80mi |
| 409 S 15th St Lafayette, IN | 2.0 | 2.0 | 864 | $1,200 | $1.39 | 43d | 1 | 0.91mi |
| 1033 Holloway St Lafayette, IN | 2.0 | 1.0 | 780 | $1,150 | $1.47 | 13d | 1 | 0.96mi |
| 1102 Holloway St Apt 2 Lafayette, IN | 2.0 | 1.0 | 747 | $995 | $1.33 | 43d | 1 | 0.99mi |
| 549 S 3rd St Lafayette, IN | 2.0 | 1.0 | 1000 | $1,100 | $1.10 | 43d | 1 | 1.03mi |
| 1739 Main St Unit 7 Lafayette, IN | 3.0 | 1.0 | 750 | $1,300 | $1.73 | 13d | 1 | 1.08mi |
| 1739 Main St Unit 5 Lafayette, IN | 3.0 | 1.0 | 850 | $1,200 | $1.41 | 43d | 1 | 1.08mi |
| 205 S 6th St Lafayette, IN | 2.0 | 1.0 | 1123 | $1,200 | $1.07 | 21d | 1 | 1.17mi |
| 216 S 5th St Apt 2 Lafayette, IN | 2.0 | 1.0 | 550 | $829 | $1.51 | 13d | 1 | 1.19mi |
| 2026 Scott St Lafayette, IN | 2.0 | 2.0 | 1025 | $1,450 | $1.41 | 43d | 1 | 1.23mi |
| 1422 Main St Unit 05 Lafayette, IN | 2.0 | 1.0 | 780 | $875 | $1.12 | 21d | 1 | 1.29mi |
| 475 South St Lafayette, IN | 1.0–2.0 | 1.0–2.0 | 870 | $2,100 | $2.41 | 13d | 12 | 1.31mi |
| 6 S 4th St Lafayette, IN | 1.0–3.0 | 1.0–3.0 | 1102 | $1,649 | $1.50 | 13d | 1 | 1.35mi |
| 335 S 31st St Lafayette, IN | 2.0 | 1.0 | 840 | $1,250 | $1.49 | 13d | 1 | 1.38mi |
| 3200 Quarry Dr Lafayette, IN | 1.0–2.0 | 1.0 | 742 | $1,305 | $1.76 | 13d | 4 | 1.39mi |
| 3224 S 9th St Lafayette, IN | 1.0–3.0 | 1.0–2.0 | 825 | $1,520 | $1.84 | 13d | 18 | 1.39mi |
| 117 N 5th St Lafayette, IN | 2.0 | 1.0–1.5 | 1123 | $1,632 | $1.45 | 21d | 4 | 1.41mi |
| 721 North St Apt 2 Lafayette, IN | 2.0 | 1.0 | 1036 | $900 | $0.87 | 43d | 1 | 1.48mi |
Tax reassessment forecast IN · Partial reset (capped growth)
- Current annual tax
- $1,837 · $153/mo
- Projected year-2 tax
- $1,837 · $153/mo
- Expected delta
- $0/yr ($0/mo · 0.0%)
ⓘ Screening estimate from a state-policy table — verify with the county assessor before closing.
Climate risk First Street
- Flood 1/10 Low FEMA zone X (unshaded) · 0% chance over 30 yrs
- Wildfire 1/10 Low
- Heat 3/10 Moderate 7 d/yr ≥102°F today · 18 d/yr by 30 yrs out
- Wind 2/10 Low
- Air quality 2/10 Low 1 unhealthy d/yr today · 2 by 30 yrs out
Nearby sold comps map
Loading sold comps map…
Walkable amenities ~0.75 mi
Loading nearby amenities…
Taxation est. · year 1
- Rental income
- $15,428
- − Mortgage interest
- −$4,201
- − Property taxes
- −$1,837
- − Insurance
- −$375
- − Repairs & maintenance
- −$1,234
- − Management
- −$1,234
- − Depreciation
- −$2,182
- Taxable income
- $4,364
- Est. tax owed @ 24.0%
- −$1,047
- After-tax cash flow
- $4,209/yr
For passive investors: Depreciation is non-cash, so a rental often shows a tax loss while cash-flowing — sheltering income. Rental losses are passive: they offset passive income freely, and up to $25,000/yr can offset ordinary (W-2) income if you actively participate and your MAGI is under $100k (phasing out to $0 by $150k); unused losses carry forward. On sale, claimed depreciation is recaptured at up to 25%, and gains may owe capital-gains tax (a 1031 exchange can defer both). Figures are a year-1 estimate at your 24.0% rate — not tax advice; consult a CPA.
Schools (NCES district)
- District
- Lafayette School Corporation
- NCES district ID
- 1805400
- Math proficiency
- 29% ▼ -9.00%
- Reading proficiency
- 34% ▼ -7.00%
- Median HH income
- $39,817
- Composite
- 26.46/100
- National rank
- #7217
- State rank
- #235 of 301 in IN
Livability — Lafayette
- Score
- 74/100
- State rank
- #68
- US rank
- #4374
Category grades
Schools grade is shown separately in the Schools card above.
Census & demographics
- Census place
- Lafayette, IN
- County
- Tippecanoe County · 181,820 people
- City population
- 106,622
- Metro
- Lafayette-West Lafayette, IN
- Population (ZIP)
- 42,219
- Household income
- $65,861
- Rent vs Own
- Severe rent burden
- 1475.0
Population outlook (Tippecanoe County) Hauer SSP2
- Today (2025)
- 215,327 people
- By 2030
- 232,284 · +7.9%
- By 2040
- 266,517 · +23.8%
- By 2050
- 302,826 · +40.6%
- By 2075
- 394,445 · +83.2%
- By 2100
- 463,500 · +115.3%
Race, ethnicity, and origin ACS 2023
- Neighborhood character
- Predominantly White (74%)
- Race & ethnicity
- White 74% Hispanic / Latino 12% Two or more races 8% Black 7% Asian 4%
- Hispanic origin (detail)
- Mexican 10%
- Common ancestry
- Romanian 3% Italian 2% Slovak 2%
- Foreign-born
- 10% · Canada, China, Vietnam
- Languages at home
- 91% English-only · Spanish 6% Other Asian/Pacific 1% Vietnamese 1%
Political lean MEDSL · Tippecanoe
- 2024 margin
- Toss-up / Even · D 49.0% · R 49.1% · Other 1.9%
- 2008→2024 swing
- -11.8pp toward R · 2008: 11.6pp · 2024: -0.1pp
- All cycles
- 2024: R+0.1 2020: D+0.6 2016: R+5.7 2012: R+3.6 2008: D+11.6
Not yet ingested
- Civics
- —
Market trends
- HPI YoY
- ▼ -113.05%
- Current HPI
- 227.1583
- Rent YoY
- ▲ 5.12%
- Metro
- Lafayette-West Lafayette, IN
- State GDP YoY
- ▲ 2.90%
- F500 in state
- 18
Industry mix (Fortune 500 HQ in IN)
| Industry | F500 HQs | Revenue |
|---|---|---|
| Industrial Machinery | 2 | $37B |
|
||
| Healthcare | 1 | $177B |
|
||
| Pharmaceuticals | 1 | $45B |
|
||
| Metals / Steel | 1 | $18B |
|
||
| Agriculture | 1 | $17B |
|
||
| Packaging | 1 | $12B |
|
||
Property tax history
+3.0%/yrLatest (2024): $1,837 · +4.7% YoY. Source: county tax records.
Cash-flow waterfall
monthlySold comps — $/sqft
last 12 mo · ≤1 miLoading sold comps…