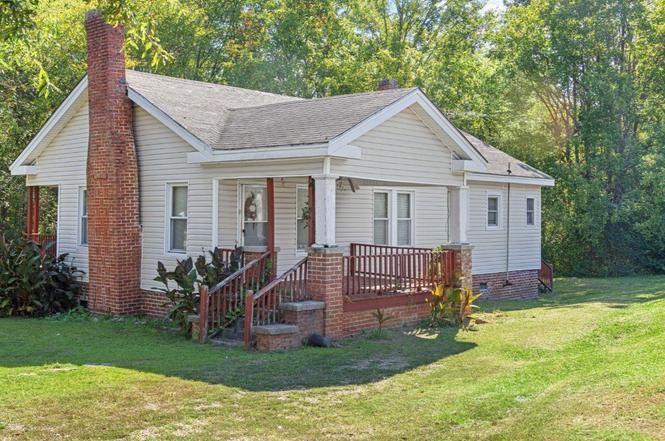
4605 King Kennedy St · Carlisle, SC
Flood risk 1/10 · Minimal
- FEMA flood zone
- X (unshaded)
- Chance of flooding over 30 yrs
- 0.0%
- Est. flood insurance / yr
- $507 – $1,088
Fire risk 4/10 · Minor
- Est. fire insurance / yr
- $783 – $1,453
Heat risk 6/10 · Moderate
- Hot days now (above 107°F)
- 7 days/yr
- Hot days in 30 yrs
- 16 days/yr
Wind risk 5/10 · Moderate
- Chance of severe wind over 30 yrs
- 24.0%
Air-quality risk 2/10 · Minimal
- Unhealthy air days now
- 1 days/yr
- Unhealthy air days in 30 yrs
- 1 days/yr
Risk factors via First Street. Map © Google.
Why this score? — see what drove the B- grade
The composite is a weighted blend of 9 inputs, each scored 0–100. Each bar is that input's sub-score; the figure is the points it added to the 100-point composite (weight × sub-score).
- Cash flow +30.0/30.0
- 1% rule +10.0/10.0
- DSCR +10.0/10.0
- ARV discount +7.5/15.0
- Livability +2.7/5.0
- Condition / age +2.5/5.0
- Schools +2.3/10.0
- Rent growth +1.8/5.0
- Appreciation +0.0/10.0
$75,000
🖨 Deal sheet 📄 Offer letter ✓ Due diligence
Listing remarks
Discover the potential in this 2-bedroom, 1 bathroom fixer upper located at 4605 King Kennedy St in Carlisle. Sitting on a spacious 0.58-acre lot, this property offers plenty of room to transform the home into something truly special. Whether you're an investor, a first-time buyer looking to build equity, or someone searching for a project, this home provides a solid foundation to work with. Bring your vision and creativity with updates and improvements, this could become a charming residence or a good income-producing rental. This home is being sold AS-IS.
Key facts
- Solid foundation
- Spacious lot
- 0.58 acre lot
Tags
Property features AI
Finance
- Other: Property sits on approximately 0.58 acre
- HOA & community: No community features listed
Exterior
- Parking: No on-site parking
- Utilities: Well water; Cable available
- Home design: Single-family residence; One story; Residential property
- Construction: Brick veneer and vinyl siding; Above-grade finished area: 954
- Exterior features: Porch; Storm door(s); Corner, wooded lot
Interior
- Bedrooms: 2 main-level bedrooms
- Flooring: Hardwood floors
- Bathrooms: 1 full bathroom
- Heating & cooling: Central air conditioning; Heating: see remarks
- Interior features: Walk-in closet(s); Fireplace (1)
- Laundry & utility: Laundry closet with washer and gas dryer hookups on the main level
Neighborhood map
What this means for you Summary
Snapshot
- This is a 2-bed/1.0-bath other listed at $75k.
Deal economics
- At list price, monthly cash flow is $514 ($6k/yr) — positive.
- The deal already cash-flows at list — no discount required.
- Meets the 1% rule at list price ($1k rent vs $75k).
- Recommended offer: $66k (12.0% below list) — sets the bar for market timing.
Location & tenants
- Location reads 54/100 on livability (#325 in SC) — a working-class tenant base; expect higher turnover. Strengths: cost of living A+, housing A+; Watch: crime F, amenities F, commute F.
- Union 01 (town): math 23% / reading 33% proficiency, ranked #60 of 80 in SC (top 75%) — low school quality limits family demand, transient renter base, plan for 1-2y turnover; 64% free/reduced lunch — lower-income household profile, screen leases tightly.
- Zoned schools: Monarch Elementary (math 37% / reading 34%, grade F, #335 of 597 statewide, top 57%, 497 students, 100% FRL); Sims Middle (math 14% / reading 25%, grade F, #182 of 229 statewide, top 80%, 672 students, 100% FRL) — zoned schools average 100% FRL vs 64% district-wide (36 pts higher); higher-poverty schools than district average — tighter screening recommended.
- Market conditions: Rents soft (-2.6%/yr); 466 active listings in the ZIP; 57 units permitted in Union County in 2024 (0 in 5+ unit buildings).
Forward outlook
- Local home prices are declining (-3.0%/yr); year-one equity from $519 of loan paydown is wiped out by about $2k of value loss. Plan a longer hold.
- Union County population projected at -28% by 2050 — secular population decline; favor cash flow + early exit over multi-decade hold.
- At projected returns (-3.0% appreciation + 0.0% rent growth), your $21k cash investment doubles in ~5 years — after that, you're playing with house money.
Negotiation context
- It's been on market 183 days — a 12% lower offer ($66k) is reasonable based on typical stale-listing flexibility.
- 4 sale attempts since 4y ago; this cycle's ask has dropped $45k (38%) from the opening price — seller is motivated, your offer sets the floor, not the list.
Risks & watch-outs
- Climate carrying-cost: moderate wind risk, 24% chance of damaging wind over 30y; extreme-heat days projected 7→16/yr by 2055 (HVAC capex compounding) — expect insurance premiums to compound above CPI over the hold.
Questions for the listing agent
- It's been on market 183 days. Have you received any prior offers? Is the seller open to a 12% concession, seller financing, or rate buy-down credit?
- Built in 1966 — when were the roof, HVAC, electrical panel, plumbing, and water heater last replaced?
- Why hasn't it sold? Are there any deal-killer items the seller is aware of (foundation, flood, title, zoning, code violations)?
- Is there a deadline driving the sale (1031 exchange, divorce, estate, relocation)? That informs how much negotiation room exists.
- Schools are F-rated, which usually means shorter tenancies and higher turnover. Who's the typical renter profile here, and what's been the actual vacancy rate?
- Crime grade is F in this area — have there been break-ins, vandalism, or insurance claims at this property in the last 3 years? What carrier currently insures it and at what premium?
- What's the average days-on-market for RENTAL listings here right now (not sales)? A rising rental-DOM trend means longer vacancies and softer asking-rent achievability than the comps imply.
- What's the recent tenant-quality profile in this submarket — average credit score on applications, eviction rate, late-payment / NSF rate, and stable-employment percentage? A property-management company in the area should have these aggregated.
- How much new for-sale + rental construction is in the pipeline within 1–3 miles? Heavy new supply typically softens prices + rents 12–24 months out; constrained supply supports both.
Investment metrics
- 1% rule
- 1.66% ✓
- Cap rate
- 14.51%
- Cash-on-cash
- 29.35%
- DSCR
- 2.31
- GRM
- 5.0
CMA / ARV
No comps found within radius.
Projected returns pro-forma
-3.0% appreciation · 0.0% rent growth · sell at horizon
- IRR
- 20.5%
- Equity multiple
- 1.80×
- Total profit
- $16,903
- Equity at exit
- $11,183
- IRR
- 26.7%
- Equity multiple
- 3.03×
- Total profit
- $42,707
- Equity at exit
- $6,485
Cash invested: $21,000 (down + closing). Projections, not guarantees.
Landlord ↔ Tenant lean methodology
- Overall (STATE)
- 90 Strongly Landlord-Friendly
- State South Carolina
- 90 Strongly Landlord-Friendly · R+6
- County
- — inherits STATE
- City
- — inherits STATE
ZIP-level market 29301
- Home prices YoY
- -25.3%
- Rents YoY
- -2.6%
- Active inventory
- 466
- Price-to-rent
- 5.0×
Monthly cashflow live
- Estimated rent
- $1,244 medium interval (Pro) →
- Mortgage (P&I)
- −$393
- Tax from tax record
- −$45 /mo · $536/yr
- Insurance
- −$31
- HOA
- −$0
- Vacancy / Maint / Mgmt
- −$261
- Net cashflow
- $514
Break-even live
UW: 25.0% down · 7.5% · 30yr · 1.5% tax · 5.0% vac · 8.0% maint · 8.0% mgmt
Financing live
Cash to close
- Down payment
- $18,750
- Closing costs
- $2,250
- Reserves months
- —
- Total cash needed
- —
Loan-product check · same deal, 3 products live
Conventional
25% down · 7.5% · 30yr
- Down + closing
- —
- Monthly P&I
- —
- Monthly cashflow
- —
- DSCR
- —
- Eligible?
- —
Personal DTI + credit; lowest rate.
DSCR
20% down · 8.5% · 30yr
- Down + closing
- —
- Monthly P&I
- —
- Monthly cashflow
- —
- DSCR
- —
- Eligible?
- —
No personal income docs; deal must DSCR.
Hard money
10% down · 12.0% · 12mo
- Down + closing
- —
- Monthly P&I
- —
- Monthly cashflow
- —
- DSCR
- —
- Eligible?
- —
Short-term bridge; refi at stabilization.
Listing history 27 events
-
2026-06-19days on market $75,000 Active 183 DOM
-
2026-06-18days on market $75,000 Active 182 DOM
-
2026-06-17days on market $75,000 Active 181 DOM
-
2026-06-16days on market $75,000 Active 180 DOM
-
2026-06-15days on market $75,000 Active 179 DOM
-
2026-06-14days on market $75,000 Active 177 DOM
-
2026-06-12days on market $75,000 Active 176 DOM
-
2026-06-09days on market $75,000 Active 173 DOM
-
2026-06-08days on market $75,000 Active 172 DOM
-
2026-06-07days on market $75,000 Active 171 DOM
-
2026-06-05days on market $75,000 Active 168 DOM
-
2026-06-03days on market $75,000 Active 167 DOM
-
2026-06-02days on market $75,000 Active 166 DOM
-
2026-06-01days on market $75,000 Active 165 DOM
-
2026-05-31days on market $75,000 Active 164 DOM
-
2026-05-30days on market $75,000 Active 163 DOM
-
2026-02-25price $75,000
-
2026-02-18price $85,000
-
2026-01-13price $99,000
-
2025-12-18$120,000 Active
-
2022-09-27status Pending
-
2022-09-13status Active
-
2022-09-03status Active
-
2022-09-03price $54,900
-
2022-07-12price $65,000
-
2022-06-21price $85,000
-
2022-05-24$112,500 Active
ⓘ Source: listings_history table (triggers on properties + properties_extension) + one-shot
backfill from property_details.listing_events for pre-trigger history.
Tax reassessment forecast SC · Resets to sale price
- Current annual tax
- $536 · $45/mo
- Projected year-2 tax
- $536 · $45/mo
- Expected delta
- $0/yr ($0/mo · 0.0%)
ⓘ Screening estimate from a state-policy table — verify with the county assessor before closing.
Climate risk First Street
- Flood 1/10 Low FEMA zone X (unshaded) · 0% chance over 30 yrs
- Wildfire 4/10 Moderate
- Heat 6/10 Major 7 d/yr ≥107°F today · 16 d/yr by 30 yrs out
- Wind 5/10 Major 24% chance of damaging wind over 30 yrs
- Air quality 2/10 Low 1 unhealthy d/yr today · 1 by 30 yrs out
Nearby sold comps map
Loading sold comps map…
Walkable amenities ~0.75 mi
Loading nearby amenities…
Taxation est. · year 1
- Rental income
- $14,929
- − Mortgage interest
- −$4,201
- − Property taxes
- −$536
- − Insurance
- −$375
- − Repairs & maintenance
- −$1,194
- − Management
- −$1,194
- − Depreciation
- −$2,182
- Taxable income
- $5,247
- Est. tax owed @ 24.0%
- −$1,259
- After-tax cash flow
- $4,904/yr
For passive investors: Depreciation is non-cash, so a rental often shows a tax loss while cash-flowing — sheltering income. Rental losses are passive: they offset passive income freely, and up to $25,000/yr can offset ordinary (W-2) income if you actively participate and your MAGI is under $100k (phasing out to $0 by $150k); unused losses carry forward. On sale, claimed depreciation is recaptured at up to 25%, and gains may owe capital-gains tax (a 1031 exchange can defer both). Figures are a year-1 estimate at your 24.0% rate — not tax advice; consult a CPA.
Schools (NCES district)
- District
- Union 01
- NCES district ID
- 4503750
- Math proficiency
- 23% ▼ -9.00%
- Reading proficiency
- 33% ▬ 0.00%
- Median HH income
- $34,709
- Composite
- 23.05/100
- National rank
- #7971
- State rank
- #60 of 80 in SC
Livability — Carlisle
- Score
- 54/100
- State rank
- #325
- US rank
- #24001
Category grades
Schools grade is shown separately in the Schools card above.
Census & demographics
- Census place
- Carlisle, SC
- County
- Spartanburg County · 258,607 people
- Metro
- Spartanburg, SC
- Population (ZIP)
- 36,278
- Household income
- $57,805
- Rent vs Own
- Severe rent burden
- 1331.0
Population outlook (Union County) Hauer SSP2
- Today (2025)
- 25,518 people
- By 2030
- 24,099 · -5.6%
- By 2040
- 21,133 · -17.2%
- By 2050
- 18,314 · -28.2%
- By 2075
- 13,235 · -48.1%
- By 2100
- 9,565 · -62.5%
Race, ethnicity, and origin ACS 2023
- Neighborhood character
- Diverse neighborhood (Simpson 0.67)
- Race & ethnicity
- White 45% Black 32% Hispanic / Latino 13% Two or more races 9% Asian 5%
- Hispanic origin (detail)
- Mexican 7% Puerto Rican 2%
- Common ancestry
- Slovak 2% Lithuanian 1% Italian 1%
- Foreign-born
- 12% · Canada, China, Vietnam
- Languages at home
- 83% English-only · Spanish 10% Other Indo-European 3% Other Asian/Pacific 1%
Political lean MEDSL · Union
- 2024 margin
- Solid R (+32.7) · D 33.2% · R 65.9%
- 2008→2024 swing
- -21.5pp toward R · 2008: -11.2pp · 2024: -32.7pp
- All cycles
- 2024: R+32.7 2020: R+24.5 2016: R+19.3 2012: R+6.5 2008: R+11.2
Not yet ingested
- Civics
- —
Market trends
- HPI YoY
- ▼ -77.19%
- Current HPI
- 228.4172
- Rent YoY
- ▼ -2.64%
- Metro
- Spartanburg, SC
- State GDP YoY
- ▲ 4.51%
- F500 in state
- 2
Industry mix (Fortune 500 HQ in SC)
| Industry | F500 HQs | Revenue |
|---|---|---|
| Packaging | 1 | $7B |
|
||
Price history
-33.3% since first listed11 events — show timeline
- 2026-02-25 Price Changed $75,000 SPMLS
- 2026-02-18 Price Changed $85,000 SPMLS
- 2026-01-13 Price Changed $99,000 SPMLS
- 2025-12-18 Listed $120,000 SPMLS
- 2022-09-27 Pending — CANOPYMLS as Distributed by MLS Grid
- 2022-09-13 Relisted — CANOPYMLS as Distributed by MLS Grid
- 2022-09-03 Relisted — CANOPYMLS as Distributed by MLS Grid
- 2022-09-03 Price Changed $54,900 CANOPYMLS as Distributed by MLS Grid
- 2022-07-12 Price Changed $65,000 CANOPYMLS as Distributed by MLS Grid
- 2022-06-21 Price Changed $85,000 CANOPYMLS as Distributed by MLS Grid
- 2022-05-24 Listed $112,500 CANOPYMLS as Distributed by MLS Grid
Property tax history
+10.3%/yrLatest (2025): $536 · +7.8% YoY. Source: county tax records.
Cash-flow waterfall
monthlySold comps — $/sqft
last 12 mo · ≤1 miLoading sold comps…