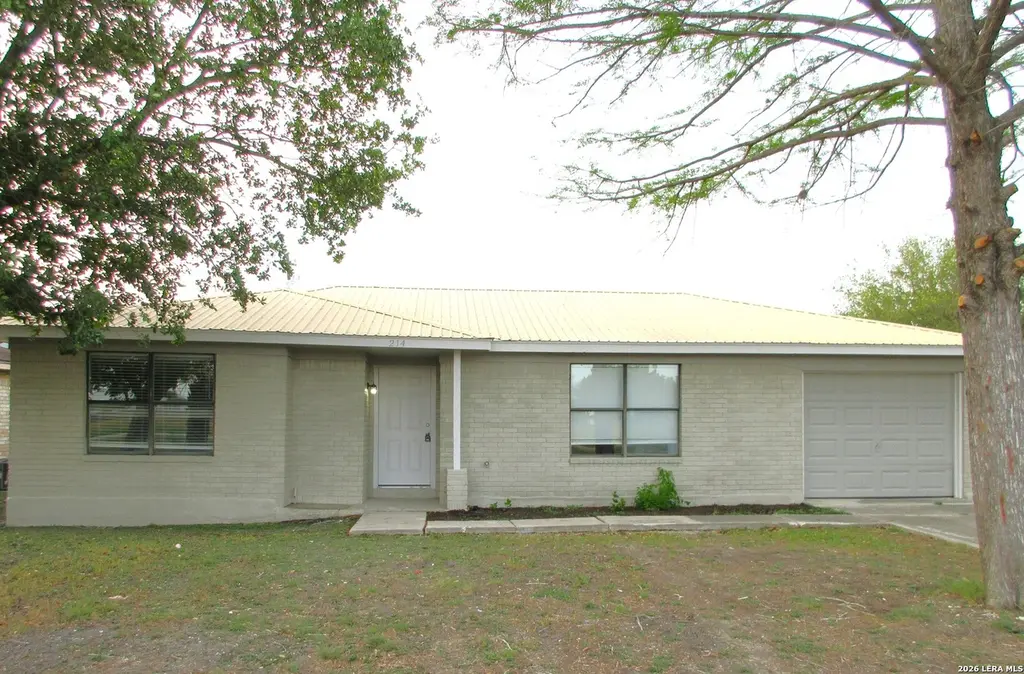
214 E Seguin St · Marion, TX
Flood risk 6/10 · Moderate
- FEMA flood zone
- X (unshaded)
- Chance of flooding over 30 yrs
- 0.69%
- Est. flood insurance / yr
- $507 – $1,088
Fire risk 4/10 · Minor
- Est. fire insurance / yr
- $1,222 – $2,270
Heat risk 8/10 · Major
- Hot days now (above 108°F)
- 7 days/yr
- Hot days in 30 yrs
- 22 days/yr
Wind risk 8/10 · Major
- Chance of severe wind over 30 yrs
- 80.0%
Air-quality risk 1/10 · Minimal
- Unhealthy air days now
- 0 days/yr
- Unhealthy air days in 30 yrs
- 0 days/yr
Risk factors via First Street. Map © Google.
Why this score? — see what drove the D grade
The composite is a weighted blend of 9 inputs, each scored 0–100. Each bar is that input's sub-score; the figure is the points it added to the 100-point composite (weight × sub-score).
- ARV discount +15.0/15.0
- Cash flow +8.1/30.0
- Schools +4.0/10.0
- Livability +3.3/5.0
- 1% rule +2.6/10.0
- Rent growth +2.5/5.0
- Condition / age +2.5/5.0
- DSCR +2.1/10.0
- Appreciation +0.0/10.0
$169,500
🖨 Deal sheet (PDF) 📄 Offer letter ✓ Due diligence
Listing remarks MLS
Completely updated and beautiful. New stainless appliances. New light fixtures. New door and cabinet hardware. New faux wood flooring in the living area. Tile floors in the kitchen, dining, and wet areas. New carpet in the bedrooms. Fresh paint inside and out. New 2 inch blinds and window treatments are included. Double vanity. Metal roof. Mature trees. New AC and heat system along with new air ducts 2026.
Key facts
- Tile floors
- New carpet
- Stainless appliances
Tags
Neighborhood map
What this means for you Summary
Snapshot
- This is a 3-bed/1.0-bath single-family listed at $170k.
Deal economics
- At list price, monthly cash flow is $-165 ($-2k/yr) — negative.
- To cash-flow at today's rent, offer at most $140k (17.2% below list).
- To meet the 1% rule (rent ≥ 1% of price), the offer needs to be $130k (23.5% below list).
- Recommended offer: $130k (23.5% below list) — sets the bar for 1% rule.
Location & tenants
- Location reads 66/100 on livability (#614 in TX) — a middle-class / working-renter tenant base. Strengths: crime A+, cost of living A+, housing A+; Watch: amenities F, commute F, health & safety F.
- Marion ISD (suburban): math 44% / reading 47% proficiency, ranked #243 of 826 in TX (top 29%) — families likely to look elsewhere, expect single-tenant / working-renter base with shorter leases.
- Zoned schools: Norma Krueger El (362 students, 50% FRL); Marion Middle (math 37% / reading 45%, grade F, #613 of 1,662 statewide, top 38%, 372 students, 41% FRL); Marion H S (math 47% / reading 62%, grade C-, #379 of 1,632 statewide, top 26%, 456 students, 36% FRL) — zoned schools at 42% FRL track the district average.
- Market conditions: 418 active listings in the ZIP; 2 comparable units currently listed for rent nearby; 2,064 units permitted in Guadalupe County in 2024 (133 in 5+ unit buildings).
Forward outlook
- Local home prices are declining (-3.0%/yr); year-one equity from $1k of loan paydown is wiped out by about $5k of value loss. Plan a longer hold.
- Guadalupe County population projected at +61% by 2050 — long-run rental-demand tailwind backs the buy-and-hold thesis.
Negotiation context
- It's been on market 52 days — a 3% lower offer ($164k) is reasonable based on typical stale-listing flexibility.
- 2 sale attempts since 22y ago; this cycle's ask has dropped $10k (6%) from the opening price — seller is motivated, your offer sets the floor, not the list.
Risks & watch-outs
- Climate carrying-cost: major flood risk; severe wind risk, 80% chance of damaging wind over 30y; extreme-heat days projected 7→22/yr by 2055 (HVAC capex compounding) — expect insurance premiums to compound above CPI over the hold.
Questions for the listing agent
- What do current leases actually rent for vs. the listed asking? Can we see a recent rent roll and the last 12 months of T-12 income?
- It's been on market 52 days. Have you received any prior offers? Is the seller open to a 24% concession, seller financing, or rate buy-down credit?
- Is there a deadline driving the sale (1031 exchange, divorce, estate, relocation)? That informs how much negotiation room exists.
- The area grade is low — what's the realistic commute time and amenity access for the typical tenant pool here? Any planned neighborhood developments (good or bad) we should know about?
- What's the average days-on-market for RENTAL listings here right now (not sales)? A rising rental-DOM trend means longer vacancies and softer asking-rent achievability than the comps imply.
- What's the recent tenant-quality profile in this submarket — average credit score on applications, eviction rate, late-payment / NSF rate, and stable-employment percentage? A property-management company in the area should have these aggregated.
- How much new for-sale + rental construction is in the pipeline within 1–3 miles? Heavy new supply typically softens prices + rents 12–24 months out; constrained supply supports both.
Investment metrics
- 1% rule
- 0.76% ✗
- Cap rate
- 5.12%
- Cash-on-cash
- -4.17%
- DSCR
- 0.81
- GRM
- 10.9
CMA / ARV
- ARV (median comp)
- $230,990
- List price
- $169,500
- Delta
- -26.62%
- Verdict
- UNDERPRICED
- Comps
- 20 within 1.0 mi
Show comp detail 12 sales within ~0.75 mi
| Address | Dist | Beds/Ba | Sqft | Sold | Price | $/sf | Match |
|---|---|---|---|---|---|---|---|
| 216 S Live Oak | 0.22mi | 2/1.0 (-1) | 1,222 (-3%) | 11mo | $199,950 | $164 | 71 |
| 222 Klein | 0.35mi | 2/1.0 (-1) | 1,248 (-1%) | 10mo | $287,500 | $230 | 69 |
| 478 Sarah Way | 0.70mi | 3/2.0 | 1,266 (+1%) | 11mo | $233,054 | $184 | 53 |
| 466 Sarah Way | 0.70mi | 3/2.0 | 1,266 (+1%) | 11mo | $199,999 | $158 | 53 |
| 526 Sarah Way | 0.70mi | 3/2.0 | 1,266 (+1%) | 11mo | $194,449 | $154 | 52 |
| 175 Lost Maples Way | 0.63mi | 3/2.0 | 1,407 (+12%) | 2mo | $289,900 | $206 | 45 |
| 713 Thea Mdws | 0.70mi | 3/2.0 | 1,402 (+12%) | 1mo | $230,999 | $165 | 43 |
| 306 Gadwall Ave | 0.70mi | 3/2.0 | 1,402 (+12%) | 4mo | $218,999 | $156 | 41 |
| 751 Thea Mdws | 0.70mi | 3/2.0 | 1,402 (+12%) | 4mo | $227,999 | $163 | 41 |
| 507 Sarah Way | 0.70mi | 3/2.0 | 1,402 (+12%) | 7mo | $210,999 | $150 | 38 |
| 434 Sarah Way | 0.70mi | 3/2.0 | 1,402 (+12%) | 11mo | $253,999 | $181 | 35 |
| 514 Sarah Way | 0.70mi | 3/2.0 | 1,402 (+12%) | 12mo | $206,999 | $148 | 34 |
Match score weights: distance 35% · size 25% · config 20% · recency 20%. Top-matched comps best support the ARV.
Projected returns pro-forma
-3.0% appreciation · 3.0% rent growth · sell at horizon
- IRR
- -23.3%
- Equity multiple
- 0.20×
- Total profit
- $-37,950
- Equity at exit
- $25,273
- IRR
- -18.0%
- Equity multiple
- 0.02×
- Total profit
- $-46,462
- Equity at exit
- $14,655
Cash invested: $47,460 (down + closing). Projections, not guarantees.
Landlord ↔ Tenant lean methodology
- Overall (STATE)
- 87 Strongly Landlord-Friendly
- State Texas
- 87 Strongly Landlord-Friendly · R+5
- County
- — inherits STATE
- City
- — inherits STATE
ZIP-level market 78124
- Active inventory
- 418
- Price-to-rent
- 10.9×
Monthly cashflow live
- Estimated rent
- $1,296 medium interval (Pro) →
- Mortgage (P&I)
- −$889
- Tax from tax record
- −$230 /mo · $2,754/yr
- Insurance
- −$71
- HOA
- −$0
- Vacancy / Maint / Mgmt
- −$272
- Net cashflow
- $-165
Break-even live
Sensitivity live
| Price | -10% $-69 | -5% $-117 | +0% $-165 | +5% $-213 | +10% $-261 |
|---|---|---|---|---|---|
| Rent | -10% $-267 | -5% $-216 | +0% $-165 | +5% $-114 | +10% $-63 |
| Rate | -1.0pp $-80 | -0.5pp $-122 | base $-165 | +0.5pp $-209 | +1.0pp $-254 |
UW: 25.0% down · 7.5% · 30yr · 1.5% tax · 5.0% vac · 8.0% maint · 8.0% mgmt
Financing live
Cash to close
- Down payment
- $42,375
- Closing costs
- $5,085
- Reserves months
- —
- Total cash needed
- —
Loan-product check · same deal, 3 products live
Conventional
25% down · 7.5% · 30yr
- Down + closing
- —
- Monthly P&I
- —
- Monthly cashflow
- —
- DSCR
- —
- Eligible?
- —
Personal DTI + credit; lowest rate.
DSCR
20% down · 8.5% · 30yr
- Down + closing
- —
- Monthly P&I
- —
- Monthly cashflow
- —
- DSCR
- —
- Eligible?
- —
No personal income docs; deal must DSCR.
Hard money
10% down · 12.0% · 12mo
- Down + closing
- —
- Monthly P&I
- —
- Monthly cashflow
- —
- DSCR
- —
- Eligible?
- —
Short-term bridge; refi at stabilization.
Rent comps 2 comps
| Address | Beds | Baths | Sqft | Rent | $/sqft | DOM | Units | Dist |
|---|---|---|---|---|---|---|---|---|
| 217 E Schulz St Marion, TX | 3.0 | 2.0 | 924 | $1,050 | $1.14 | 0d | 1 | 0.17mi |
| 205 W Schulz St Marion, TX | 3.0 | 1.5 | 1109 | $1,695 | $1.53 | 6d | 1 | 0.33mi |
Listing history 14 events
-
2026-06-08status $169,500 Pending 52 DOM
-
2026-06-07days on market $169,500 Active 52 DOM
-
2026-06-04days on market $169,500 Active 49 DOM
-
2026-06-03days on market $169,500 Active 48 DOM
-
2026-06-02days on market $169,500 Active 47 DOM
-
2026-06-01days on market $169,500 Active 46 DOM
-
2026-05-31days on market $169,500 Active 45 DOM
-
2026-05-03price $169,500 409-char remark
Show marketing remark (409 chars)
Completely updated and beautiful. New stainless appliances. New light fixtures. New door and cabinet hardware. New faux wood flooring in the living area. Tile floors in the kitchen, dining, and wet areas. New carpet in the bedrooms. Fresh paint inside and out. New 2 inch blinds and window treatments are included. Double vanity. Metal roof. Mature trees. New AC and heat system along with new air ducts 2026.
-
2026-04-16$179,500 New 409-char remark
Show marketing remark (409 chars)
Completely updated and beautiful. New stainless appliances. New light fixtures. New door and cabinet hardware. New faux wood flooring in the living area. Tile floors in the kitchen, dining, and wet areas. New carpet in the bedrooms. Fresh paint inside and out. New 2 inch blinds and window treatments are included. Double vanity. Metal roof. Mature trees. New AC and heat system along with new air ducts 2026.
-
2010-07-06soldstatus
-
2004-10-28soldstatus
-
2004-10-27soldstatus 291-char remark
Show marketing remark (291 chars)
AFFORDABLE HOME, 4 SIDES BRICK, METAL ROOF IN MARION ISD. GARAGE HAS BEEN CONVERTED TO THIRD BEDROOM, ADDITIONAL 160 SQ.FT. BRING YOUR DECORATING TALENTS TO THIS SOLID HOME. A ONE YEAR ERA HOME PROTECTION PLAN IS INCLUDED IN THE SALES PRICE. SECOND LISTING AGENT - JERRY SONIER 210-885-6188.
-
2004-03-16$63,900 291-char remark
Show marketing remark (291 chars)
AFFORDABLE HOME, 4 SIDES BRICK, METAL ROOF IN MARION ISD. GARAGE HAS BEEN CONVERTED TO THIRD BEDROOM, ADDITIONAL 160 SQ.FT. BRING YOUR DECORATING TALENTS TO THIS SOLID HOME. A ONE YEAR ERA HOME PROTECTION PLAN IS INCLUDED IN THE SALES PRICE. SECOND LISTING AGENT - JERRY SONIER 210-885-6188.
-
1998-02-13soldstatus
ⓘ Source: listings_history table (triggers on properties + properties_extension) + one-shot
backfill from property_details.listing_events for pre-trigger history.
Tax reassessment forecast TX · Resets to sale price
- Current annual tax
- $2,754 · $230/mo
- Projected year-2 tax
- $3,102 · $258/mo
- Expected delta
- +$347/yr (+$29/mo · 12.6%)
ⓘ Screening estimate from a state-policy table — verify with the county assessor before closing.
Climate risk First Street
- Flood 6/10 Major FEMA zone X (unshaded) · 69% chance over 30 yrs
- Wildfire 4/10 Moderate
- Heat 8/10 Severe 7 d/yr ≥108°F today · 22 d/yr by 30 yrs out
- Wind 8/10 Severe 80% chance of damaging wind over 30 yrs
- Air quality 1/10 Low 0 unhealthy d/yr today · 0 by 30 yrs out
Nearby sold comps map
Loading sold comps map…
Walkable amenities ~0.75 mi
Loading nearby amenities…
Taxation est. · year 1
- Rental income
- $15,554
- − Mortgage interest
- −$9,495
- − Property taxes
- −$2,754
- − Insurance
- −$848
- − Repairs & maintenance
- −$1,244
- − Management
- −$1,244
- − Depreciation
- −$4,931
- Taxable loss
- −$4,962
- Est. tax savings @ 24.0%
- +$1,191
- After-tax cash flow
- $-790/yr
For passive investors: Depreciation is non-cash, so a rental often shows a tax loss while cash-flowing — sheltering income. Rental losses are passive: they offset passive income freely, and up to $25,000/yr can offset ordinary (W-2) income if you actively participate and your MAGI is under $100k (phasing out to $0 by $150k); unused losses carry forward. On sale, claimed depreciation is recaptured at up to 25%, and gains may owe capital-gains tax (a 1031 exchange can defer both). Figures are a year-1 estimate at your 24.0% rate — not tax advice; consult a CPA.
Schools (NCES district)
- District
- Marion ISD
- NCES district ID
- 4829100
- Math proficiency
- 44% ▼ -10.00%
- Reading proficiency
- 47% ▼ -4.00%
- Median HH income
- $58,465
- Composite
- 39.86/100
- National rank
- #3867
- State rank
- #243 of 826 in TX
Livability — Marion
- Score
- 66/100
- State rank
- #614
- US rank
- #11619
Category grades
Schools grade is shown separately in the Schools card above.
Census & demographics
- Census place
- Marion, TX
- Population (ZIP)
- 6,907
Population outlook (Guadalupe County) Hauer SSP2
- Today (2025)
- 196,854 people
- By 2030
- 220,210 · +11.9%
- By 2040
- 268,004 · +36.1%
- By 2050
- 316,333 · +60.7%
- By 2075
- 434,747 · +120.8%
- By 2100
- 520,447 · +164.4%
Race, ethnicity, and origin ACS 2023
- Neighborhood character
- Diverse neighborhood (Simpson 0.61)
- Race & ethnicity
- White 49% Hispanic / Latino 38% Two or more races 24% Black 6% Asian 2%
- Hispanic origin (detail)
- Mexican 35% Puerto Rican 1%
- Common ancestry
- Slovak 3% Romanian 2% Iranian 1%
- Foreign-born
- 7% · Canada, Jamaica
- Languages at home
- 80% English-only · Spanish 18% Tagalog/Filipino 1%
Political lean MEDSL · Guadalupe
- 2024 margin
- Strong R (+29.5) · D 34.8% · R 64.3%
- 2008→2024 swing
- +1.5pp toward D · 2008: -31.0pp · 2024: -29.5pp
- All cycles
- 2024: R+29.5 2020: R+24.2 2016: R+31.8 2012: R+35.1 2008: R+31.0
Not yet ingested
- Civics
- —
Market trends
- HPI YoY
- ▼ -126.83%
- Current HPI
- 189.5796
- Rent YoY
- —
- Metro
- —
- State GDP YoY
- ▲ 3.95%
- F500 in state
- 110
Industry mix (Fortune 500 HQ in TX)
| Industry | F500 HQs | Revenue |
|---|---|---|
| Energy | 16 | $1,198B |
|
||
| Technology | 5 | $198B |
|
||
| Engineering / Construction | 4 | $72B |
|
||
| Energy Services | 3 | $60B |
|
||
| Utilities | 3 | $41B |
|
||
| Healthcare | 2 | $330B |
|
||
Price history
+165.3% since first listed7 events — show timeline
- 2026-05-03 Price Changed $169,500 LERA
- 2026-04-16 Listed $179,500 LERA
- 2010-07-06 Sold (Public Records) — Public Records
- 2004-10-28 Sold (Public Records) — Public Records
- 2004-10-27 Sold (MLS) — LERA
- 2004-03-16 Listed $63,900 LERA
- 1998-02-13 Sold (Public Records) — Public Records
Property tax history
+5.5%/yrLatest (2026): $2,754 · -8.7% YoY. Source: county tax records.
Cash-flow waterfall
monthlySold comps — $/sqft
last 12 mo · ≤1 miLoading sold comps…