11424 36th Dr NE #54 · Marysville, WA
Flood risk No data
- FEMA flood zone
- —
- Chance of flooding over 30 yrs
- —
- Est. flood insurance / yr
- —
Fire risk No data
- Est. fire insurance / yr
- —
Heat risk No data
- Hot days now (above threshold)
- —
- Hot days in 30 yrs
- —
Wind risk No data
- Chance of severe wind over 30 yrs
- —
Air-quality risk No data
- Unhealthy air days now
- —
- Unhealthy air days in 30 yrs
- —
Risk factors via First Street. Map © Google.
Why this score? — see what drove the B- grade
The composite is a weighted blend of 9 inputs, each scored 0–100. Each bar is that input's sub-score; the figure is the points it added to the 100-point composite (weight × sub-score).
- Cash flow +30.0/30.0
- DSCR +10.0/10.0
- 1% rule +7.5/10.0
- ARV discount +7.5/15.0
- Livability +4.2/5.0
- Schools +4.1/10.0
- Rent growth +3.1/5.0
- Condition / age +2.5/5.0
- Appreciation +0.0/10.0
$107,848
🖨 Deal sheet (PDF) 📄 Offer letter ✓ Due diligence
Listing remarks
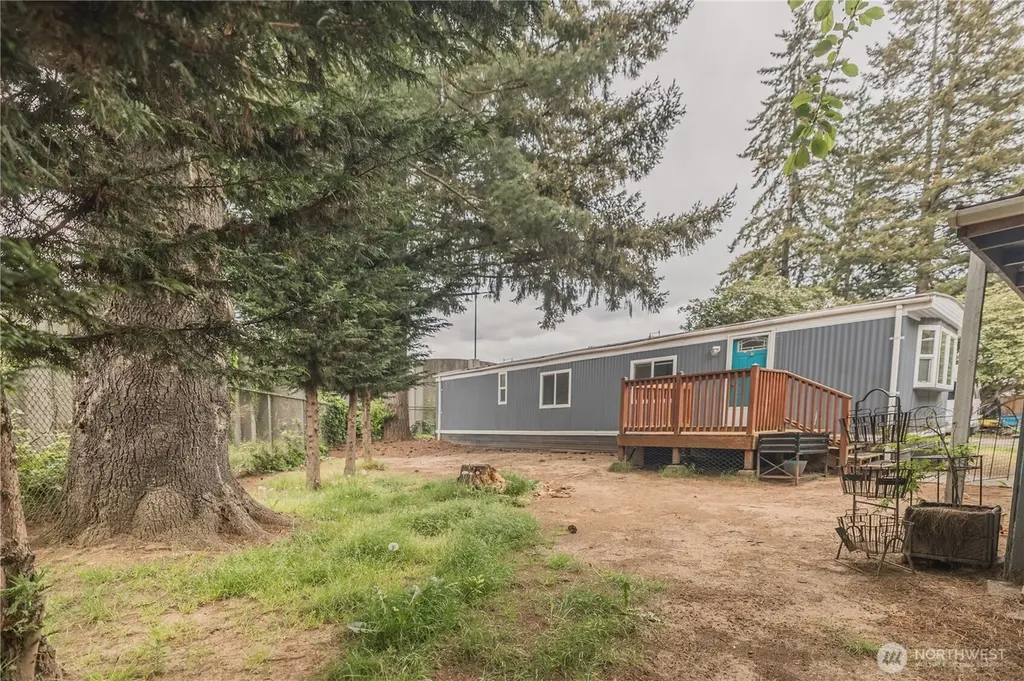
One of the largest lots in Mobile Manor with no neighbors on two sides, this beautifully updated 2 bed/1 bath single wide offers something rare in 55+ living: real privacy and outdoor space. The fully fenced yard is perfect for pets, gardening, or hosting, and mature trees provide natural screening on multiple sides. Inside, fresh paint and brand-new LVP flooring run throughout. The open living area features an electric fireplace, recessed lighting, and flows into a kitchen with white shaker cabinets, granite counters, and mosaic tile backsplash, and a bar overlooking picture windows. A second breakfast bar with seating connects the kitchen to a bright dining nook with oversized windows. Bo
Key facts
- Recessed lighting
- Largest lots
- Electric fireplace
Tags
Property features AI
Finance
- Other: GPS-friendly directions available; On-market date: June 8, 2026
- Financial info: Listing terms: Cash or Conventional
- HOA & community: Located in Mobile Manor park (approved for sale); Senior community; Community amenities: common area, high-speed internet available, laundry, recreational area, RV parking, sidewalks, trails; Approximately 94 homes in the park; Land lease: $685
Exterior
- Parking: Carport; Uncovered parking; RV parking available in park
- Utilities: Public water (Marysville PUD); Park-maintained septic; Electric water heater located in exterior closet; Power by SnoCo PUD; Cable (Xfinity); Internet (Xfinity)
- Home design: Manufactured home (single wide); One level; Updated/Remodeled; Mobile home remains
- Construction: Metal/vinyl construction; Composition roof
- Exterior features: Metal/vinyl exterior; Patio/porch/deck; Landscaped; Corner lot; Dead-end street; Paved; Secluded setting
Interior
- Kitchen: Microwave; Refrigerator; Stove/Range
- Bedrooms: 2 bedrooms
- Bathrooms: 1 full bathroom (includes bathtub and shower)
- Heating & cooling: Forced air heating; Electric energy source; Double pane windows
- Interior features: Fireplace (electric); Updated/remodeled interior; Water heater
- Laundry & utility: Laundry available in park
Neighborhood map
What this means for you Summary
Snapshot
- This is a 1-bed/1.0-bath manufactured listed at $108k.
Deal economics
- At list price, monthly cash flow is $420 ($5k/yr) — positive.
- The deal already cash-flows at list — no discount required.
- Meets the 1% rule at list price ($1k rent vs $108k).
- Cap rate 11.0% vs local median 3.0% in Marysville — top-decile yield for the area; either an underpriced asset or a hidden risk that comps aren't pricing in. Stress-test before assuming the spread holds.
Location & tenants
- Location reads 84/100 on livability (#43 in WA, #768 nationally) — a professional / high-income tenant draw. Strengths: commute A+, employment A+, housing A+; Watch: cost of living F.
- Marysville School District (suburban): math 36% / reading 51% proficiency, ranked #177 of 291 in WA (top 61%) — families likely to look elsewhere, expect single-tenant / working-renter base with shorter leases.
- Zoned schools: Marshall Elementary (362 students, 67% FRL); Marysville Middle School (644 students, 66% FRL); Marysville Pilchuck High School (1,238 students, 63% FRL) — zoned schools average 65% FRL vs 40% district-wide (25 pts higher); higher-poverty schools than district average — tighter screening recommended.
- Market conditions: Rents rising (+2.3%/yr); 214 active listings in the ZIP; 1 comparable units currently listed for rent nearby; solid renter incomes; 3,982 units permitted in Snohomish County in 2024 (1,492 in 5+ unit buildings).
- This rent is only 17% of the median local income ($96k/yr) — well below the 30% rent-burden line; pricing power to push rent on renewal without tenant pushback.
Forward outlook
- Local home prices are declining (-3.0%/yr); year-one equity from $746 of loan paydown is wiped out by about $3k of value loss. Plan a longer hold.
- Snohomish County population projected at +30% by 2050 — long-run rental-demand tailwind backs the buy-and-hold thesis.
- At projected returns (-3.0% appreciation + 2.3% rent growth), your $30k cash investment doubles in ~8 years — after that, you're playing with house money.
Negotiation context
- Only 14 days on market — expect competitive offers; lowballing is unlikely to land.
- 5 sale attempts since 7y ago with the ask held roughly flat each time — persistent listings suggest the price (not the market) is what's stuck; bring a comps-based counter.
- Current owner paid $45k; list at $108k implies a 140% gain — meaningful room to come down on a strong offer.
Questions for the listing agent
- Is there a deadline driving the sale (1031 exchange, divorce, estate, relocation)? That informs how much negotiation room exists.
- Schools are B-rated — typically a magnet for longer-tenancy family renters. What's the average tenant stay here, and is there a school-zone premium baked into asking?
- What's the average days-on-market for RENTAL listings here right now (not sales)? A rising rental-DOM trend means longer vacancies and softer asking-rent achievability than the comps imply.
- What's the recent tenant-quality profile in this submarket — average credit score on applications, eviction rate, late-payment / NSF rate, and stable-employment percentage? A property-management company in the area should have these aggregated.
- How much new for-sale + rental construction is in the pipeline within 1–3 miles? Heavy new supply typically softens prices + rents 12–24 months out; constrained supply supports both.
Investment metrics
- 1% rule
- 1.25% ✓
- Cap rate
- 10.96%
- Cash-on-cash
- 16.68%
- DSCR
- 1.74
- GRM
- 6.7
CMA / ARV
- ARV (median comp)
- $52,880
- List price
- $107,848
- Delta
- 125.98%
- Verdict
- OVERPRICED
- Comps
- 12 within 1.0 mi
Projected returns pro-forma
-3.0% appreciation · 2.3% rent growth · sell at horizon
- IRR
- 7.1%
- Equity multiple
- 1.27×
- Total profit
- $8,278
- Equity at exit
- $16,080
- IRR
- 15.8%
- Equity multiple
- 2.25×
- Total profit
- $37,659
- Equity at exit
- $9,325
Cash invested: $30,197 (down + closing). Projections, not guarantees.
Landlord ↔ Tenant lean methodology
- Overall (STATE)
- 28 Tenant-Leaning
- State Washington
- 28 Tenant-Leaning · D+8
- County
- — inherits STATE
- City
- — inherits STATE
ZIP-level market 98271
- Rents YoY
- 2.3%
- Active inventory
- 214
- Price-to-rent
- 6.7×
Monthly cashflow live
- Estimated rent
- $1,343 medium interval (Pro) →
- Mortgage (P&I)
- −$566
- Tax from tax record
- −$31 /mo · $366/yr
- Insurance
- −$45
- HOA
- −$0
- Lot rent leased land?
- −$0
- Vacancy / Maint / Mgmt
- −$282
- Net cashflow
- $420
Break-even live
Sensitivity live
| Price | -10% $481 | -5% $450 | +0% $420 | +5% $389 | +10% $359 |
|---|---|---|---|---|---|
| Rent | -10% $314 | -5% $367 | +0% $420 | +5% $473 | +10% $526 |
| Rate | -1.0pp $474 | -0.5pp $447 | base $420 | +0.5pp $392 | +1.0pp $363 |
UW: 25.0% down · 7.5% · 30yr · 1.5% tax · 5.0% vac · 8.0% maint · 8.0% mgmt
Financing live
Cash to close
- Down payment
- $26,962
- Closing costs
- $3,235
- Reserves months
- —
- Total cash needed
- —
Loan-product check · same deal, 3 products live
Conventional
25% down · 7.5% · 30yr
- Down + closing
- —
- Monthly P&I
- —
- Monthly cashflow
- —
- DSCR
- —
- Eligible?
- —
Personal DTI + credit; lowest rate.
DSCR
20% down · 8.5% · 30yr
- Down + closing
- —
- Monthly P&I
- —
- Monthly cashflow
- —
- DSCR
- —
- Eligible?
- —
No personal income docs; deal must DSCR.
Hard money
10% down · 12.0% · 12mo
- Down + closing
- —
- Monthly P&I
- —
- Monthly cashflow
- —
- DSCR
- —
- Eligible?
- —
Short-term bridge; refi at stabilization.
Rent comps 1 comps
| Address | Beds | Baths | Sqft | Rent | $/sqft | DOM | Units | Dist |
|---|---|---|---|---|---|---|---|---|
| 12115 State Ave Marysville, WA | 1.0–3.0 | 1.0–2.0 | 881 | $1,770 | $2.01 | 7d | 1 | 0.49mi |
Listing history 30 events
-
2026-06-22days on market $107,848 Active 14 DOM
-
2026-06-21days on market $107,848 Active 13 DOM
-
2026-06-18days on market $107,848 Active 10 DOM
-
2026-06-17days on market $107,848 Active 9 DOM
-
2026-06-16days on market $107,848 Active 8 DOM
-
2026-06-15days on market $107,848 Active 7 DOM
-
2026-06-13days on market $107,848 Active 5 DOM
-
2026-06-08pricedays on market $107,848 Active 1 DOM
-
2026-06-07days on market $113,525 Active 10 DOM
-
2026-06-04days on market $113,525 Active 7 DOM
-
2026-06-03days on market $113,525 Active 6 DOM
-
2026-06-02days on market $113,525 Active 5 DOM
-
2026-06-01days on market $113,525 Active 4 DOM
-
2026-05-31days on market $113,525 Active 3 DOM
-
2026-05-15$119,500 Active
-
2019-10-25soldstatus $45,000 Sold
-
2019-10-16status Pending
-
2019-10-13historical Contingent
-
2019-09-27status Active
-
2019-09-10historical Contingent
-
2019-08-08price $45,000
-
2019-07-30price $50,000
-
2019-07-08price $55,000
-
2019-06-28status Active
-
2019-06-24status Pending
-
2019-06-20status Active
-
2019-06-20price $60,000
-
2019-06-11status Pending Inspection
-
2019-05-07price $65,000
-
2019-04-18$70,000 Active
ⓘ Source: listings_history table (triggers on properties + properties_extension) + one-shot
backfill from property_details.listing_events for pre-trigger history.
Tax reassessment forecast WA · Resets to sale price
- Current annual tax
- $366 · $31/mo
- Projected year-2 tax
- $1,057 · $88/mo
- Expected delta
- +$691/yr (+$58/mo · 188.7%)
ⓘ Screening estimate from a state-policy table — verify with the county assessor before closing.
Nearby sold comps map
Loading sold comps map…
Walkable amenities ~0.75 mi
Loading nearby amenities…
Taxation est. · year 1
- Rental income
- $16,114
- − Mortgage interest
- −$6,041
- − Property taxes
- −$366
- − Insurance
- −$539
- − Repairs & maintenance
- −$1,289
- − Management
- −$1,289
- − Depreciation
- −$3,137
- Taxable income
- $3,452
- Est. tax owed @ 24.0%
- −$828
- After-tax cash flow
- $4,209/yr
For passive investors: Depreciation is non-cash, so a rental often shows a tax loss while cash-flowing — sheltering income. Rental losses are passive: they offset passive income freely, and up to $25,000/yr can offset ordinary (W-2) income if you actively participate and your MAGI is under $100k (phasing out to $0 by $150k); unused losses carry forward. On sale, claimed depreciation is recaptured at up to 25%, and gains may owe capital-gains tax (a 1031 exchange can defer both). Figures are a year-1 estimate at your 24.0% rate — not tax advice; consult a CPA.
Schools (NCES district)
- District
- Marysville School District
- NCES district ID
- 5304860
- Math proficiency
- 36% ▼ -1.00%
- Reading proficiency
- 51% ▲ 2.00%
- Median HH income
- $67,461
- Composite
- 41.31/100
- National rank
- #7367
- State rank
- #177 of 291 in WA
Livability — Marysville
- Score
- 84/100
- State rank
- #43
- US rank
- #768
Category grades
Schools grade is shown separately in the Schools card above.
Census & demographics
- Census place
- Marysville, WA
- County
- Snohomish County · 786,756 people
- City population
- 85,887
- Metro
- Seattle-Tacoma-Bellevue, WA
- Population (ZIP)
- 30,838
- Household income
- $95,654
- Rent vs Own
- Severe rent burden
- 929.0
Population outlook (Snohomish County) Hauer SSP2
- Today (2025)
- 899,800 people
- By 2030
- 960,975 · +6.8%
- By 2040
- 1,074,447 · +19.4%
- By 2050
- 1,171,954 · +30.2%
- By 2075
- 1,384,849 · +53.9%
- By 2100
- 1,497,296 · +66.4%
Race, ethnicity, and origin ACS 2023
- Neighborhood character
- Predominantly White (66%)
- Race & ethnicity
- White 66% Two or more races 13% Hispanic / Latino 13% Native American 7% Asian 5% Black 1%
- Hispanic origin (detail)
- Mexican 9%
- Common ancestry
- Portuguese 6% Iranian 3% Lithuanian 2%
- Foreign-born
- 9% · Canada, China, South Korea
- Languages at home
- 86% English-only · Spanish 8% Russian/Polish/Slavic 1% Tagalog/Filipino 1%
Political lean MEDSL · Snohomish
- 2024 margin
- D (+19.0) · D 57.8% · R 38.9% · Other 3.3%
- 2008→2024 swing
- +0.1pp no change · 2008: 18.9pp · 2024: 19.0pp
- All cycles
- 2024: D+19.0 2020: D+20.6 2016: D+16.6 2012: D+16.2 2008: D+18.9
Not yet ingested
- Civics
- —
Market trends
- HPI YoY
- ▼ -666.16%
- Current HPI
- 305.285
- Rent YoY
- ▲ 2.30%
- Metro
- Seattle-Tacoma-Bellevue, WA
- State GDP YoY
- ▲ 4.65%
- F500 in state
- 22
Industry mix (Fortune 500 HQ in WA)
| Industry | F500 HQs | Revenue |
|---|---|---|
| Retail | 2 | $269B |
|
||
| Technology / Retail | 1 | $638B |
|
||
| Technology | 1 | $245B |
|
||
| Telecommunications | 1 | $38B |
|
||
| Food / Beverage | 1 | $36B |
|
||
| Automotive / Trucks | 1 | $34B |
|
||
Price history
+54.1% since first listed16 events — show timeline
- 2026-06-08 Listed $107,848 NWMLS as Distributed by MLS Grid
- 2019-10-25 Sold (MLS) $45,000 NWMLS as Distributed by MLS Grid
- 2019-10-16 Pending — NWMLS as Distributed by MLS Grid
- 2019-10-13 Contingent — NWMLS as Distributed by MLS Grid
- 2019-09-27 Relisted — NWMLS as Distributed by MLS Grid
- 2019-09-10 Contingent — NWMLS as Distributed by MLS Grid
- 2019-08-08 Price Changed $45,000 NWMLS as Distributed by MLS Grid
- 2019-07-30 Price Changed $50,000 NWMLS as Distributed by MLS Grid
- 2019-07-08 Price Changed $55,000 NWMLS as Distributed by MLS Grid
- 2019-06-28 Relisted — NWMLS as Distributed by MLS Grid
- 2019-06-24 Pending — NWMLS as Distributed by MLS Grid
- 2019-06-20 Relisted — NWMLS as Distributed by MLS Grid
- 2019-06-20 Price Changed $60,000 NWMLS as Distributed by MLS Grid
- 2019-06-11 Pending — NWMLS as Distributed by MLS Grid
- 2019-05-07 Price Changed $65,000 NWMLS as Distributed by MLS Grid
- 2019-04-18 Listed $70,000 NWMLS as Distributed by MLS Grid
Property tax history
+8.6%/yrLatest (2026): $366 · -3.4% YoY. Source: county tax records.
Cash-flow waterfall
monthlySold comps — $/sqft
last 12 mo · ≤1 miLoading sold comps…