 🏗️ New Construction
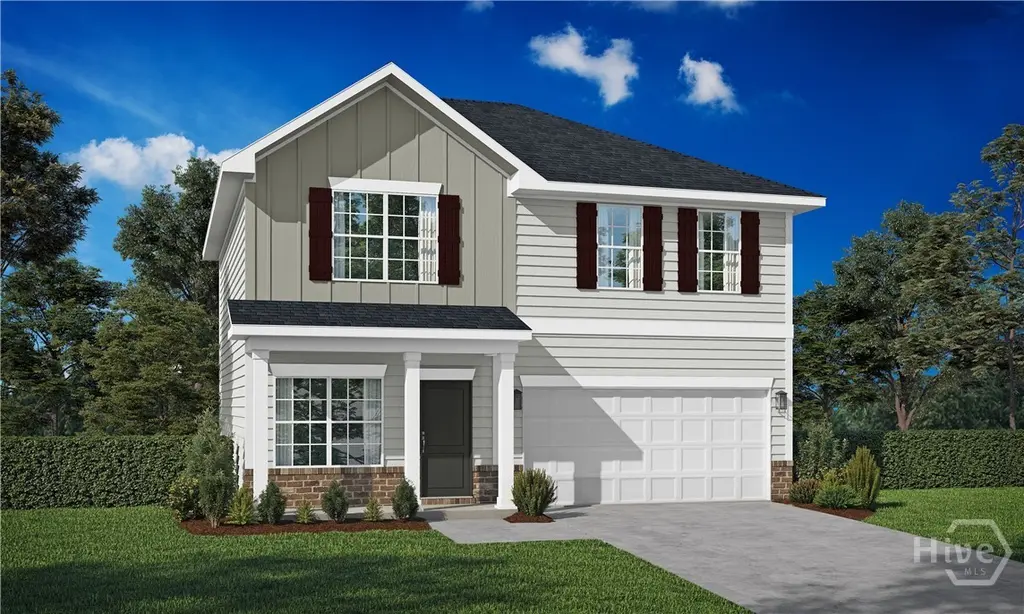
224 Quail Run Way SE · Walthourville, GA
Flood risk No data
- FEMA flood zone
- —
- Chance of flooding over 30 yrs
- —
- Est. flood insurance / yr
- —
Fire risk No data
- Est. fire insurance / yr
- —
Heat risk No data
- Hot days now (above threshold)
- —
- Hot days in 30 yrs
- —
Wind risk No data
- Chance of severe wind over 30 yrs
- —
Air-quality risk No data
- Unhealthy air days now
- —
- Unhealthy air days in 30 yrs
- —
Risk factors via First Street. Map © Google.
Why this score? — see what drove the D- grade
The composite is a weighted blend of 9 inputs, each scored 0–100. Each bar is that input's sub-score; the figure is the points it added to the 100-point composite (weight × sub-score).
- Cash flow +9.6/30.0
- ARV discount +7.5/15.0
- Appreciation +5.1/10.0
- Condition / age +4.0/5.0
- Livability +3.2/5.0
- 1% rule +3.0/10.0
- DSCR +2.7/10.0
- Rent growth +2.5/5.0
- Schools +2.3/10.0
$285,575
🖨 Deal sheet (PDF) 📄 Offer letter ✓ Due diligence
Listing remarks
You'll love the Anderson plan located in The Village at Sassafras, because it combines form and function into one exquisite home. Entering from the foyer, you will first access the flex room - furnish as an office, second living space, the possibilities are endless! Continuing down a short corridor, you are greeted by an inviting kitchen with corner pantry and bar area for additional seating. The family room is visible from the kitchen - perfect for the modern family. Upstairs, the master suite features a spacious bedroom but the en-suite steals the show. Dual vanities, a garden tub, separate shower, private toilet room and an expansive walk-in closet. Three secondary bedrooms share a hall
Key facts
- Inviting kitchen
- Master suite
- Corner pantry
Tags
Property features AI
Finance
- Other: Located in The Village at Sassafras
- HOA & community: Homeowners association with $34 monthly fee
Exterior
- Parking: Attached 2-car garage
- Utilities: Shared well water; Septic tank sewer
- Home design: Single family residence; New construction; Two stories; Slab foundation
- Construction: Brick construction; Asphalt roof; Home warranty included
- Exterior features: Patio; Underground utilities
Interior
- Kitchen: Dishwasher; Microwave; Oven; Range; Refrigerator; Electric water heater
- Bathrooms: Two full bathrooms; One half bathroom
- Heating & cooling: Central heating (electric); Central air conditioning (electric)
- Interior features: Breakfast bar; Entrance foyer; Pantry; Accessible full bathroom
- Laundry & utility: Laundry room with washer hookup
Neighborhood map
What this means for you Summary
Snapshot
- This is a 4-bed/2.5-bath single-family listed at $286k. Condition is rated good.
Deal economics
- At list price, monthly cash flow is $-197 ($-2k/yr) — negative.
- To cash-flow at today's rent, offer at most $263k (7.9% below list).
- To meet the 1% rule (rent ≥ 1% of price), the offer needs to be $234k (17.9% below list).
- Recommended offer: $234k (17.9% below list) — sets the bar for 1% rule.
Location & tenants
- Location reads 64/100 on livability (#255 in GA) — a middle-class / working-renter tenant base. Strengths: cost of living A+, housing A+, crime B; Watch: employment D, amenities F, commute F.
- Long County (rural): math 26% / reading 26% proficiency, ranked #115 of 174 in GA (top 66%) — low school quality limits family demand, transient renter base, plan for 1-2y turnover; 61% free/reduced lunch — lower-income household profile, screen leases tightly.
- Zoned schools: Smiley Elementary School (1,258 students, 67% FRL); Long County Middle School (math 21% / reading 27%, grade F, #311 of 470 statewide, top 68%, 945 students, 69% FRL); Long County High School (math 37% / reading 22%, grade F, #140 of 424 statewide, top 35%, 1,209 students, 70% FRL).
- Market conditions: 141 active listings in the ZIP; 1 comparable units currently listed for rent nearby; 298 units permitted in Long County in 2024 (0 in 5+ unit buildings).
- This rent runs 43% of the median local income ($65k/yr) — at the standard rent-burdened threshold; future hikes will face affordability resistance.
Forward outlook
- In year one you build about $2k of equity ($2k loan paydown + $453 appreciation (0.2% local appreciation)).
- Long County population projected at +72% by 2050 — long-run rental-demand tailwind backs the buy-and-hold thesis.
- By year 10, paydown + projected appreciation supports a ~$32k cash-out refi (75% LTV) — recoverable capital for the next deal without selling this one.
Negotiation context
- It's been on market 23 days — a 2% lower offer ($281k) is reasonable based on typical stale-listing flexibility.
Questions for the listing agent
- What do current leases actually rent for vs. the listed asking? Can we see a recent rent roll and the last 12 months of T-12 income?
- What does the HOA fee cover, when was the last increase, and are there any pending special assessments or reserve-fund shortfalls?
- Is there a deadline driving the sale (1031 exchange, divorce, estate, relocation)? That informs how much negotiation room exists.
- Schools are F-rated, which usually means shorter tenancies and higher turnover. Who's the typical renter profile here, and what's been the actual vacancy rate?
- The area grade is low — what's the realistic commute time and amenity access for the typical tenant pool here? Any planned neighborhood developments (good or bad) we should know about?
- What's the average days-on-market for RENTAL listings here right now (not sales)? A rising rental-DOM trend means longer vacancies and softer asking-rent achievability than the comps imply.
- What's the recent tenant-quality profile in this submarket — average credit score on applications, eviction rate, late-payment / NSF rate, and stable-employment percentage? A property-management company in the area should have these aggregated.
- How much new for-sale + rental construction is in the pipeline within 1–3 miles? Heavy new supply typically softens prices + rents 12–24 months out; constrained supply supports both.
Investment metrics
- 1% rule
- 0.80% ✗
- Cap rate
- 5.48%
- Cash-on-cash
- -2.89%
- DSCR
- 0.87
- GRM
- 10.4
CMA / ARV
- ARV (on-the-fly)
- $291,410
- Comps found
- 12
Show comp detail 12 sales within ~0.75 mi
| Address | Dist | Beds/Ba | Sqft | Sold | Price | $/sf | Match |
|---|---|---|---|---|---|---|---|
| 404 Buckhead Loop SE | 0.35mi | 4/2.5 | 1,810 (0%) | 1mo | $283,825 | $157 | 83 |
| 334 Buckhead Loop SE | 0.40mi | 4/2.5 | 1,810 (0%) | 3mo | $284,025 | $157 | 79 |
| 631 Buckhead Loop SE | 0.14mi | 4/3.0 | 1,984 (+10%) | 1mo | $315,475 | $159 | 75 |
| 722 Buckhead Loop SE | 0.14mi | 4/2.5 | 1,609 (-11%) | 0mo | $279,800 | $174 | 75 |
| 358 Buckhead Loop SE | 0.35mi | 4/2.0 | 1,735 (-4%) | 2mo | $301,090 | $174 | 73 |
| 382 Buckhead Loop SE | 0.35mi | 4/2.0 | 1,926 (+6%) | 1mo | $310,875 | $161 | 70 |
| 802 Buckhead Loop SE | 0.14mi | 4/2.5 | 2,065 (+14%) | 0mo | $296,375 | $144 | 70 |
| 663 Buckhead Loop SE | 0.14mi | 4/2.0 | 1,565 (-14%) | 1mo | $276,975 | $177 | 68 |
| 218 Antler Ave | 0.24mi | 4/3.0 | 1,984 (+10%) | 6mo | $296,450 | $149 | 66 |
| 916 Buckhead Loop SE | 0.19mi | 4/2.5 | 2,065 (+14%) | 3mo | $306,210 | $148 | 65 |
| 1118 Buckhead Loop SE | 0.14mi | 4/2.0 | 1,565 (-14%) | 6mo | $275,650 | $176 | 64 |
| 393 Buckhead Loop SE | 0.35mi | 4/2.0 | 1,565 (-14%) | 0mo | $280,500 | $179 | 59 |
Match score weights: distance 35% · size 25% · config 20% · recency 20%. Top-matched comps best support the ARV.
Projected returns pro-forma
0.16% appreciation · 3.0% rent growth · sell at horizon
- IRR
- -4.9%
- Equity multiple
- 0.77×
- Total profit
- $-18,861
- Equity at exit
- $86,888
- IRR
- 0.9%
- Equity multiple
- 1.10×
- Total profit
- $8,330
- Equity at exit
- $106,273
Cash invested: $81,595 (down + closing). Projections, not guarantees.
Landlord ↔ Tenant lean methodology
- Overall (STATE)
- 90 Strongly Landlord-Friendly
- State Georgia
- 90 Strongly Landlord-Friendly · R+3
- County
- — inherits STATE
- City
- — inherits STATE
ZIP-level market 31301
- Home prices YoY
- 0.1%
- Active inventory
- 141
- Price-to-rent
- 10.2×
Monthly cashflow live
- Estimated rent
- $2,343 medium interval (Pro) →
- Mortgage (P&I)
- −$1,528
- Tax est. 1.5%
- −$364 /mo · $4,371/yr
- Insurance
- −$121
- HOA
- −$34
- Vacancy / Maint / Mgmt
- −$492
- Net cashflow
- $-197
Break-even live
Sensitivity live
| Price | -10% $5 | -5% $-96 | +0% $-197 | +5% $-297 | +10% $-398 |
|---|---|---|---|---|---|
| Rent | -10% $-382 | -5% $-289 | +0% $-197 | +5% $-104 | +10% $-12 |
| Rate | -1.0pp $-50 | -0.5pp $-123 | base $-197 | +0.5pp $-272 | +1.0pp $-349 |
UW: 25.0% down · 7.5% · 30yr · 1.5% tax · 5.0% vac · 8.0% maint · 8.0% mgmt
Financing live
Cash to close
- Down payment
- $72,852
- Closing costs
- $8,742
- Reserves months
- —
- Total cash needed
- —
Loan-product check · same deal, 3 products live
Conventional
25% down · 7.5% · 30yr
- Down + closing
- —
- Monthly P&I
- —
- Monthly cashflow
- —
- DSCR
- —
- Eligible?
- —
Personal DTI + credit; lowest rate.
DSCR
20% down · 8.5% · 30yr
- Down + closing
- —
- Monthly P&I
- —
- Monthly cashflow
- —
- DSCR
- —
- Eligible?
- —
No personal income docs; deal must DSCR.
Hard money
10% down · 12.0% · 12mo
- Down + closing
- —
- Monthly P&I
- —
- Monthly cashflow
- —
- DSCR
- —
- Eligible?
- —
Short-term bridge; refi at stabilization.
Rent comps 1 comps
| Address | Beds | Baths | Sqft | Rent | $/sqft | DOM | Units | Dist |
|---|---|---|---|---|---|---|---|---|
| 2722 Arnall Dr Allenhurst, GA | 5.0 | 3.0 | 2256 | $2,600 | $1.15 | 45d | 1 | 0.33mi |
HOA detail
- Monthly dues
- $34 · $408/yr
Listing history 18 events
-
2026-06-21days on market $285,575 Active 23 DOM
-
2026-06-19days on market $285,575 Active 21 DOM
-
2026-06-18days on market $285,575 Active 20 DOM
-
2026-06-17days on market $285,575 Active 19 DOM
-
2026-06-16days on market $285,575 Active 18 DOM
-
2026-06-15days on market $285,575 Active 17 DOM
-
2026-06-14days on market $285,575 Active 15 DOM
-
2026-06-13days on market $285,575 Active 14 DOM
-
2026-06-10days on market $285,575 Active 12 DOM
-
2026-06-09days on market $285,575 Active 11 DOM
-
2026-06-08days on market $285,575 Active 10 DOM
-
2026-06-07days on market $285,575 Active 9 DOM
-
2026-06-05days on market $285,575 Active 6 DOM
-
2026-06-03days on market $285,575 Active 5 DOM
-
2026-06-02days on market $285,575 Active 4 DOM
-
2026-06-01days on market $285,575 Active 3 DOM
-
2026-05-31days on market $285,575 Active 2 DOM
-
2026-05-29$285,575 Active
ⓘ Source: listings_history table (triggers on properties + properties_extension) + one-shot
backfill from property_details.listing_events for pre-trigger history.
Nearby sold comps map
Loading sold comps map…
Walkable amenities ~0.75 mi
Loading nearby amenities…
Taxation est. · year 1
- Rental income
- $28,119
- − Mortgage interest
- −$16,323
- − Property taxes
- −$4,371
- − Insurance
- −$1,457
- − Repairs & maintenance
- −$2,250
- − Management
- −$2,250
- − HOA
- −$408
- − Depreciation
- −$8,477
- Taxable loss
- −$7,417
- Est. tax savings @ 24.0%
- +$1,780
- After-tax cash flow
- $-580/yr
For passive investors: Depreciation is non-cash, so a rental often shows a tax loss while cash-flowing — sheltering income. Rental losses are passive: they offset passive income freely, and up to $25,000/yr can offset ordinary (W-2) income if you actively participate and your MAGI is under $100k (phasing out to $0 by $150k); unused losses carry forward. On sale, claimed depreciation is recaptured at up to 25%, and gains may owe capital-gains tax (a 1031 exchange can defer both). Figures are a year-1 estimate at your 24.0% rate — not tax advice; consult a CPA.
Condition & rehab AI · 3 photos
This home is in excellent condition with a good condition score of 80. It is move-in ready with minimal cosmetic updates needed to enhance its curb appeal and interior aesthetics.
Value-add opportunities
- Both Painting exterior and interior — Enhances curb appeal and interior aesthetics
- Both Landscaping improvements — Enhances curb appeal and adds value
- Resale Kitchen appliances — Modernizes the kitchen and appeals to potential buyers
- Resale Bathroom fixtures — Modernizes bathrooms and appeals to potential buyers
Renovation cost estimate screening
Value-add ROI direction
- Both Painting exterior and interior — Enhances curb appeal and interior aesthetics ↑
- Both Landscaping improvements — Enhances curb appeal and adds value ↑
- Resale Kitchen appliances — Modernizes the kitchen and appeals to potential buyers ↑
- Resale Bathroom fixtures — Modernizes bathrooms and appeals to potential buyers ↑
ⓘ Cost ranges are severity-bucket heuristics (US national rule-of-thumb). Get contractor quotes + a written scope before underwriting a rehab budget.
Schools (NCES district)
- District
- Long County
- NCES district ID
- 1303360
- Math proficiency
- 26% ▼ -14.00%
- Reading proficiency
- 26% ▼ -13.00%
- Median HH income
- $45,958
- Composite
- 22.51/100
- National rank
- #8090
- State rank
- #115 of 174 in GA
Livability — Walthourville
- Score
- 64/100
- State rank
- #255
- US rank
- #14108
Category grades
Schools grade is shown separately in the Schools card above.
Census & demographics
- County
- Liberty County · 58,565 people
- City population
- 4,933
- Metro
- Hinesville, GA
- Population (ZIP)
- 4,933
- Household income
- $65,417
- Rent vs Own
- Severe rent burden
- 121.0
Population outlook (Long County) Hauer SSP2
- Today (2025)
- 24,669 people
- By 2030
- 28,223 · +14.4%
- By 2040
- 35,430 · +43.6%
- By 2050
- 42,403 · +71.9%
- By 2075
- 56,996 · +131.0%
- By 2100
- 64,185 · +160.2%
Race, ethnicity, and origin ACS 2023
- Neighborhood character
- Diverse neighborhood (Simpson 0.64)
- Race & ethnicity
- Black 51% White 31% Two or more races 15% Hispanic / Latino 9%
- Hispanic origin (detail)
- Mexican 2% Puerto Rican 7%
- Common ancestry
- Slovak 1% Lithuanian 1%
- Foreign-born
- 3% · Canada
- Languages at home
- 96% English-only · Spanish 2%
Political lean MEDSL · Long
- 2024 margin
- Strong R (+29.5) · D 35.1% · R 64.6%
- 2008→2024 swing
- -5.4pp toward R · 2008: -24.1pp · 2024: -29.5pp
- All cycles
- 2024: R+29.5 2020: R+26.4 2016: R+30.8 2012: R+22.9 2008: R+24.1
Not yet ingested
- Civics
- —
Market trends
- HPI YoY
- ▲ 0.16%
- Current HPI
- 187.7716
- Rent YoY
- —
- Metro
- Hinesville, GA
- State GDP YoY
- ▲ 2.66%
- F500 in state
- 28
Industry mix (Fortune 500 HQ in GA)
| Industry | F500 HQs | Revenue |
|---|---|---|
| Paper / Packaging | 2 | $29B |
|
||
| Retail | 1 | $160B |
|
||
| Transportation / Logistics | 1 | $91B |
|
||
| Airlines | 1 | $62B |
|
||
| Consumer Goods | 1 | $47B |
|
||
| Utilities | 1 | $25B |
|
||
Price history
1 event — show timeline
- 2026-05-29 Listed $285,575 Hive MLS
Cash-flow waterfall
monthlySold comps — $/sqft
last 12 mo · ≤1 miLoading sold comps…